> ## Documentation Index
> Fetch the complete documentation index at: https://notes.kodekloud.com/llms.txt
> Use this file to discover all available pages before exploring further.
# OpenTelemetry Collector Receivers
> Overview of OpenTelemetry Collector receivers that ingest traces metrics and logs via multiple protocols translate formats and forward telemetry for processing and exporting
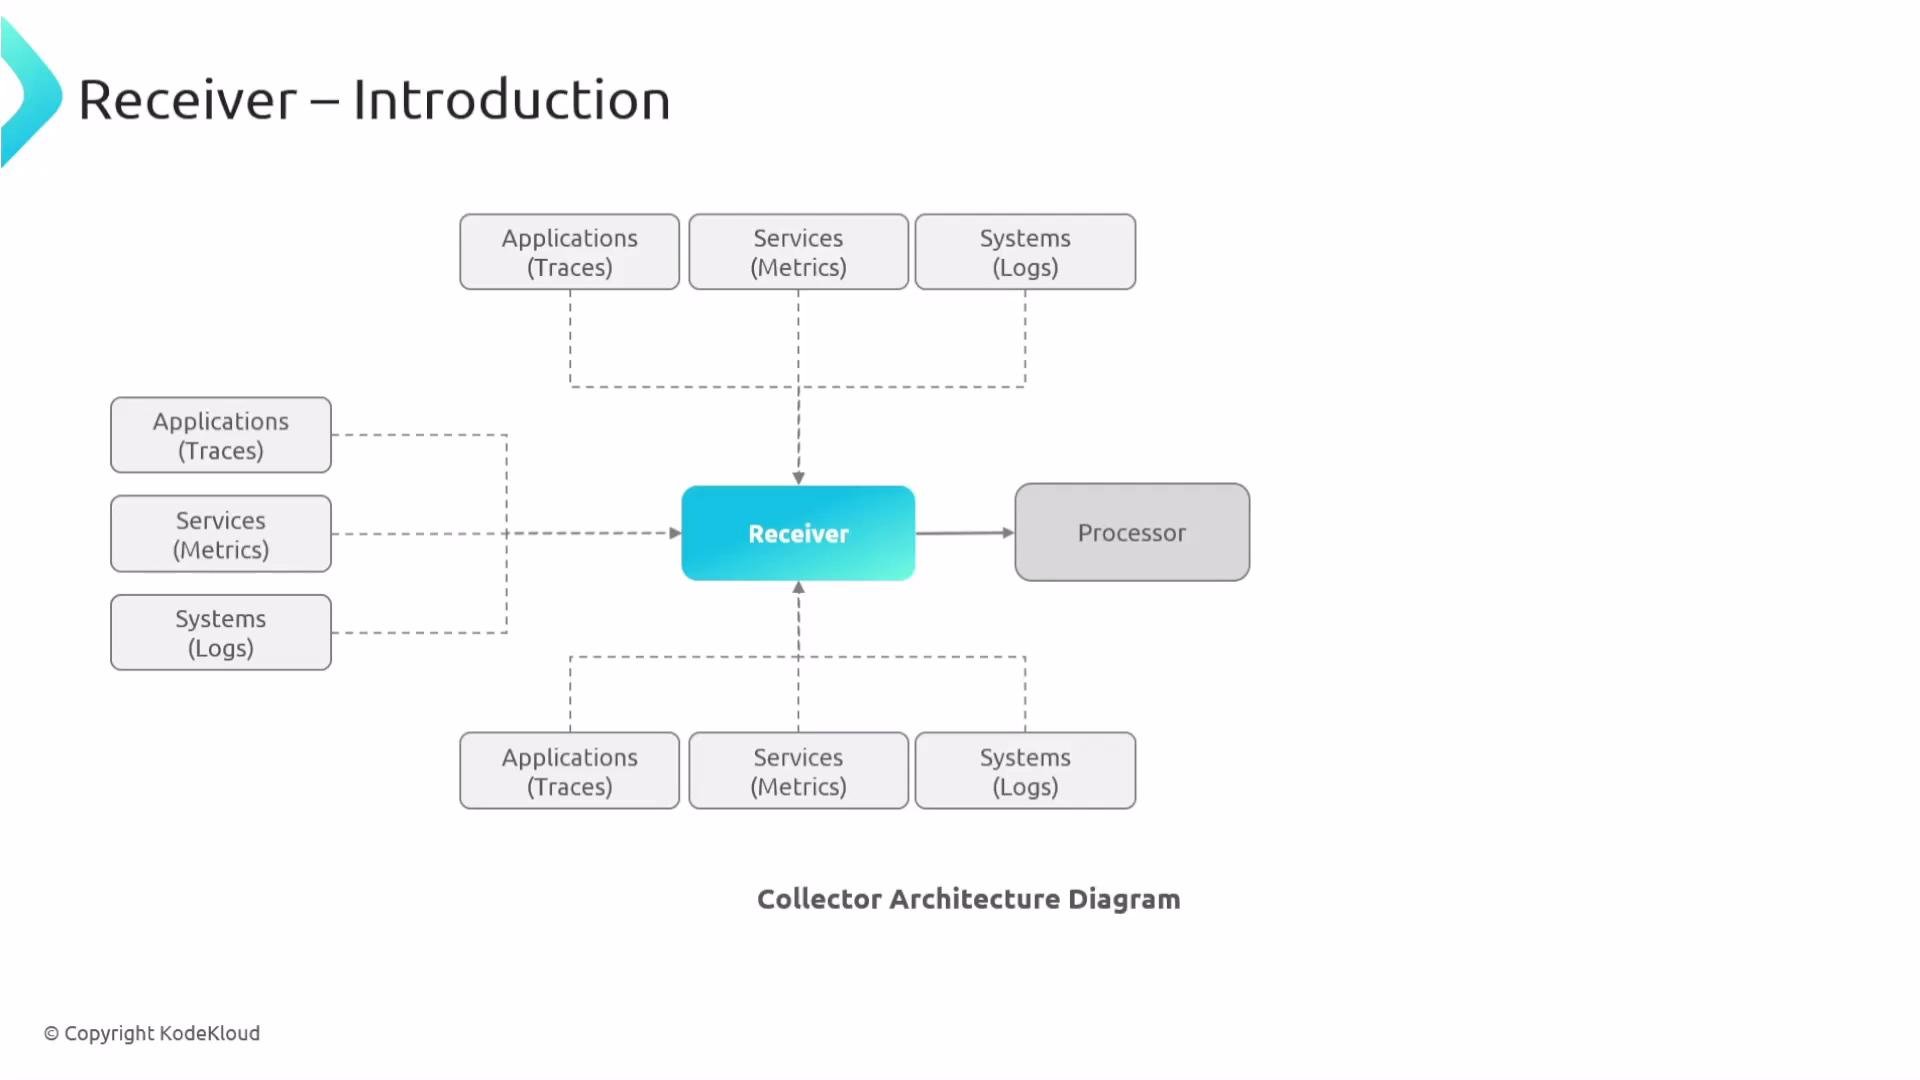
In this lesson we cover how receivers act as the Collector's entry points: they listen for telemetry (traces, metrics, logs) from applications, services, and systems, translate incoming formats into the Collector's internal representation, and hand data off to processors and exporters. Receivers support multiple protocols, standard ports, and custom configuration to meet a wide range of telemetry collection scenarios.
Receivers are the first stage in the Collector pipeline. Configure them to match your instrumented applications, Prometheus endpoints, host agents, or legacy systems so the Collector can consistently process and export telemetry.
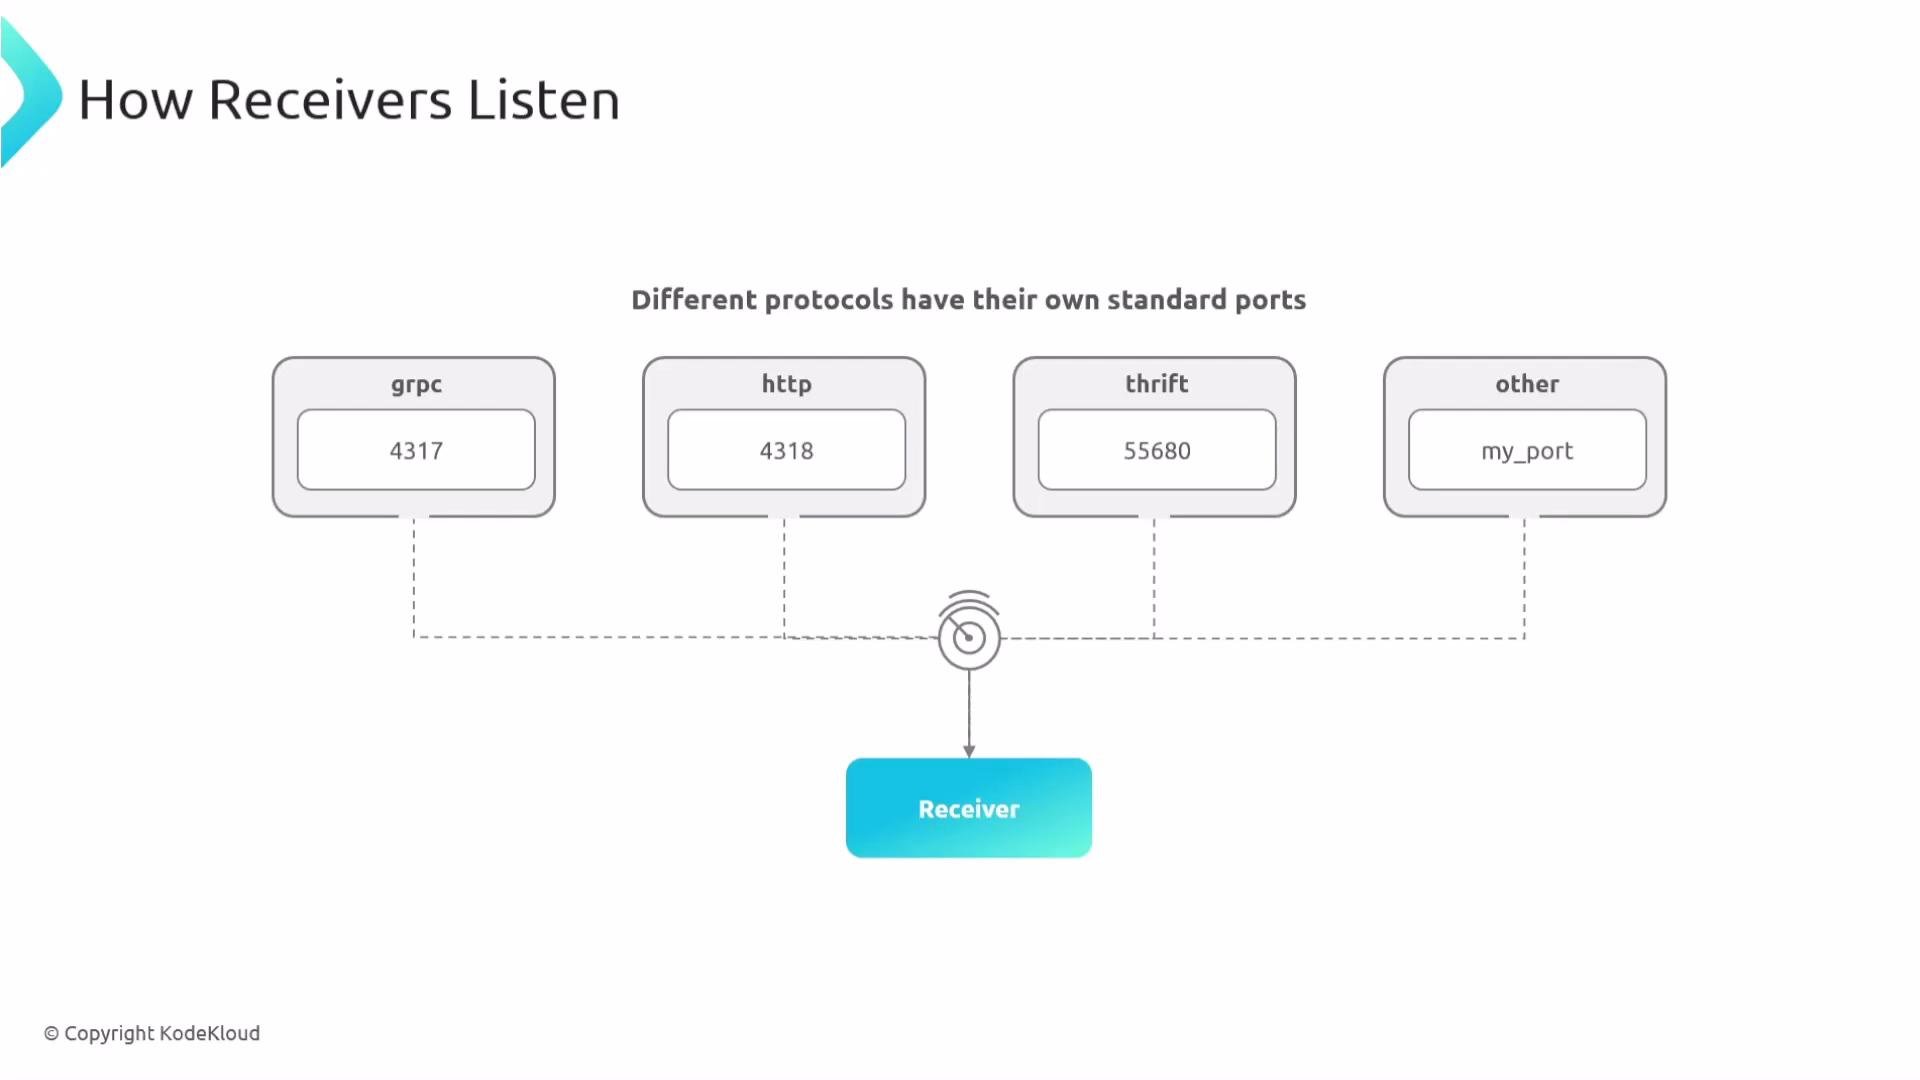
 Receivers accept telemetry over different protocols (gRPC, HTTP, Thrift, etc.) and usually listen on the standard ports listed below. You can override ports to avoid conflicts or to comply with network policies.
```yaml theme={null}
receivers:
otlp:
protocols:
grpc:
endpoint: 0.0.0.0:4317
http:
endpoint: 0.0.0.0:4318
```
Different protocols use different standard ports. Receivers listen on these ports and accept data over multiple protocols. You can also use custom ports if needed, provided the port is free.
Receivers accept telemetry over different protocols (gRPC, HTTP, Thrift, etc.) and usually listen on the standard ports listed below. You can override ports to avoid conflicts or to comply with network policies.
```yaml theme={null}
receivers:
otlp:
protocols:
grpc:
endpoint: 0.0.0.0:4317
http:
endpoint: 0.0.0.0:4318
```
Different protocols use different standard ports. Receivers listen on these ports and accept data over multiple protocols. You can also use custom ports if needed, provided the port is free.
 Here is a concrete Python example that configures an OTLP gRPC exporter to send spans from an instrumented app to the Collector on port 4317:
```python theme={null}
from opentelemetry import trace
from opentelemetry.sdk.trace import TracerProvider
from opentelemetry.sdk.trace.export import BatchSpanProcessor
from opentelemetry.exporter.otlp.proto.grpc.trace_exporter import OTLPSpanExporter
trace.set_tracer_provider(TracerProvider())
tracer = trace.get_tracer(__name__)
otlp_exporter = OTLPSpanExporter(endpoint="localhost:4317", insecure=True)
trace.get_tracer_provider().add_span_processor(
BatchSpanProcessor(otlp_exporter)
)
with tracer.start_as_current_span("demo-span"):
print("Span sent to Collector!")
```
If you need to receive traces, metrics, and logs from multiple sources, register multiple receivers under the `receivers:` key. For example, the Collector can expose OTLP endpoints, scrape Prometheus metrics, and tail log files concurrently:
```yaml theme={null}
receivers:
otlp:
protocols:
grpc:
endpoint: 0.0.0.0:4317
http:
endpoint: 0.0.0.0:4318
prometheus:
config:
scrape_configs:
- job_name: 'demo'
static_configs:
- targets: ['localhost:8080']
filelog:
include: [ /var/log/*.log ]
```
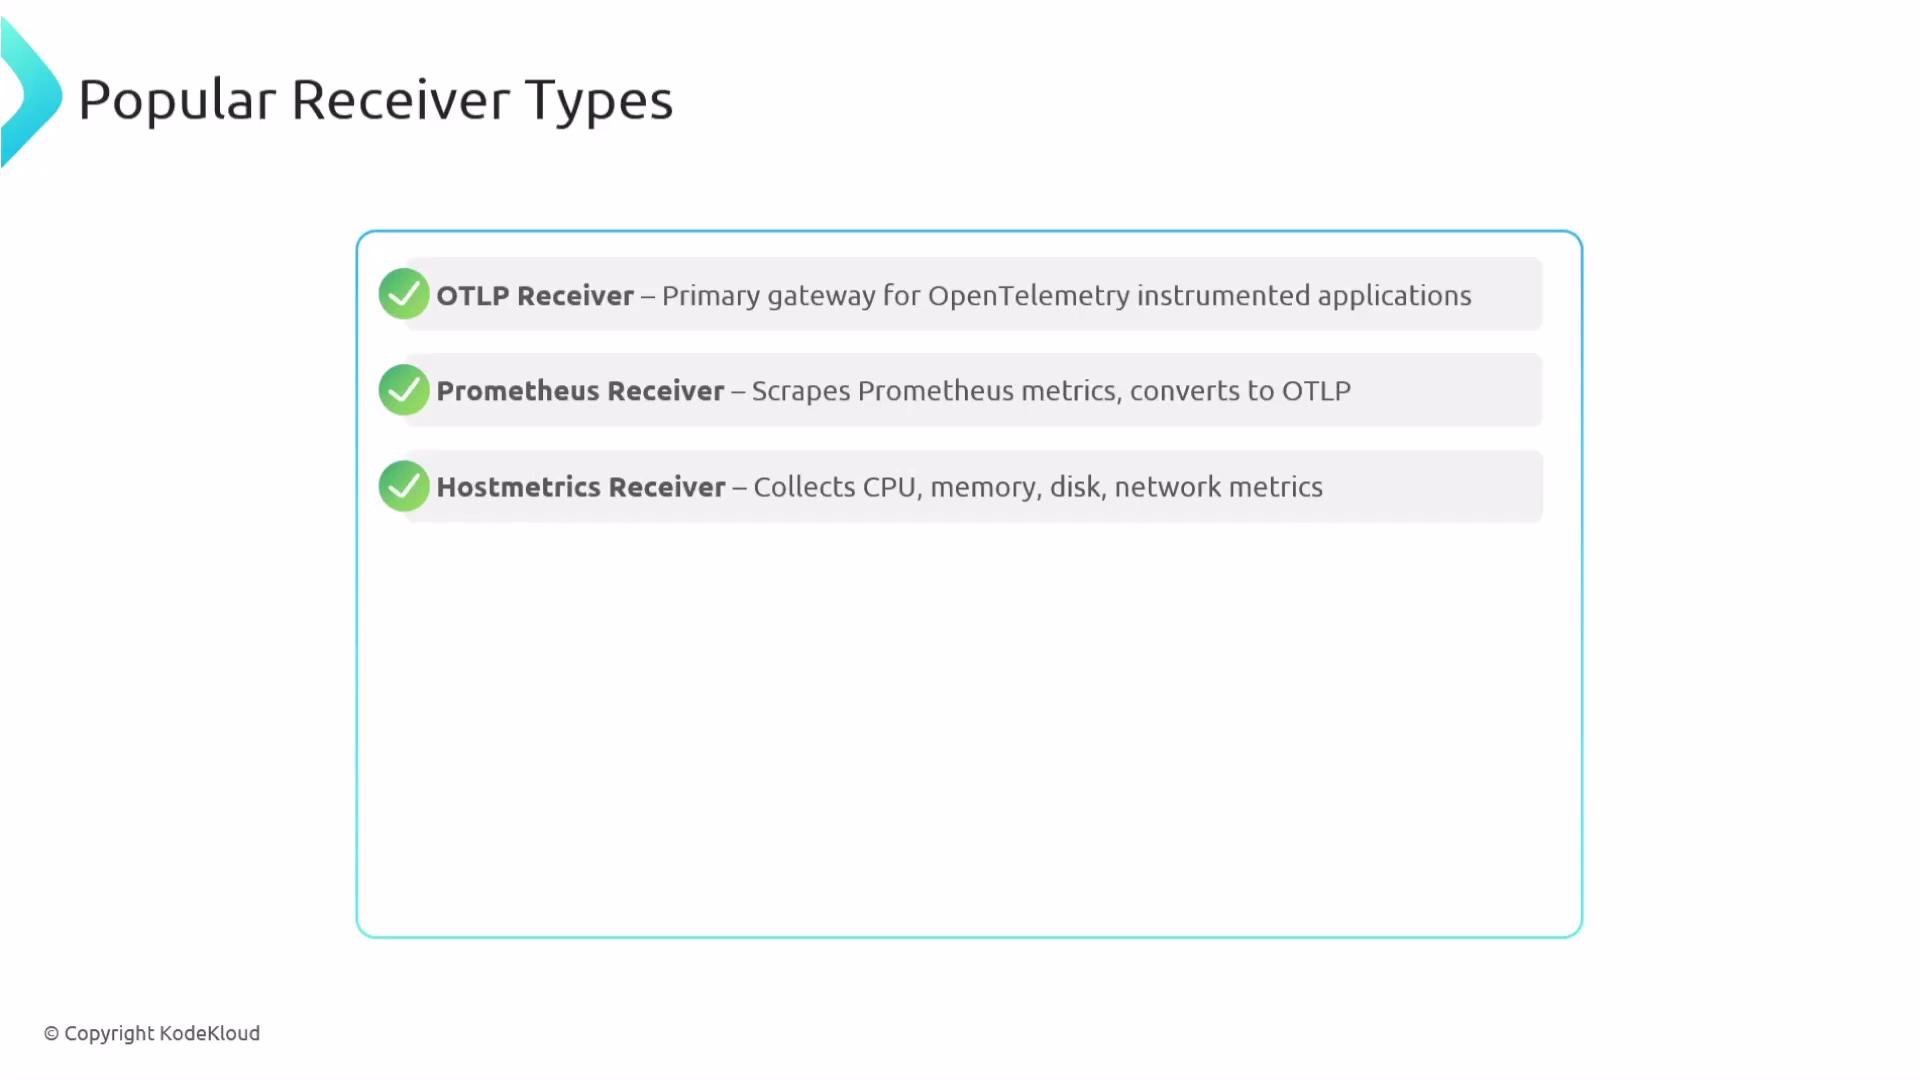
Below are concise descriptions and canonical configuration examples for commonly used receivers. Use these as templates to assemble the appropriate collection surface for your monitoring stack.
Receiver summary table
| Receiver | Purpose / Use case | Typical port / notes |
| -----------: | -------------------------------------------------------------------- | -------------------------------------------- |
| OTLP | Primary gateway for instrumented apps; accepts traces, metrics, logs | `grpc: 4317`, `http: 4318` |
| Prometheus | Scrapes Prometheus endpoints and converts metrics to OTLP | Uses Prometheus scrape configs |
| hostmetrics | Collects CPU, memory, disk, network for host-level observability | Run Agent (DaemonSet) for host-level metrics |
| kubeletstats | Pulls pod/container metrics from kubelet on each node | Connects to kubelet API (10250) |
| k8s\_cluster | Gathers cluster-wide metrics and node conditions | Use as single-replica Deployment |
| k8sobjects | Captures Kubernetes objects (events, pods, services) | Best as single-replica Deployment |
| filelog | Tails and parses log files, supports rotation & compression | File paths and patterns |
| journald | Reads systemd journal logs | Filter by units and log levels |
| syslog | Listens for syslog messages over TCP/UDP | RFC formats; ports 514 (UDP/TCP) |
| SNMP | Polls network/IoT devices for metrics | `udp://:161` |
| Jaeger | Accepts Jaeger traces, translates to OTLP | Multiple ports/protocols for Jaeger clients |
| Zipkin | Receives Zipkin spans (V1/V2 JSON) | Default port 9411 |
| OpenCensus | For legacy OpenCensus telemetry | Default port 55678 |
OTLP receiver
* Primary gateway for instrumented apps.
* Accepts OpenTelemetry Protocol data via gRPC and HTTP for traces, metrics, and logs (same endpoint for all signal types).
```yaml theme={null}
receivers:
otlp:
protocols:
grpc:
endpoint: 0.0.0.0:4317
http:
endpoint: 0.0.0.0:4318
```
Prometheus receiver
* Scrapes metrics from Prometheus endpoints and forwards them as OTLP.
* Uses standard Prometheus-style config and service discovery.
```yaml theme={null}
receivers:
prometheus:
config:
scrape_configs:
- job_name: 'my-app'
scrape_interval: 30s
static_configs:
- targets: ['localhost:8080']
```
Host metrics receiver
* Collects system-level metrics (CPU, memory, disk, network).
* Useful when running the Collector as an agent to capture host performance.
```yaml theme={null}
receivers:
hostmetrics:
collection_interval: 30s
scrapers:
cpu:
memory:
disk:
filesystem:
network:
```
Kubelet stats receiver
* Pulls pod- and container-level metrics directly from the kubelet on each node.
* Typically run as a DaemonSet so each Collector instance can contact its local kubelet.
```yaml theme={null}
receivers:
kubeletstats:
collection_interval: 20s
auth_type: serviceAccount
endpoint: "https://${env:K8S_NODE_NAME}:10250"
insecure_skip_verify: true
```
Kubernetes cluster receiver
* Gathers cluster-wide metrics and node conditions by querying the Kubernetes API.
* Best run as a Deployment (single replica) to avoid duplicate cluster-level data.
```yaml theme={null}
receivers:
k8s_cluster:
auth_type: serviceAccount
collection_interval: 10s
node_conditions_to_report:
- Ready
- MemoryPressure
```
Kubernetes objects receiver
* Captures Kubernetes objects (events, pods, services) as structured logs or telemetry.
* Run as a Deployment with one replica to prevent duplicate events.
```yaml theme={null}
receivers:
k8sobjects:
auth_type: serviceAccount
objects:
- name: events
mode: watch
- name: pods
mode: pull
interval: 30s
```
Run node-level receivers (like kubeletstats) as DaemonSets. Run cluster-level receivers (like k8s\_cluster and k8sobjects) as a Deployment with one replica to avoid duplicate data.
File log receiver
* Tails log files, supports compressed files, handles rotations, and persists file positions across restarts.
```yaml theme={null}
receivers:
filelog:
include:
- /var/log/pods/**/*/*.log
filelog/compressed:
include:
- /var/app/*.gz
compression: gzip
start_at: beginning
```
Journald receiver
* Reads logs from systemd journal units and supports filtering by unit and log level.
* Useful for collecting system and container logs on Linux hosts.
```yaml theme={null}
receivers:
journald:
include_units: ['kubelet', 'docker']
levels: ['info', 'warn', 'err']
```
Syslog receiver
* Listens for syslog messages over TCP or UDP (RFC formats).
* Common for network devices, firewalls, and centralized syslog collection.
```yaml theme={null}
receivers:
syslog:
tcp:
listen_address: 0.0.0.0:514
udp:
listen_address: 0.0.0.0:514
protocol: rfc5424
```
SNMP receiver
* Polls network or IoT devices via SNMP to collect metrics (e.g., uptime, interface counters).
```yaml theme={null}
receivers:
snmp:
endpoint: udp://192.168.1.1:161
version: v2c
community: public
collection_interval: 30s
metrics:
system.uptime:
unit: s
gauge:
value_type: double
scalar_oids:
- oid: "1.3.6.1.2.1.1.3.0"
```
Jaeger receiver
* Accepts traces from Jaeger clients/agents and translates them to OTLP — useful when migrating from Jaeger.
```yaml theme={null}
receivers:
jaeger:
protocols:
grpc:
endpoint: 0.0.0.0:14250
thrift_http:
endpoint: 0.0.0.0:14268
thrift_compact:
endpoint: 0.0.0.0:6831
```
Zipkin receiver
* Receives Zipkin spans (V1/V2 JSON) and converts them into OTLP for unified processing.
```yaml theme={null}
receivers:
zipkin:
endpoint: 0.0.0.0:9411
```
OpenCensus receiver
* Ingests telemetry from applications still using OpenCensus and converts traces and metrics to OTLP.
```yaml theme={null}
receivers:
opencensus:
endpoint: 0.0.0.0:55678
```
Here is a concrete Python example that configures an OTLP gRPC exporter to send spans from an instrumented app to the Collector on port 4317:
```python theme={null}
from opentelemetry import trace
from opentelemetry.sdk.trace import TracerProvider
from opentelemetry.sdk.trace.export import BatchSpanProcessor
from opentelemetry.exporter.otlp.proto.grpc.trace_exporter import OTLPSpanExporter
trace.set_tracer_provider(TracerProvider())
tracer = trace.get_tracer(__name__)
otlp_exporter = OTLPSpanExporter(endpoint="localhost:4317", insecure=True)
trace.get_tracer_provider().add_span_processor(
BatchSpanProcessor(otlp_exporter)
)
with tracer.start_as_current_span("demo-span"):
print("Span sent to Collector!")
```
If you need to receive traces, metrics, and logs from multiple sources, register multiple receivers under the `receivers:` key. For example, the Collector can expose OTLP endpoints, scrape Prometheus metrics, and tail log files concurrently:
```yaml theme={null}
receivers:
otlp:
protocols:
grpc:
endpoint: 0.0.0.0:4317
http:
endpoint: 0.0.0.0:4318
prometheus:
config:
scrape_configs:
- job_name: 'demo'
static_configs:
- targets: ['localhost:8080']
filelog:
include: [ /var/log/*.log ]
```
Below are concise descriptions and canonical configuration examples for commonly used receivers. Use these as templates to assemble the appropriate collection surface for your monitoring stack.
Receiver summary table
| Receiver | Purpose / Use case | Typical port / notes |
| -----------: | -------------------------------------------------------------------- | -------------------------------------------- |
| OTLP | Primary gateway for instrumented apps; accepts traces, metrics, logs | `grpc: 4317`, `http: 4318` |
| Prometheus | Scrapes Prometheus endpoints and converts metrics to OTLP | Uses Prometheus scrape configs |
| hostmetrics | Collects CPU, memory, disk, network for host-level observability | Run Agent (DaemonSet) for host-level metrics |
| kubeletstats | Pulls pod/container metrics from kubelet on each node | Connects to kubelet API (10250) |
| k8s\_cluster | Gathers cluster-wide metrics and node conditions | Use as single-replica Deployment |
| k8sobjects | Captures Kubernetes objects (events, pods, services) | Best as single-replica Deployment |
| filelog | Tails and parses log files, supports rotation & compression | File paths and patterns |
| journald | Reads systemd journal logs | Filter by units and log levels |
| syslog | Listens for syslog messages over TCP/UDP | RFC formats; ports 514 (UDP/TCP) |
| SNMP | Polls network/IoT devices for metrics | `udp://:161` |
| Jaeger | Accepts Jaeger traces, translates to OTLP | Multiple ports/protocols for Jaeger clients |
| Zipkin | Receives Zipkin spans (V1/V2 JSON) | Default port 9411 |
| OpenCensus | For legacy OpenCensus telemetry | Default port 55678 |
OTLP receiver
* Primary gateway for instrumented apps.
* Accepts OpenTelemetry Protocol data via gRPC and HTTP for traces, metrics, and logs (same endpoint for all signal types).
```yaml theme={null}
receivers:
otlp:
protocols:
grpc:
endpoint: 0.0.0.0:4317
http:
endpoint: 0.0.0.0:4318
```
Prometheus receiver
* Scrapes metrics from Prometheus endpoints and forwards them as OTLP.
* Uses standard Prometheus-style config and service discovery.
```yaml theme={null}
receivers:
prometheus:
config:
scrape_configs:
- job_name: 'my-app'
scrape_interval: 30s
static_configs:
- targets: ['localhost:8080']
```
Host metrics receiver
* Collects system-level metrics (CPU, memory, disk, network).
* Useful when running the Collector as an agent to capture host performance.
```yaml theme={null}
receivers:
hostmetrics:
collection_interval: 30s
scrapers:
cpu:
memory:
disk:
filesystem:
network:
```
Kubelet stats receiver
* Pulls pod- and container-level metrics directly from the kubelet on each node.
* Typically run as a DaemonSet so each Collector instance can contact its local kubelet.
```yaml theme={null}
receivers:
kubeletstats:
collection_interval: 20s
auth_type: serviceAccount
endpoint: "https://${env:K8S_NODE_NAME}:10250"
insecure_skip_verify: true
```
Kubernetes cluster receiver
* Gathers cluster-wide metrics and node conditions by querying the Kubernetes API.
* Best run as a Deployment (single replica) to avoid duplicate cluster-level data.
```yaml theme={null}
receivers:
k8s_cluster:
auth_type: serviceAccount
collection_interval: 10s
node_conditions_to_report:
- Ready
- MemoryPressure
```
Kubernetes objects receiver
* Captures Kubernetes objects (events, pods, services) as structured logs or telemetry.
* Run as a Deployment with one replica to prevent duplicate events.
```yaml theme={null}
receivers:
k8sobjects:
auth_type: serviceAccount
objects:
- name: events
mode: watch
- name: pods
mode: pull
interval: 30s
```
Run node-level receivers (like kubeletstats) as DaemonSets. Run cluster-level receivers (like k8s\_cluster and k8sobjects) as a Deployment with one replica to avoid duplicate data.
File log receiver
* Tails log files, supports compressed files, handles rotations, and persists file positions across restarts.
```yaml theme={null}
receivers:
filelog:
include:
- /var/log/pods/**/*/*.log
filelog/compressed:
include:
- /var/app/*.gz
compression: gzip
start_at: beginning
```
Journald receiver
* Reads logs from systemd journal units and supports filtering by unit and log level.
* Useful for collecting system and container logs on Linux hosts.
```yaml theme={null}
receivers:
journald:
include_units: ['kubelet', 'docker']
levels: ['info', 'warn', 'err']
```
Syslog receiver
* Listens for syslog messages over TCP or UDP (RFC formats).
* Common for network devices, firewalls, and centralized syslog collection.
```yaml theme={null}
receivers:
syslog:
tcp:
listen_address: 0.0.0.0:514
udp:
listen_address: 0.0.0.0:514
protocol: rfc5424
```
SNMP receiver
* Polls network or IoT devices via SNMP to collect metrics (e.g., uptime, interface counters).
```yaml theme={null}
receivers:
snmp:
endpoint: udp://192.168.1.1:161
version: v2c
community: public
collection_interval: 30s
metrics:
system.uptime:
unit: s
gauge:
value_type: double
scalar_oids:
- oid: "1.3.6.1.2.1.1.3.0"
```
Jaeger receiver
* Accepts traces from Jaeger clients/agents and translates them to OTLP — useful when migrating from Jaeger.
```yaml theme={null}
receivers:
jaeger:
protocols:
grpc:
endpoint: 0.0.0.0:14250
thrift_http:
endpoint: 0.0.0.0:14268
thrift_compact:
endpoint: 0.0.0.0:6831
```
Zipkin receiver
* Receives Zipkin spans (V1/V2 JSON) and converts them into OTLP for unified processing.
```yaml theme={null}
receivers:
zipkin:
endpoint: 0.0.0.0:9411
```
OpenCensus receiver
* Ingests telemetry from applications still using OpenCensus and converts traces and metrics to OTLP.
```yaml theme={null}
receivers:
opencensus:
endpoint: 0.0.0.0:55678
```
 Receivers enable unified collection of traces, metrics, and logs from different sources on the same Collector. They translate incoming formats into the Collector's internal representation, allowing processors and exporters to operate consistently across signals and sources.
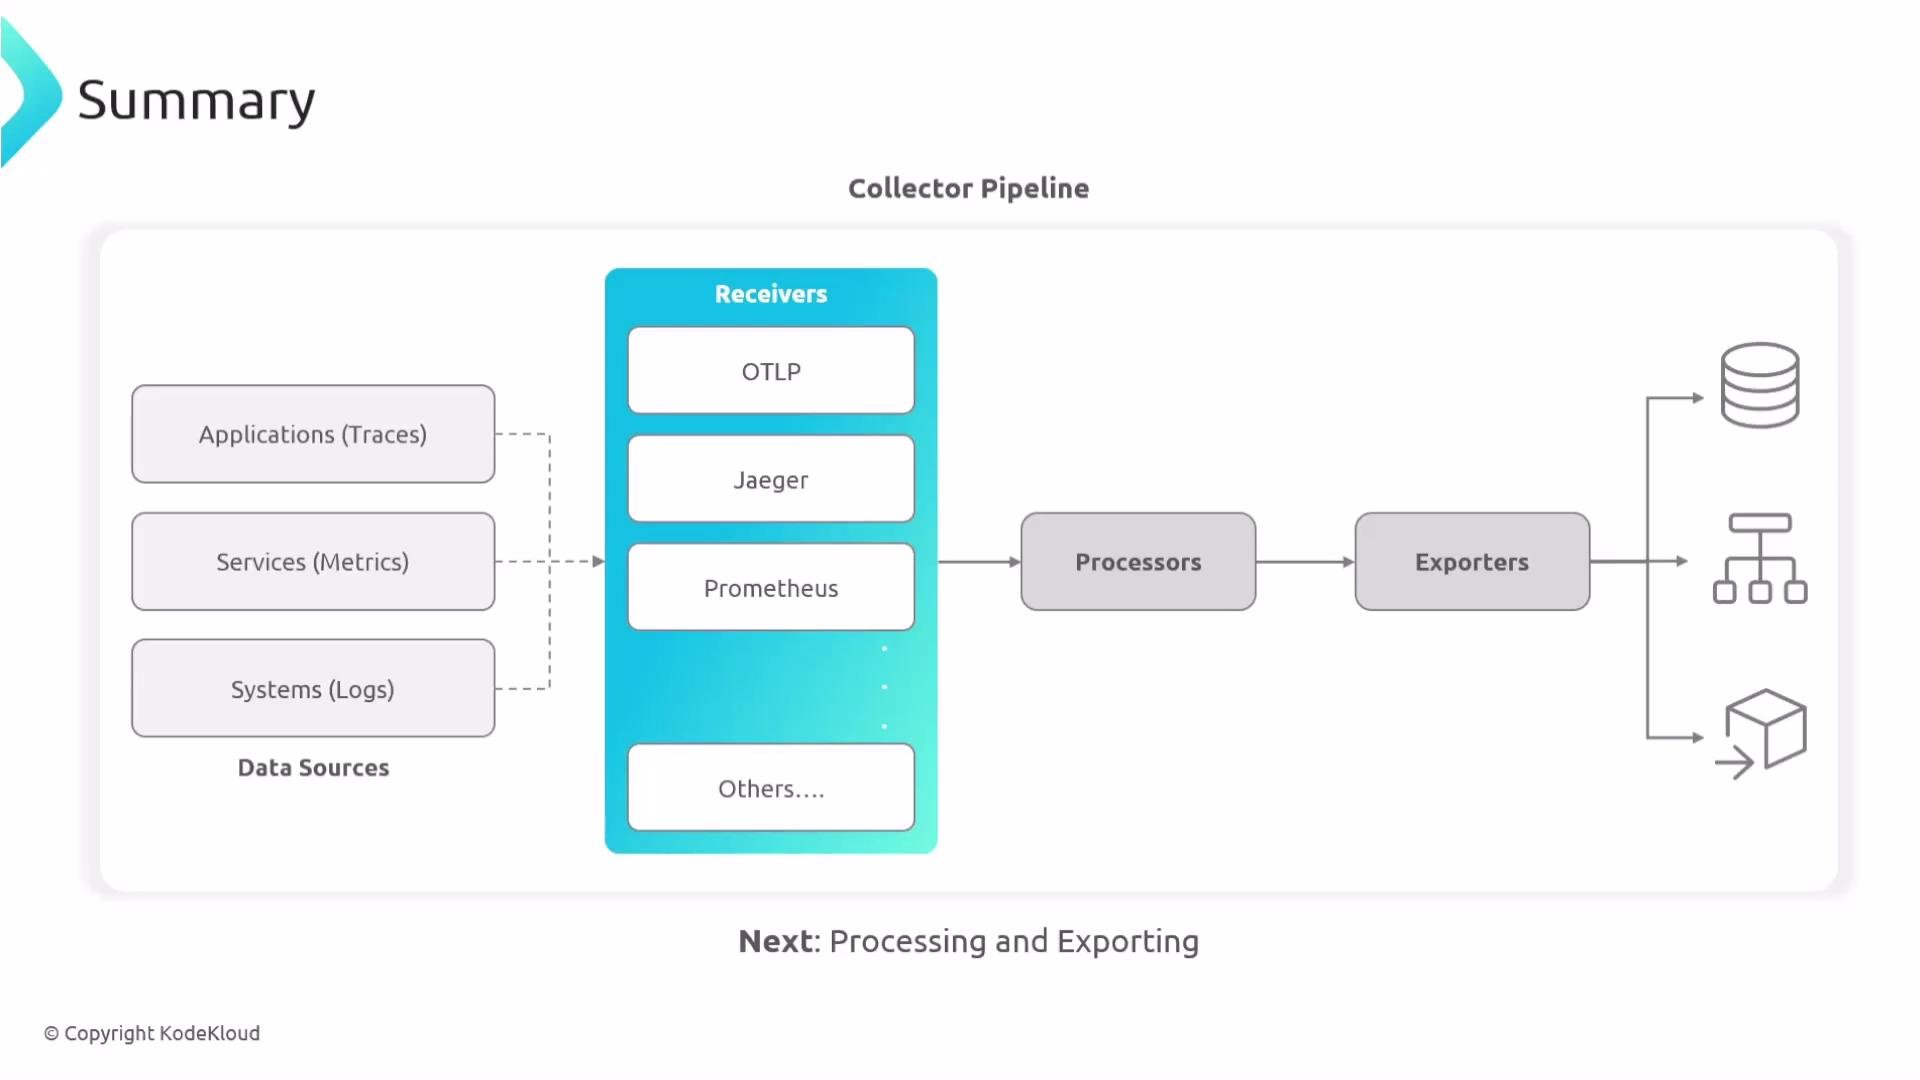 There are many more receivers available (especially in the `opentelemetry-collector-contrib` repository) beyond those shown here — including integrations for legacy protocols and vendor-specific sources. Receivers are the starting point of your telemetry journey: they listen, collect, and translate incoming telemetry so the rest of your Collector pipeline can process and export it reliably.
References and further reading
* [OpenTelemetry Collector Contrib repository](https://github.com/open-telemetry/opentelemetry-collector-contrib)
* [OpenTelemetry Collector documentation](https://opentelemetry.io/docs/collector/)
That's all about receivers.
There are many more receivers available (especially in the `opentelemetry-collector-contrib` repository) beyond those shown here — including integrations for legacy protocols and vendor-specific sources. Receivers are the starting point of your telemetry journey: they listen, collect, and translate incoming telemetry so the rest of your Collector pipeline can process and export it reliably.
References and further reading
* [OpenTelemetry Collector Contrib repository](https://github.com/open-telemetry/opentelemetry-collector-contrib)
* [OpenTelemetry Collector documentation](https://opentelemetry.io/docs/collector/)
That's all about receivers.