> ## Documentation Index
> Fetch the complete documentation index at: https://notes.kodekloud.com/llms.txt
> Use this file to discover all available pages before exploring further.
# Service and Pipelines Explained
> Explains OpenTelemetry Collector service and pipelines, wiring receivers processors exporters and extensions to build route and manage telemetry flows with examples and best practices.
In this lesson we break down the service and pipelines of the OpenTelemetry Collector and show how to wire receivers, processors, exporters, and runtime extensions together for reliable telemetry collection.
Each telemetry signal (traces, metrics, logs) flows through its own pipeline. The `service` section acts as the Collector's control plane — it activates pipelines, selects which component instances are used, and defines processor execution order and internal telemetry settings.
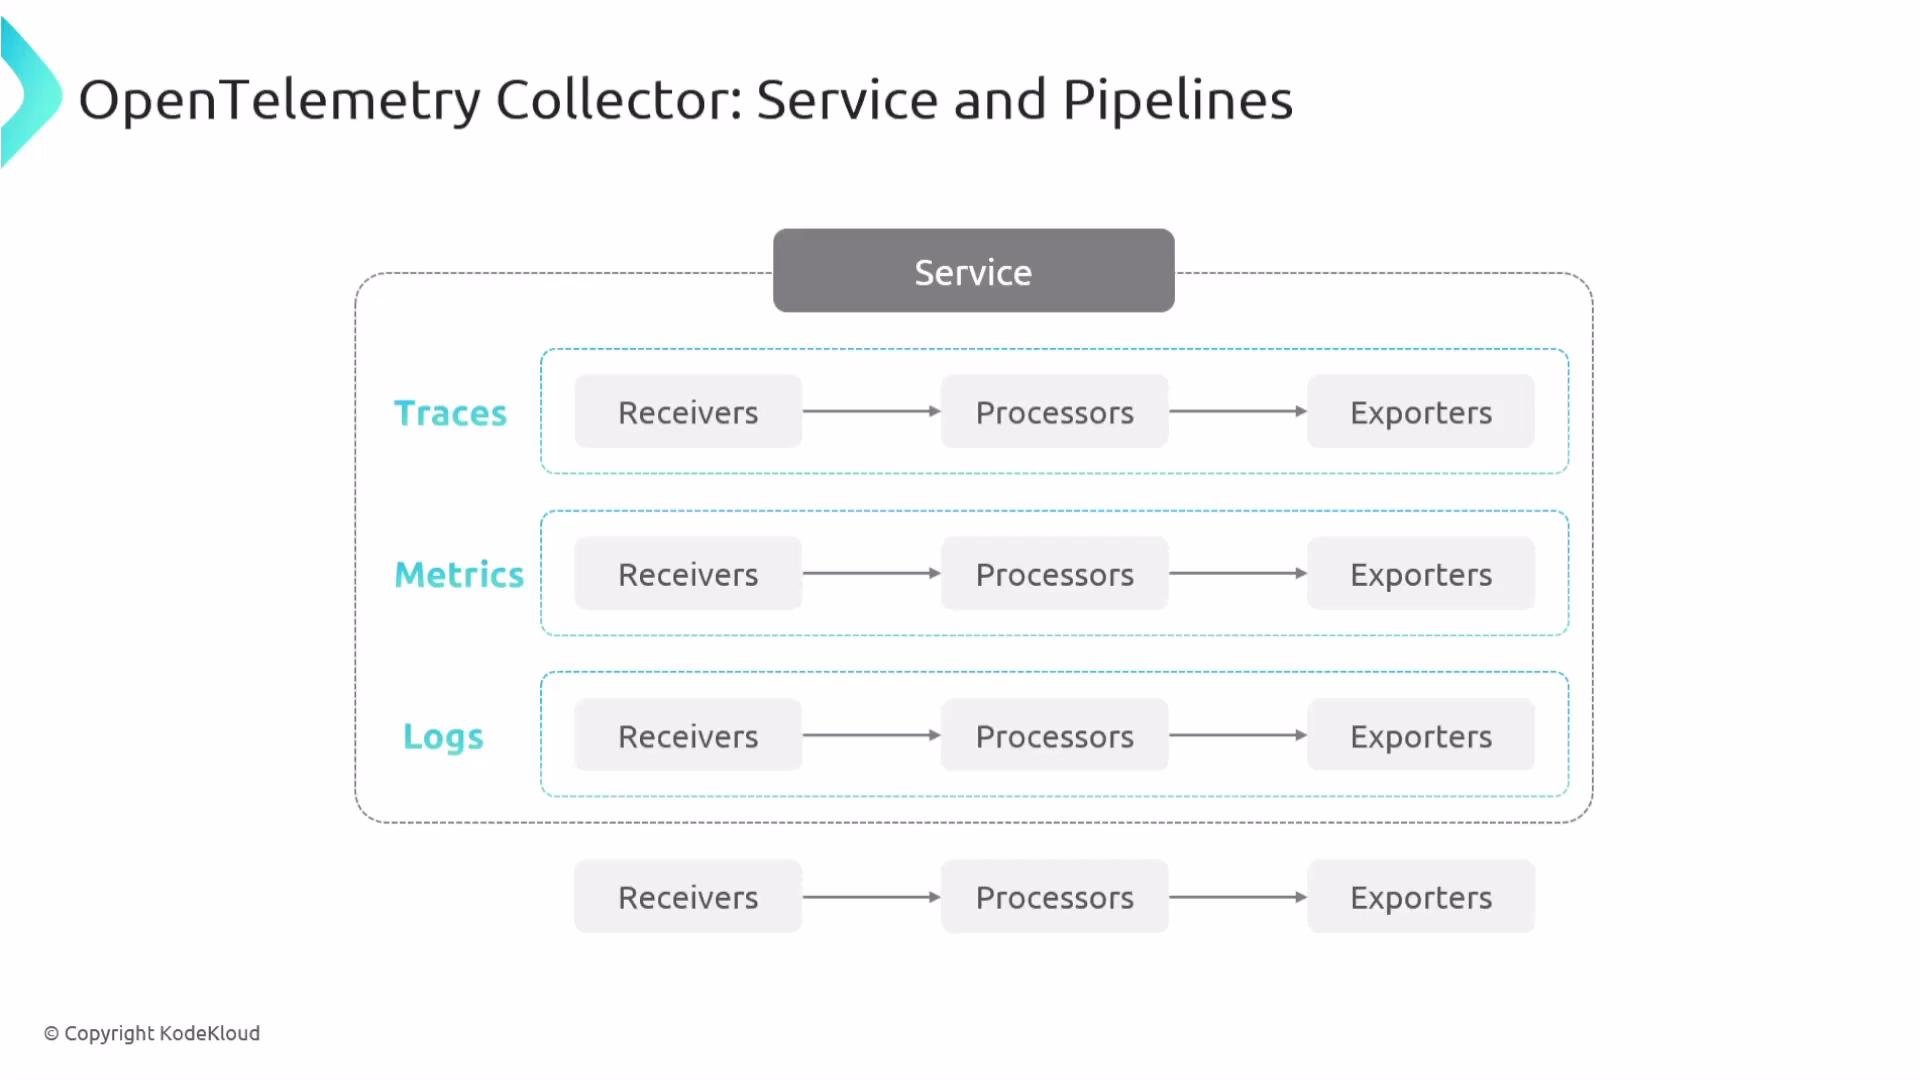 Overview: how pipelines fit together
* Receivers ingest telemetry into the Collector.
* Processors transform, filter, or enrich telemetry; order is significant (executed left-to-right).
* Exporters send telemetry to backends (or local logging/debugging exporters).
* The `service` block references component instances and binds them to each pipeline.
Quick reference: component roles
| Component type | Purpose | Example usage |
| -------------- | ----------------------------------------------: | -------------------------------------------- |
| Receiver | Ingest telemetry from sources | `otlp` (gRPC/HTTP), `prometheus` |
| Processor | Transform/filter/limit telemetry; order matters | `attributes`, `batch`, `memory_limiter` |
| Exporter | Deliver telemetry to backends or local debug | `otlphttp`, `prometheusremotewrite`, `debug` |
| Extension | Runtime features not part of pipelines | `health_check`, `pprof`, `file_storage` |
Basic idea (visualized):
```text theme={null}
Pipelines:
service
├─ pipelines
│ └─ traces
└─ processors ← left-to-right order matters
```
Minimal YAML example showing component definitions and pipeline activation:
```yaml theme={null}
receivers:
otlp:
protocols:
grpc:
endpoint: 0.0.0.0:4317
http:
endpoint: 0.0.0.0:4318
otlp/ingest2: # type/name — second instance of the otlp receiver
processors:
batch: {}
attributes/sanitize: {}
exporters:
otlphttp:
endpoint: https://vendorname.example.com:4318
debug:
verbosity: normal
service:
pipelines:
traces/prod:
receivers: [otlp]
processors: [attributes/sanitize, batch] # processor order matters
exporters: [otlphttp]
traces/dev:
receivers: [otlp/ingest2]
processors: [attributes/sanitize]
exporters: [debug]
```
Naming and instances
* You can create multiple instances of a component type using `type/name` (example: `otlp/ingest2`).
* Any instance referenced by a pipeline must exist under the corresponding top-level `receivers`, `processors`, or `exporters` section.
* If a component is not listed in the `service` pipelines, it will not be active.
Telemetry and internal metrics
* The `service` block also configures the Collector’s internal logs and metrics.
* Older configs used a single `metrics.address` field. Current Collector releases prefer `telemetry.metrics.readers` for flexible pull (Prometheus) and push (periodic) strategies.
Processor order matters. Put limiters or normalizers (for example `memory_limiter`, `attributes`) before the `batch` processor so transformations and limits are applied prior to batching.
Deprecated (older style):
```yaml theme={null}
# Deprecated style (older releases)
metrics:
address: "0.0.0.0:8888" # single endpoint for Prometheus scraping
telemetry:
logs:
level: "INFO"
```
Recommended (current) style using readers:
```yaml theme={null}
telemetry:
logs:
level: "INFO"
metrics:
level: normal
readers:
- pull:
exporter:
prometheus:
host: "0.0.0.0"
port: 8888
- periodic:
exporter:
otlp:
endpoint: "https://telemetry.vendorname.example.com:4318"
```
Using readers:
* `pull`: exposes a Prometheus scrape endpoint.
* `periodic`: periodically pushes Collector-internal metrics to an OTLP endpoint.
* Both readers can run concurrently to support mixed workflows.
Fan-out: send same telemetry to multiple exporters
Overview: how pipelines fit together
* Receivers ingest telemetry into the Collector.
* Processors transform, filter, or enrich telemetry; order is significant (executed left-to-right).
* Exporters send telemetry to backends (or local logging/debugging exporters).
* The `service` block references component instances and binds them to each pipeline.
Quick reference: component roles
| Component type | Purpose | Example usage |
| -------------- | ----------------------------------------------: | -------------------------------------------- |
| Receiver | Ingest telemetry from sources | `otlp` (gRPC/HTTP), `prometheus` |
| Processor | Transform/filter/limit telemetry; order matters | `attributes`, `batch`, `memory_limiter` |
| Exporter | Deliver telemetry to backends or local debug | `otlphttp`, `prometheusremotewrite`, `debug` |
| Extension | Runtime features not part of pipelines | `health_check`, `pprof`, `file_storage` |
Basic idea (visualized):
```text theme={null}
Pipelines:
service
├─ pipelines
│ └─ traces
└─ processors ← left-to-right order matters
```
Minimal YAML example showing component definitions and pipeline activation:
```yaml theme={null}
receivers:
otlp:
protocols:
grpc:
endpoint: 0.0.0.0:4317
http:
endpoint: 0.0.0.0:4318
otlp/ingest2: # type/name — second instance of the otlp receiver
processors:
batch: {}
attributes/sanitize: {}
exporters:
otlphttp:
endpoint: https://vendorname.example.com:4318
debug:
verbosity: normal
service:
pipelines:
traces/prod:
receivers: [otlp]
processors: [attributes/sanitize, batch] # processor order matters
exporters: [otlphttp]
traces/dev:
receivers: [otlp/ingest2]
processors: [attributes/sanitize]
exporters: [debug]
```
Naming and instances
* You can create multiple instances of a component type using `type/name` (example: `otlp/ingest2`).
* Any instance referenced by a pipeline must exist under the corresponding top-level `receivers`, `processors`, or `exporters` section.
* If a component is not listed in the `service` pipelines, it will not be active.
Telemetry and internal metrics
* The `service` block also configures the Collector’s internal logs and metrics.
* Older configs used a single `metrics.address` field. Current Collector releases prefer `telemetry.metrics.readers` for flexible pull (Prometheus) and push (periodic) strategies.
Processor order matters. Put limiters or normalizers (for example `memory_limiter`, `attributes`) before the `batch` processor so transformations and limits are applied prior to batching.
Deprecated (older style):
```yaml theme={null}
# Deprecated style (older releases)
metrics:
address: "0.0.0.0:8888" # single endpoint for Prometheus scraping
telemetry:
logs:
level: "INFO"
```
Recommended (current) style using readers:
```yaml theme={null}
telemetry:
logs:
level: "INFO"
metrics:
level: normal
readers:
- pull:
exporter:
prometheus:
host: "0.0.0.0"
port: 8888
- periodic:
exporter:
otlp:
endpoint: "https://telemetry.vendorname.example.com:4318"
```
Using readers:
* `pull`: exposes a Prometheus scrape endpoint.
* `periodic`: periodically pushes Collector-internal metrics to an OTLP endpoint.
* Both readers can run concurrently to support mixed workflows.
Fan-out: send same telemetry to multiple exporters
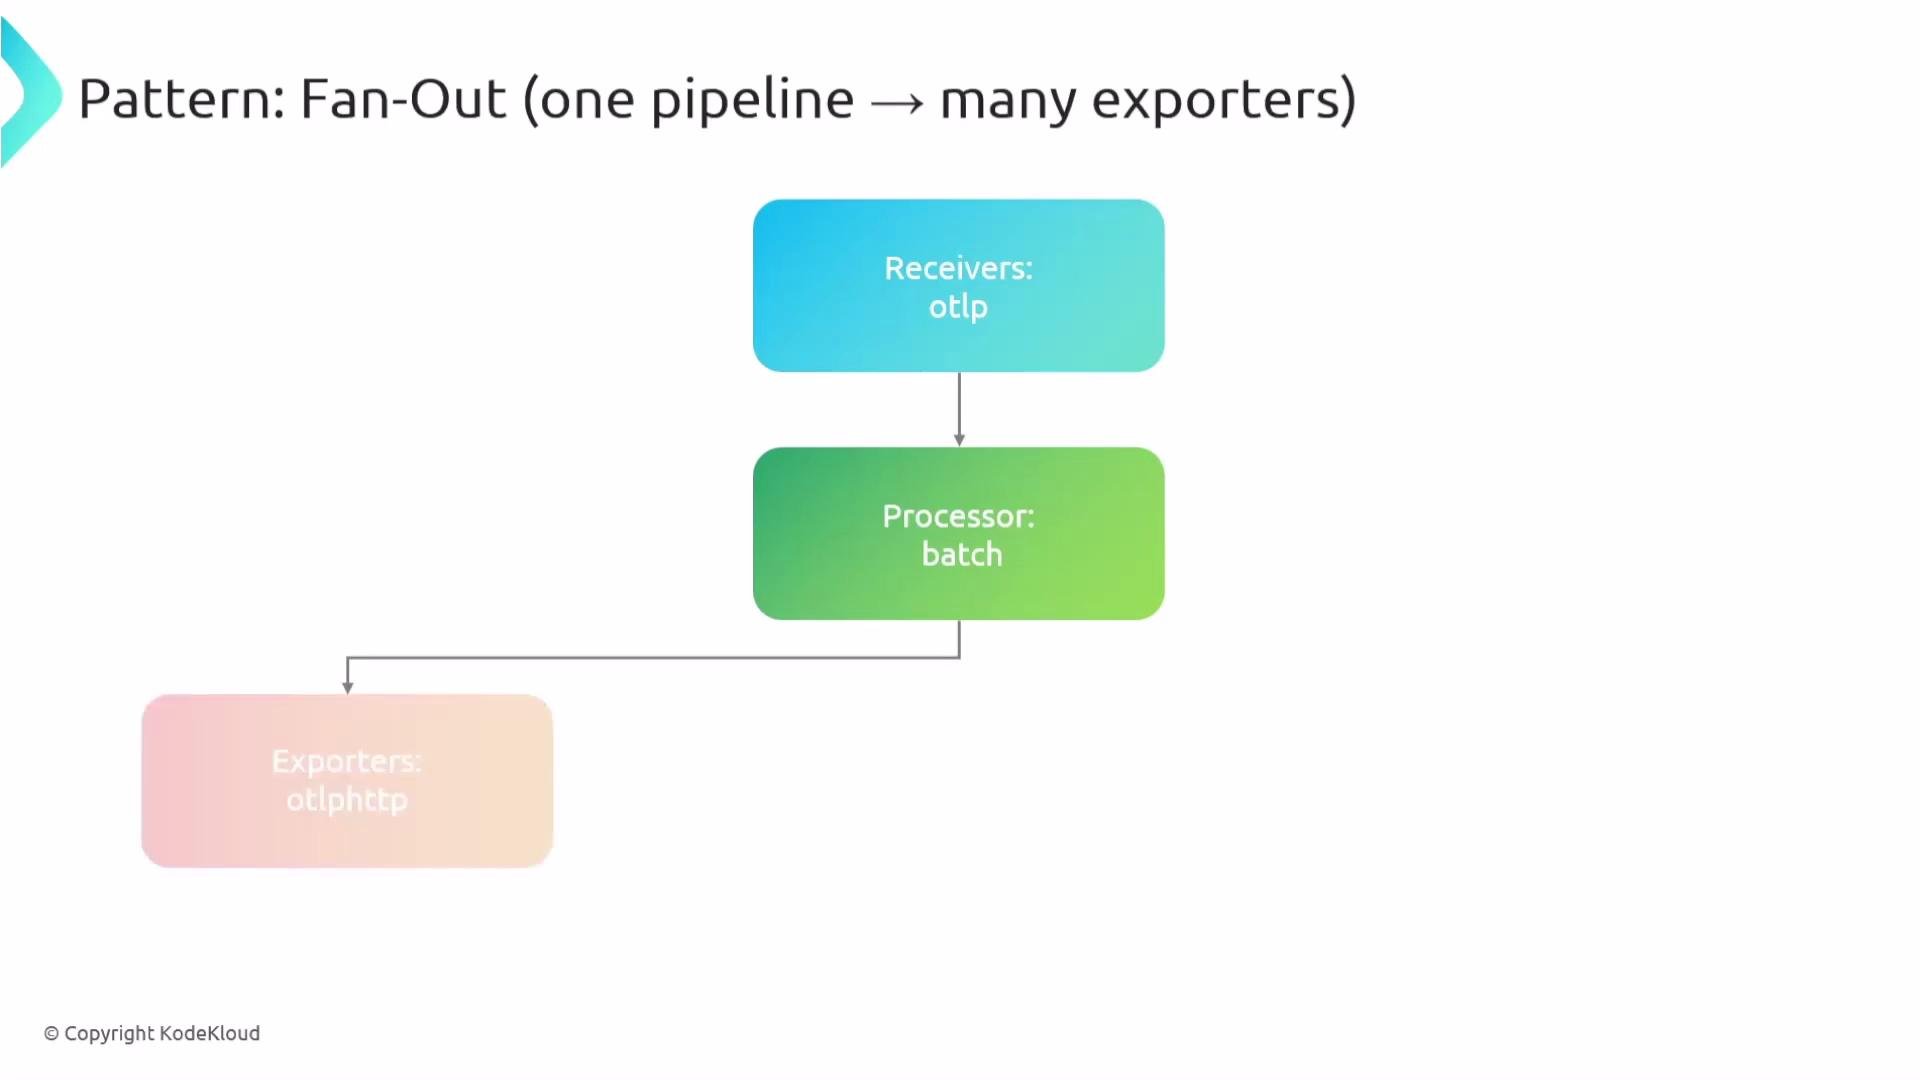 Example — fan-out to multiple backends:
```yaml theme={null}
service:
pipelines:
logs:
receivers: [otlp]
processors: [batch]
exporters: [otlphttp, kafka/audit, prometheusremotewrite/edge] # fan-out
```
Fan-in: multiple receivers into a single pipeline
Example — fan-out to multiple backends:
```yaml theme={null}
service:
pipelines:
logs:
receivers: [otlp]
processors: [batch]
exporters: [otlphttp, kafka/audit, prometheusremotewrite/edge] # fan-out
```
Fan-in: multiple receivers into a single pipeline
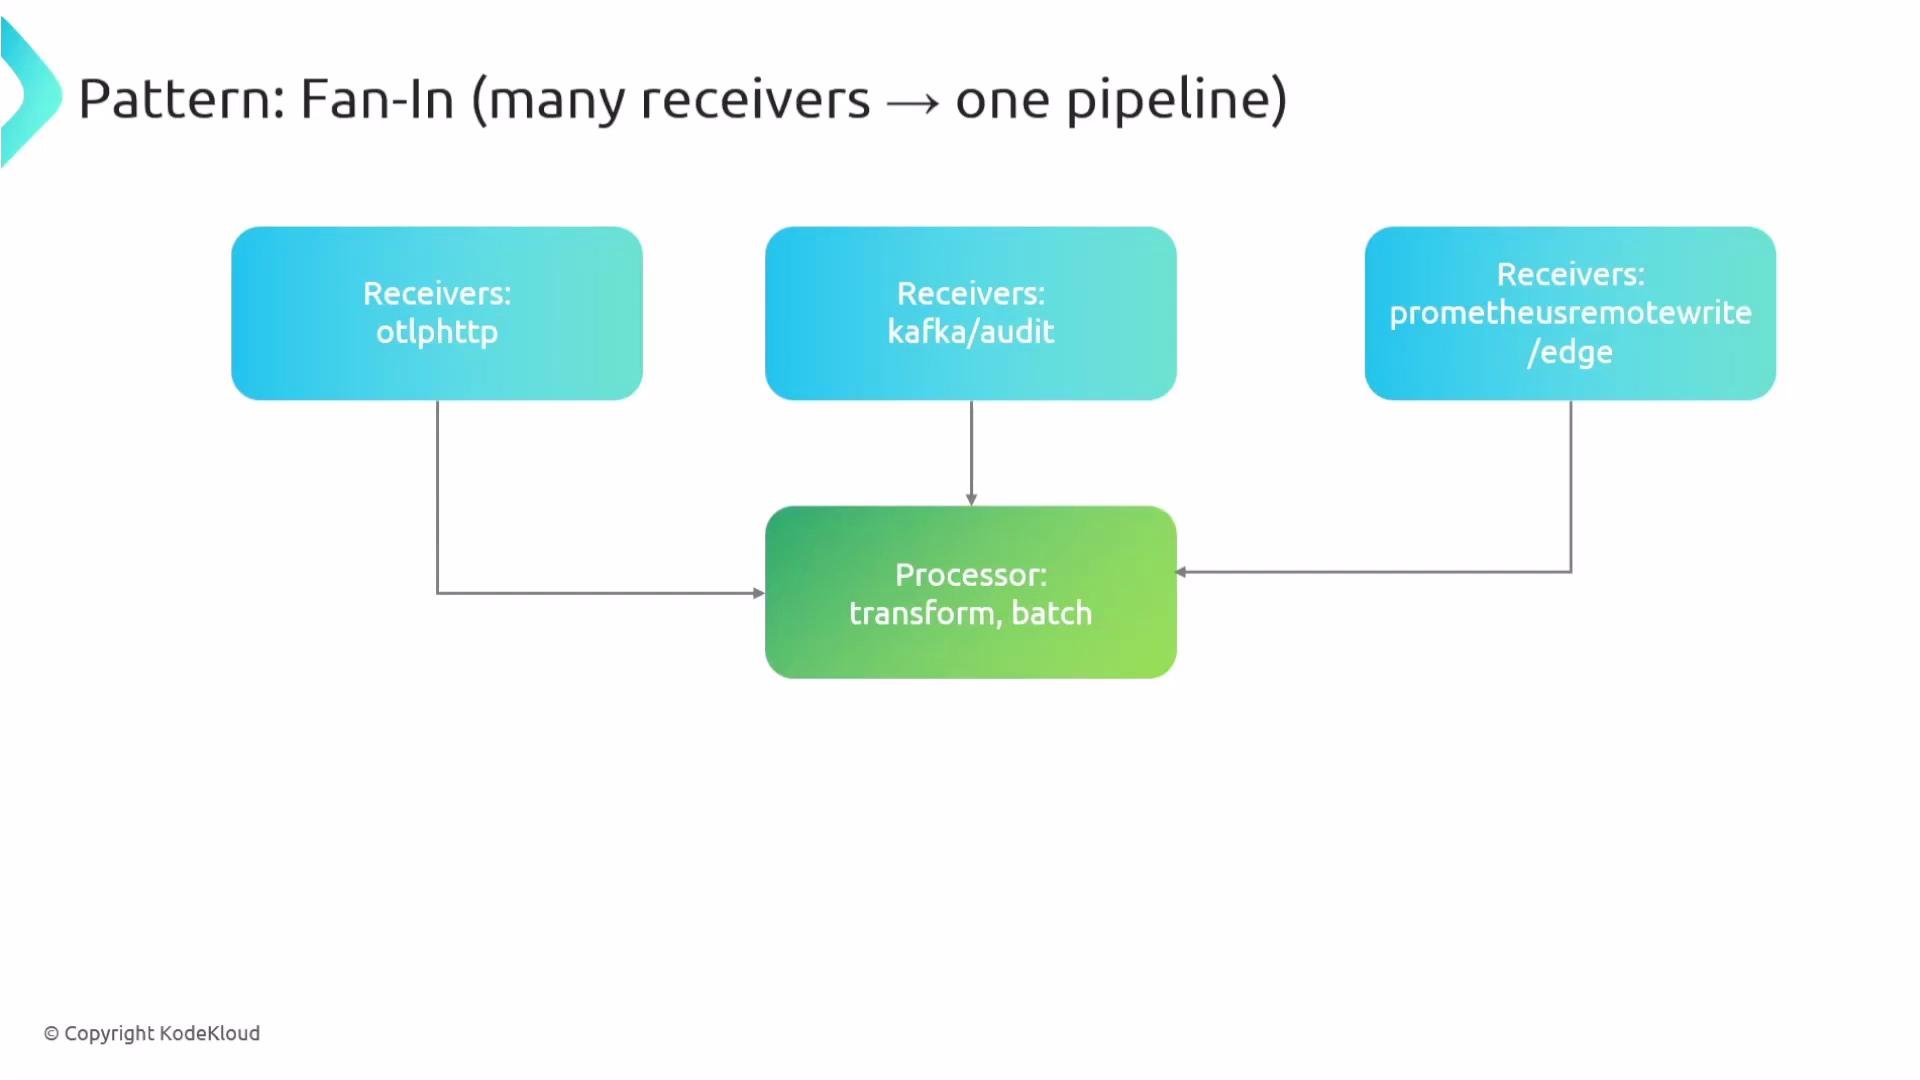 Example — fan-in to normalize and forward metrics:
```yaml theme={null}
service:
pipelines:
metrics:
receivers: [otlp, prometheus, hostmetrics]
processors: [transform, batch]
exporters: [prometheusremotewrite/edge]
```
Multi-pipeline scenarios (prod/dev split)
Example — fan-in to normalize and forward metrics:
```yaml theme={null}
service:
pipelines:
metrics:
receivers: [otlp, prometheus, hostmetrics]
processors: [transform, batch]
exporters: [prometheusremotewrite/edge]
```
Multi-pipeline scenarios (prod/dev split)
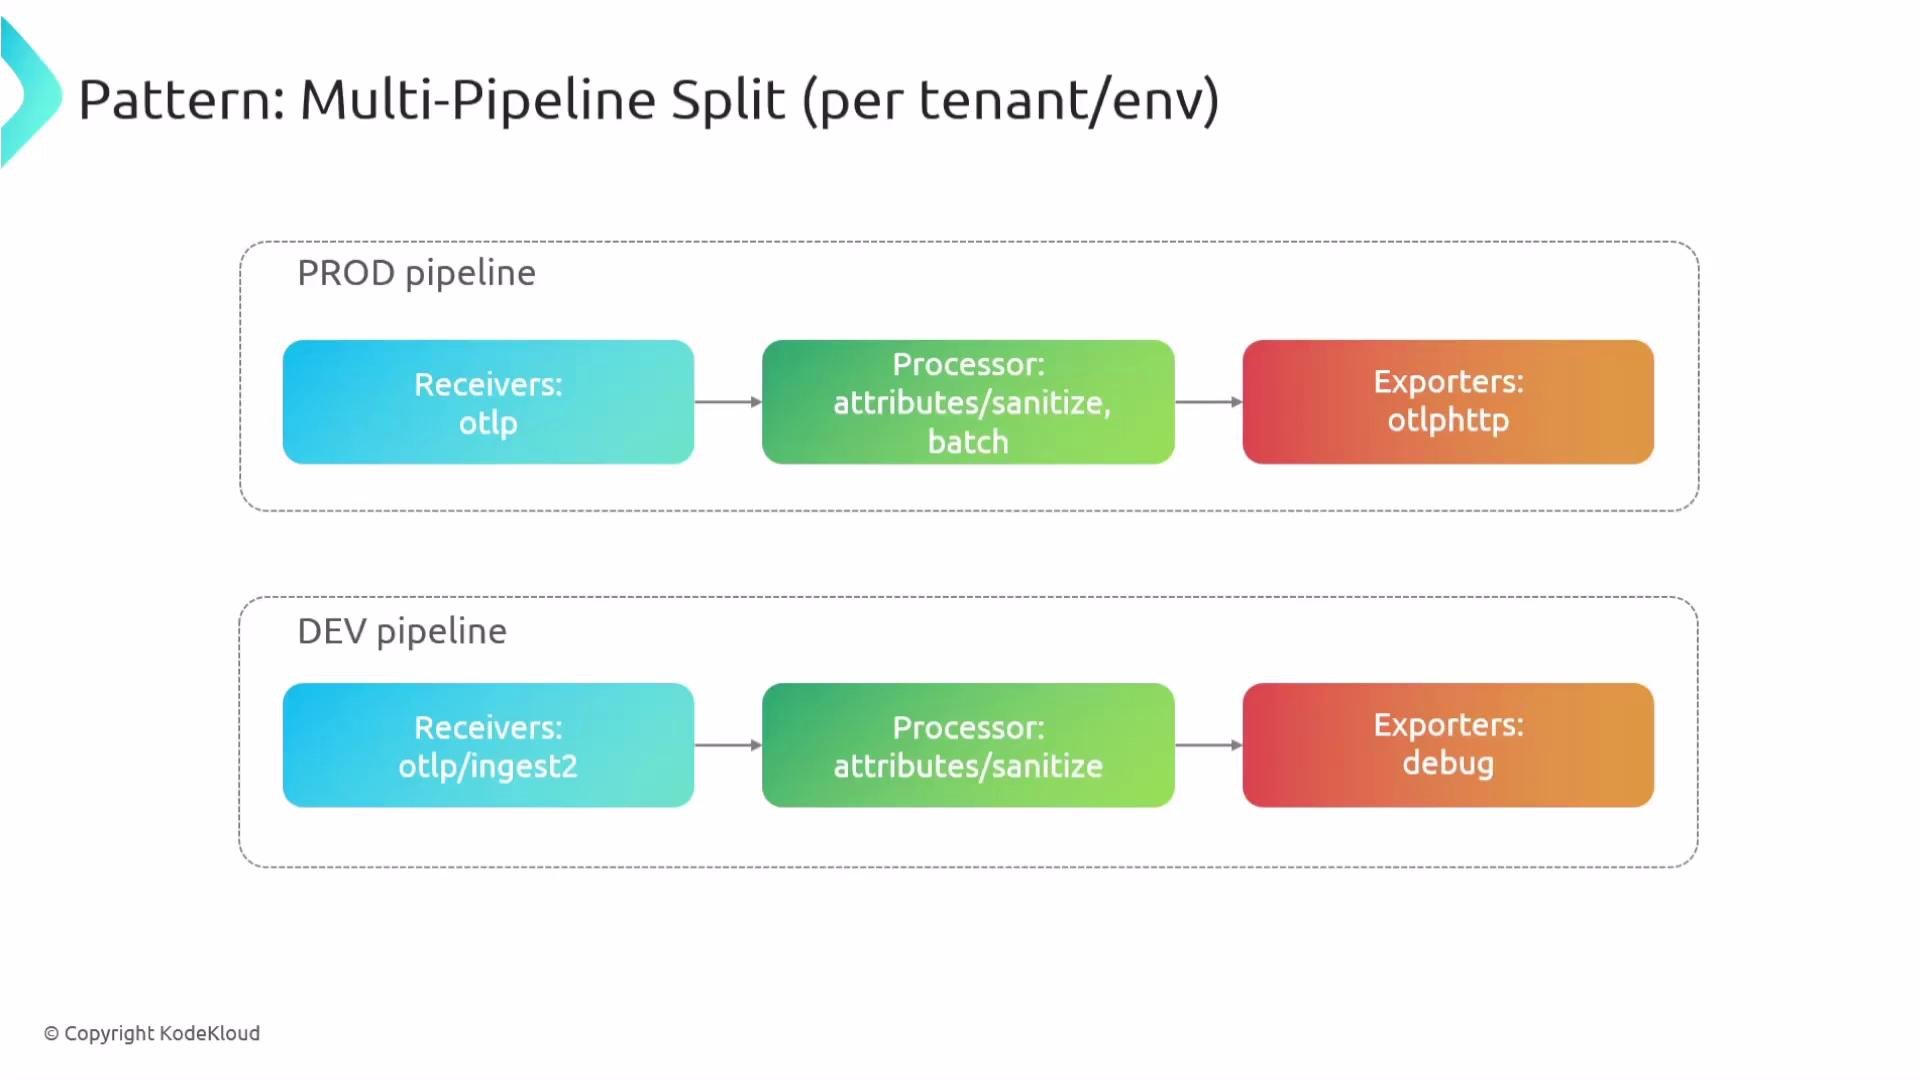 You can run multiple pipelines for the same signal (e.g., `traces/prod` and `traces/dev`) with different receivers/processors/exporters:
```yaml theme={null}
service:
pipelines:
traces/prod:
receivers: [otlp]
processors: [attributes/sanitize, batch]
exporters: [otlphttp]
traces/dev:
receivers: [otlp/ingest2]
processors: [attributes/sanitize]
exporters: [debug] # local inspection
```
Blue/green pipeline pattern — safe testing of new processors
You can run multiple pipelines for the same signal (e.g., `traces/prod` and `traces/dev`) with different receivers/processors/exporters:
```yaml theme={null}
service:
pipelines:
traces/prod:
receivers: [otlp]
processors: [attributes/sanitize, batch]
exporters: [otlphttp]
traces/dev:
receivers: [otlp/ingest2]
processors: [attributes/sanitize]
exporters: [debug] # local inspection
```
Blue/green pipeline pattern — safe testing of new processors
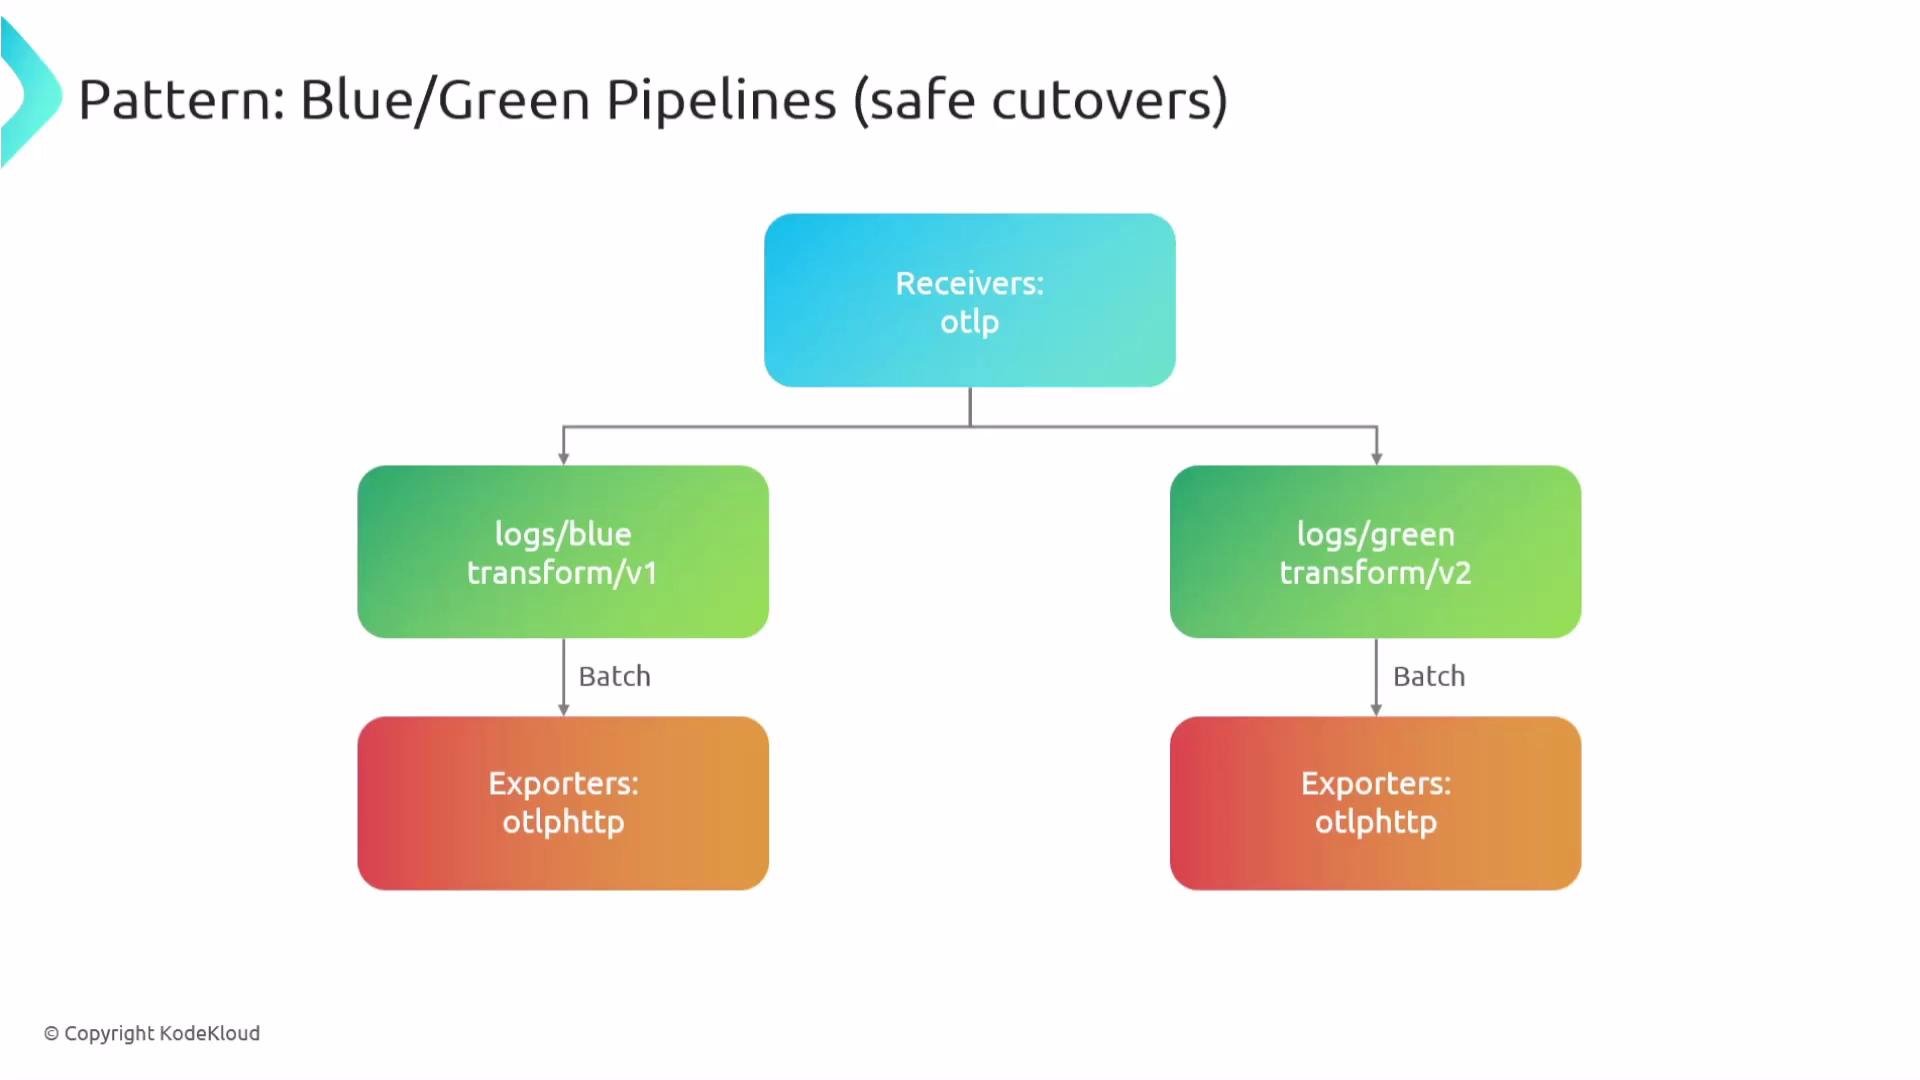 Blue/green lets you test a new transform chain in parallel with the current pipeline:
```yaml theme={null}
service:
pipelines:
logs/blue:
receivers: [otlp]
processors: [transform/v1, batch]
exporters: [otlphttp]
logs/green:
receivers: [otlp]
processors: [transform/v2, batch]
exporters: [otlphttp]
# Flip upstream routing or switch receiver instances when ready
```
If both blue and green pipelines are active and receive the same input, you will produce duplicate telemetry at the destination(s). Use routing rules or switch receivers to avoid duplication during cutover.
Common failure modes and quick fixes
Blue/green lets you test a new transform chain in parallel with the current pipeline:
```yaml theme={null}
service:
pipelines:
logs/blue:
receivers: [otlp]
processors: [transform/v1, batch]
exporters: [otlphttp]
logs/green:
receivers: [otlp]
processors: [transform/v2, batch]
exporters: [otlphttp]
# Flip upstream routing or switch receiver instances when ready
```
If both blue and green pipelines are active and receive the same input, you will produce duplicate telemetry at the destination(s). Use routing rules or switch receivers to avoid duplication during cutover.
Common failure modes and quick fixes
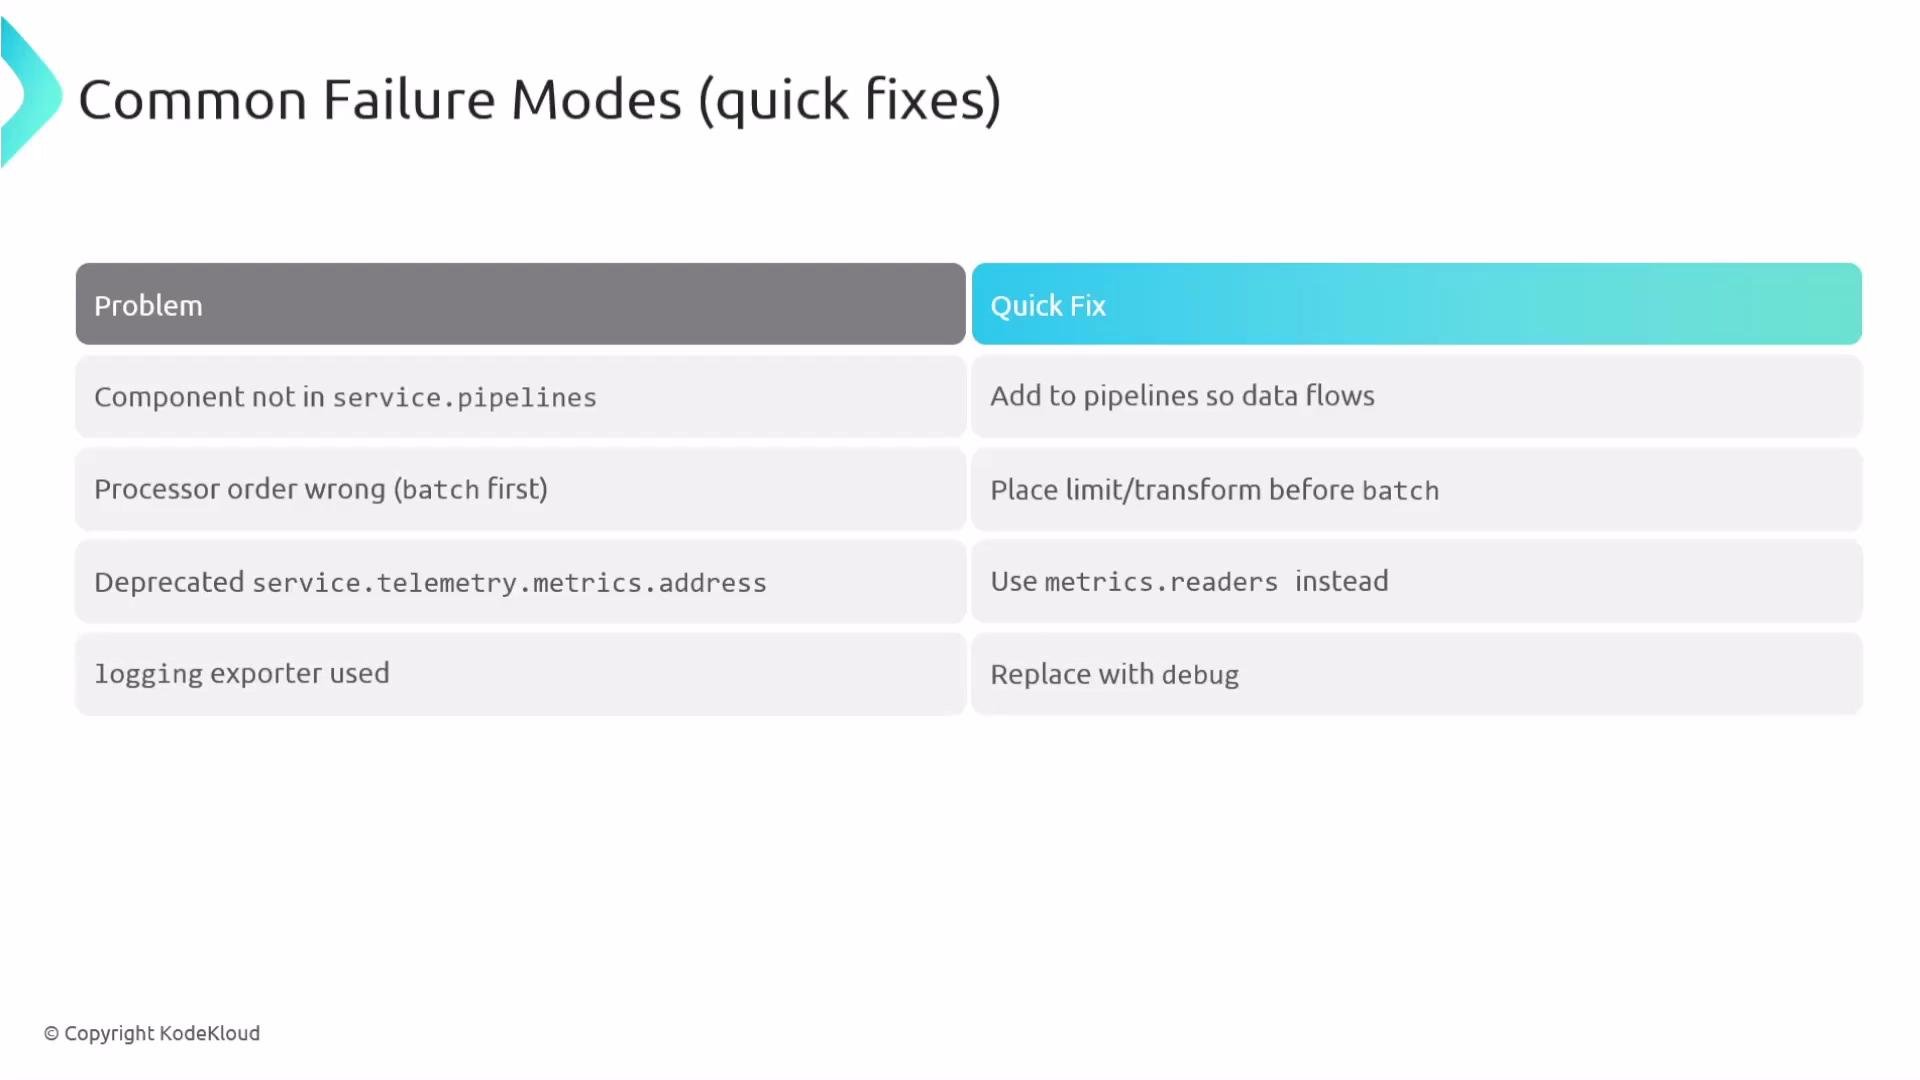 Table: common problems and remedies
| Problem | Quick fix |
| ------------------------------------ | ----------------------------------------------------------------------------------------------------------- |
| Component not active | Ensure the instance name is referenced in `service.pipelines`. |
| Processor order incorrect | Run normalizers/limiters before `batch` (e.g., `memory_limiter` before `batch`). |
| Deprecated metrics address in config | Replace with `telemetry.metrics.readers`. |
| Debug/logging exporters in prod | Remove or replace with production exporters; keep `debug` for troubleshooting only. |
| Port conflicts | Assign unique host/port values for Prometheus receivers or internal metrics endpoints. |
| Configuration errors | Validate config with `otelcol --config config.yaml --validate` (or your distribution's validation command). |
Extensions — runtime features (not part of pipelines)
Extensions are long-running features that support the Collector runtime but do not process telemetry within pipelines. Common use cases include Kubernetes health endpoints, runtime profiling, and durable local storage for queues.
Table: common problems and remedies
| Problem | Quick fix |
| ------------------------------------ | ----------------------------------------------------------------------------------------------------------- |
| Component not active | Ensure the instance name is referenced in `service.pipelines`. |
| Processor order incorrect | Run normalizers/limiters before `batch` (e.g., `memory_limiter` before `batch`). |
| Deprecated metrics address in config | Replace with `telemetry.metrics.readers`. |
| Debug/logging exporters in prod | Remove or replace with production exporters; keep `debug` for troubleshooting only. |
| Port conflicts | Assign unique host/port values for Prometheus receivers or internal metrics endpoints. |
| Configuration errors | Validate config with `otelcol --config config.yaml --validate` (or your distribution's validation command). |
Extensions — runtime features (not part of pipelines)
Extensions are long-running features that support the Collector runtime but do not process telemetry within pipelines. Common use cases include Kubernetes health endpoints, runtime profiling, and durable local storage for queues.
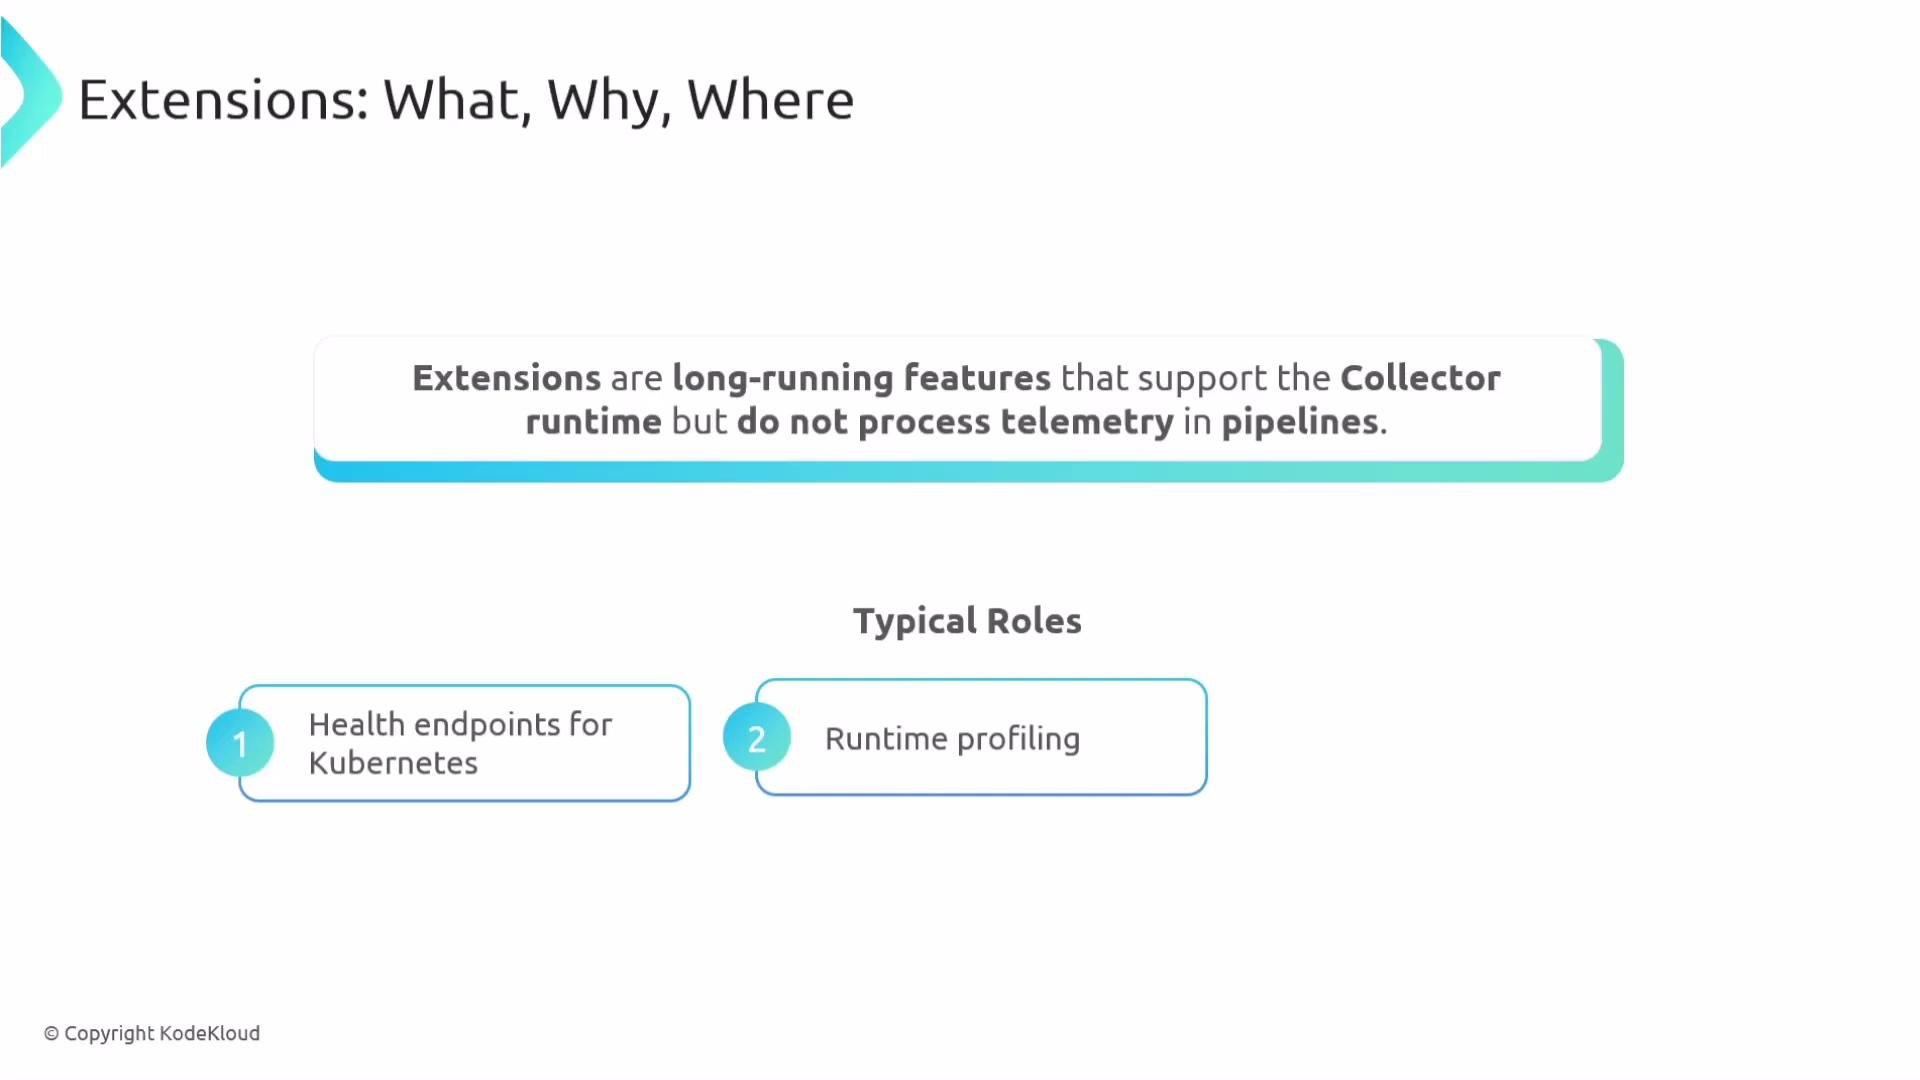 Example: enabling extensions and referencing them in `service.extensions`:
```yaml theme={null}
extensions:
health_check:
endpoint: 0.0.0.0:13133 # liveness/readiness probe
pprof:
endpoint: 0.0.0.0:1777 # CPU/heap profiling
file_storage:
directory: /var/lib/otelcol/file_storage
service:
extensions: [health_check, pprof, file_storage]
pipelines:
traces:
receivers: [otlp]
processors: [batch]
exporters: [otlphttp]
```
Durable sending queues with file storage
* If an exporter uses retries and a sending queue, bind the queue storage to a `file_storage` extension so telemetry is persisted locally while the backend is unavailable:
```yaml theme={null}
extensions:
file_storage:
directory: /var/lib/otelcol/file_storage
exporters:
otlphttp:
endpoint: https://vendorname.example.com:4318
retry_on_failure:
enabled: true
max_elapsed_time: 10m
sending_queue:
queue_size: 5000
storage: file_storage # ties the exporter queue to the file_storage extension
service:
extensions: [file_storage]
pipelines:
traces:
receivers: [otlp]
processors: [batch]
exporters: [otlphttp]
```
Health checks
* When `health_check` is enabled and added to `service.extensions`, the Collector exposes a health endpoint (useful for Kubernetes liveness/readiness probes) on the configured port (example: 13133).
Recap — actionable rules to remember
Example: enabling extensions and referencing them in `service.extensions`:
```yaml theme={null}
extensions:
health_check:
endpoint: 0.0.0.0:13133 # liveness/readiness probe
pprof:
endpoint: 0.0.0.0:1777 # CPU/heap profiling
file_storage:
directory: /var/lib/otelcol/file_storage
service:
extensions: [health_check, pprof, file_storage]
pipelines:
traces:
receivers: [otlp]
processors: [batch]
exporters: [otlphttp]
```
Durable sending queues with file storage
* If an exporter uses retries and a sending queue, bind the queue storage to a `file_storage` extension so telemetry is persisted locally while the backend is unavailable:
```yaml theme={null}
extensions:
file_storage:
directory: /var/lib/otelcol/file_storage
exporters:
otlphttp:
endpoint: https://vendorname.example.com:4318
retry_on_failure:
enabled: true
max_elapsed_time: 10m
sending_queue:
queue_size: 5000
storage: file_storage # ties the exporter queue to the file_storage extension
service:
extensions: [file_storage]
pipelines:
traces:
receivers: [otlp]
processors: [batch]
exporters: [otlphttp]
```
Health checks
* When `health_check` is enabled and added to `service.extensions`, the Collector exposes a health endpoint (useful for Kubernetes liveness/readiness probes) on the configured port (example: 13133).
Recap — actionable rules to remember
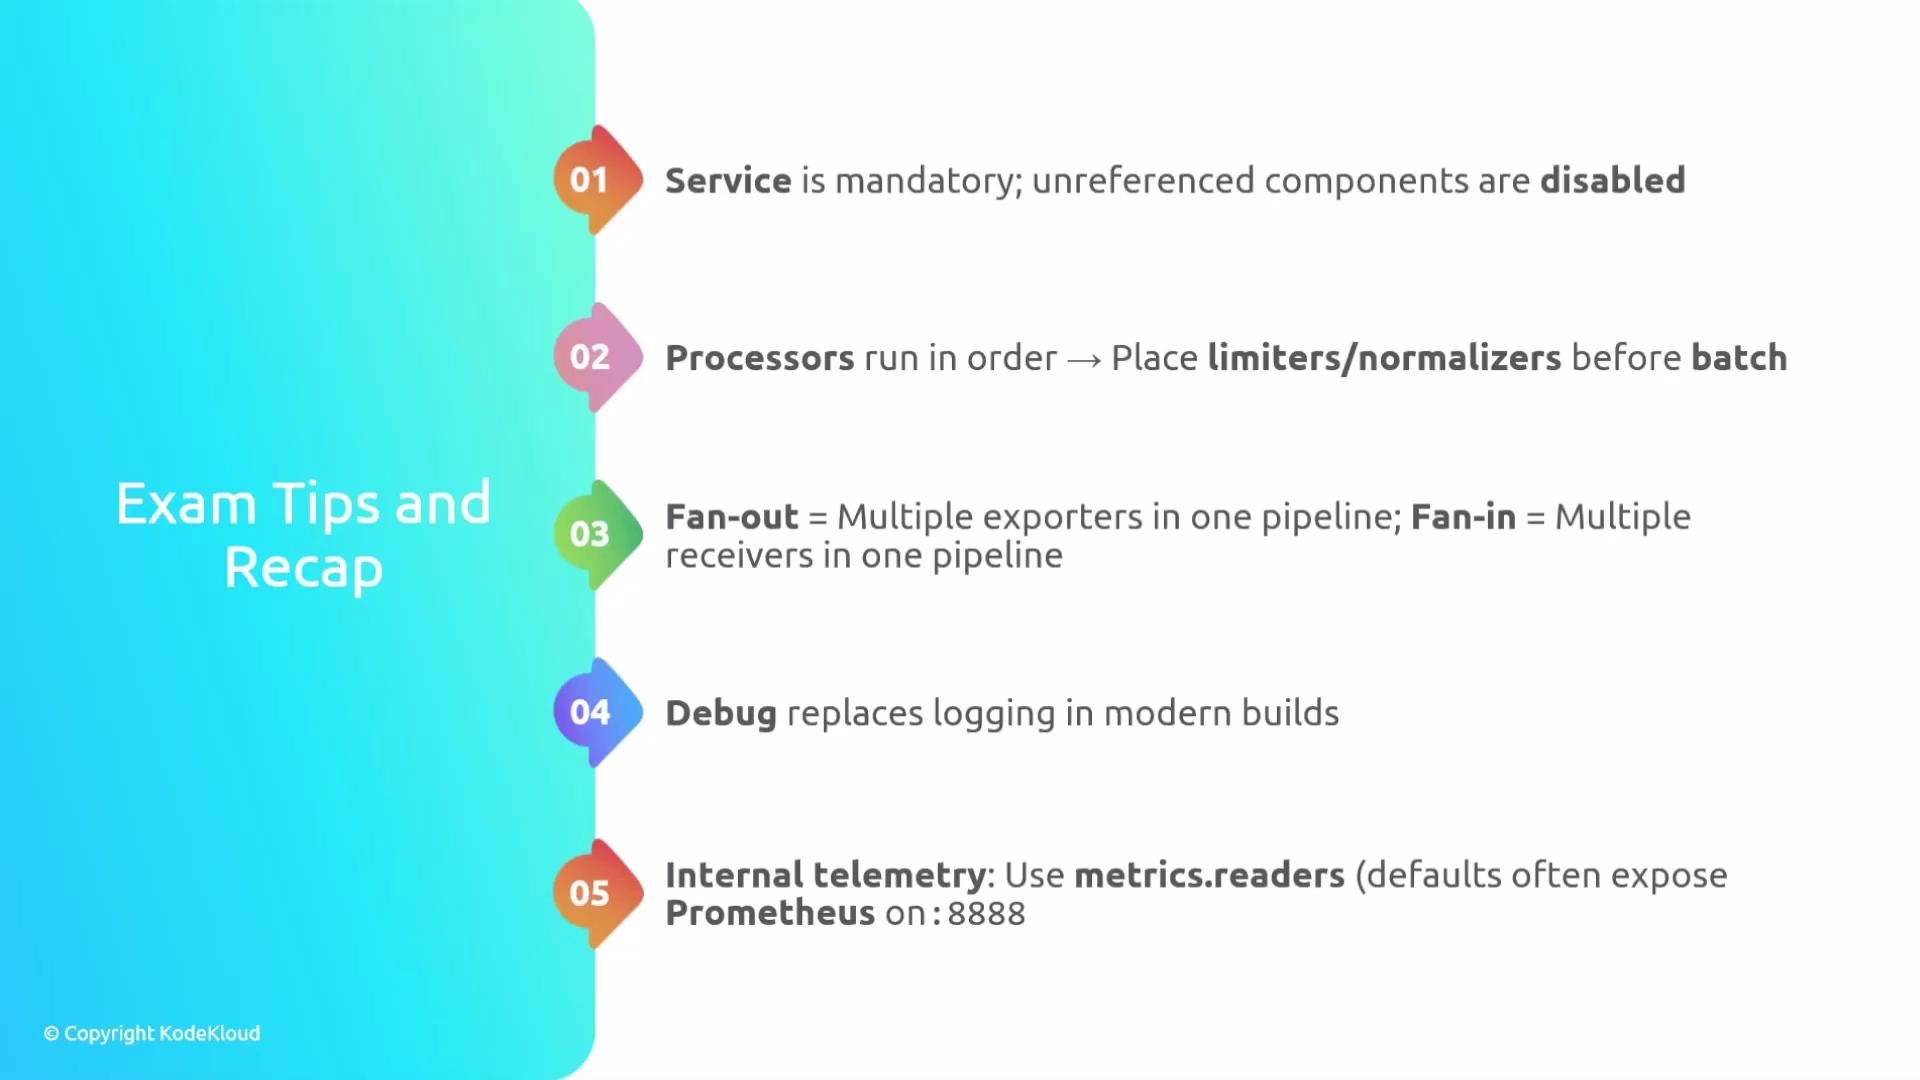 * The `service` section is mandatory: unreferenced components are ignored.
* Processor execution order is left-to-right — put limiters/normalizers before `batch`.
* Fan-out: a pipeline can export the same data to multiple destinations.
* Fan-in: multiple receivers can feed a single normalized pipeline.
* Use `debug` or `logging` exporters only for troubleshooting; avoid in production.
* Use `telemetry.metrics.readers` to expose internal metrics (Prometheus pull or periodic pushes).
* Validate configuration before starting the Collector and use internal metrics/debug exporter to analyze behavior:
* `otelcol --config config.yaml --validate`
Links and references
* OpenTelemetry Collector documentation: [https://opentelemetry.io/docs/collector/](https://opentelemetry.io/docs/collector/)
* Prometheus: [https://prometheus.io/](https://prometheus.io/)
* Kubernetes probes and readiness/liveness: [https://kubernetes.io/docs/tasks/configure-pod-container/configure-liveness-readiness-startup-probes/](https://kubernetes.io/docs/tasks/configure-pod-container/configure-liveness-readiness-startup-probes/)
That's it for the Collector's service section and pipelines — use these patterns to design robust collection flows, avoid duplicates during cutovers, and ensure internal telemetry is observable.
* The `service` section is mandatory: unreferenced components are ignored.
* Processor execution order is left-to-right — put limiters/normalizers before `batch`.
* Fan-out: a pipeline can export the same data to multiple destinations.
* Fan-in: multiple receivers can feed a single normalized pipeline.
* Use `debug` or `logging` exporters only for troubleshooting; avoid in production.
* Use `telemetry.metrics.readers` to expose internal metrics (Prometheus pull or periodic pushes).
* Validate configuration before starting the Collector and use internal metrics/debug exporter to analyze behavior:
* `otelcol --config config.yaml --validate`
Links and references
* OpenTelemetry Collector documentation: [https://opentelemetry.io/docs/collector/](https://opentelemetry.io/docs/collector/)
* Prometheus: [https://prometheus.io/](https://prometheus.io/)
* Kubernetes probes and readiness/liveness: [https://kubernetes.io/docs/tasks/configure-pod-container/configure-liveness-readiness-startup-probes/](https://kubernetes.io/docs/tasks/configure-pod-container/configure-liveness-readiness-startup-probes/)
That's it for the Collector's service section and pipelines — use these patterns to design robust collection flows, avoid duplicates during cutovers, and ensure internal telemetry is observable.