> ## Documentation Index
> Fetch the complete documentation index at: https://notes.kodekloud.com/llms.txt
> Use this file to discover all available pages before exploring further.
# Understanding configyaml in OpenTelemetry Collector
> Guide to OpenTelemetry Collector config.yaml explaining component structure, wiring receivers processors exporters into pipelines, connectors, multi-file splitting, and environment variable parameterization for production deployments.
This guide explains how the OpenTelemetry Collector parses and uses the `config.yaml` file. You'll learn the configuration structure, how to wire receivers/processors/exporters into pipelines, how connectors enable cross-pipeline flows, and how to split and parameterize configuration for production use.
The Collector configuration is organized by component type. The primary groups are:
| Component | Purpose | Example |
| ---------- | ------------------------------------------------------------ | ----------------------------------------------- |
| receivers | Ingest telemetry (traces, metrics, logs) | `otlp` receiving gRPC on `0.0.0.0:4317` |
| processors | Transform, filter, or batch data inside pipelines (optional) | `batch`, `attributes` |
| exporters | Send telemetry to backends | `otlp`, `prometheus`, `debug` |
| connectors | Bridge pipelines (acts as exporter and receiver) | `count` connector producing metrics from traces |
| extensions | Run outside pipelines (health checks, zPages, auth) | `health_check`, `zpages` |
| service | Declares enabled extensions and `pipelines` wiring | `service.pipelines.traces` |
High-level conceptual layout:
```yaml theme={null}
# config.yaml (conceptual)
receivers: {…}
processors: {…}
exporters: {…}
connectors: {…}
service:
extensions: [...]
pipelines:
traces|metrics|logs:
receivers: [...]
processors: [...]
exporters: [...]
```
Minimal required components for a running pipeline are a receiver and an exporter. If `service.pipelines` is present, each pipeline must reference the relevant receivers and exporters.
## Minimal valid configuration
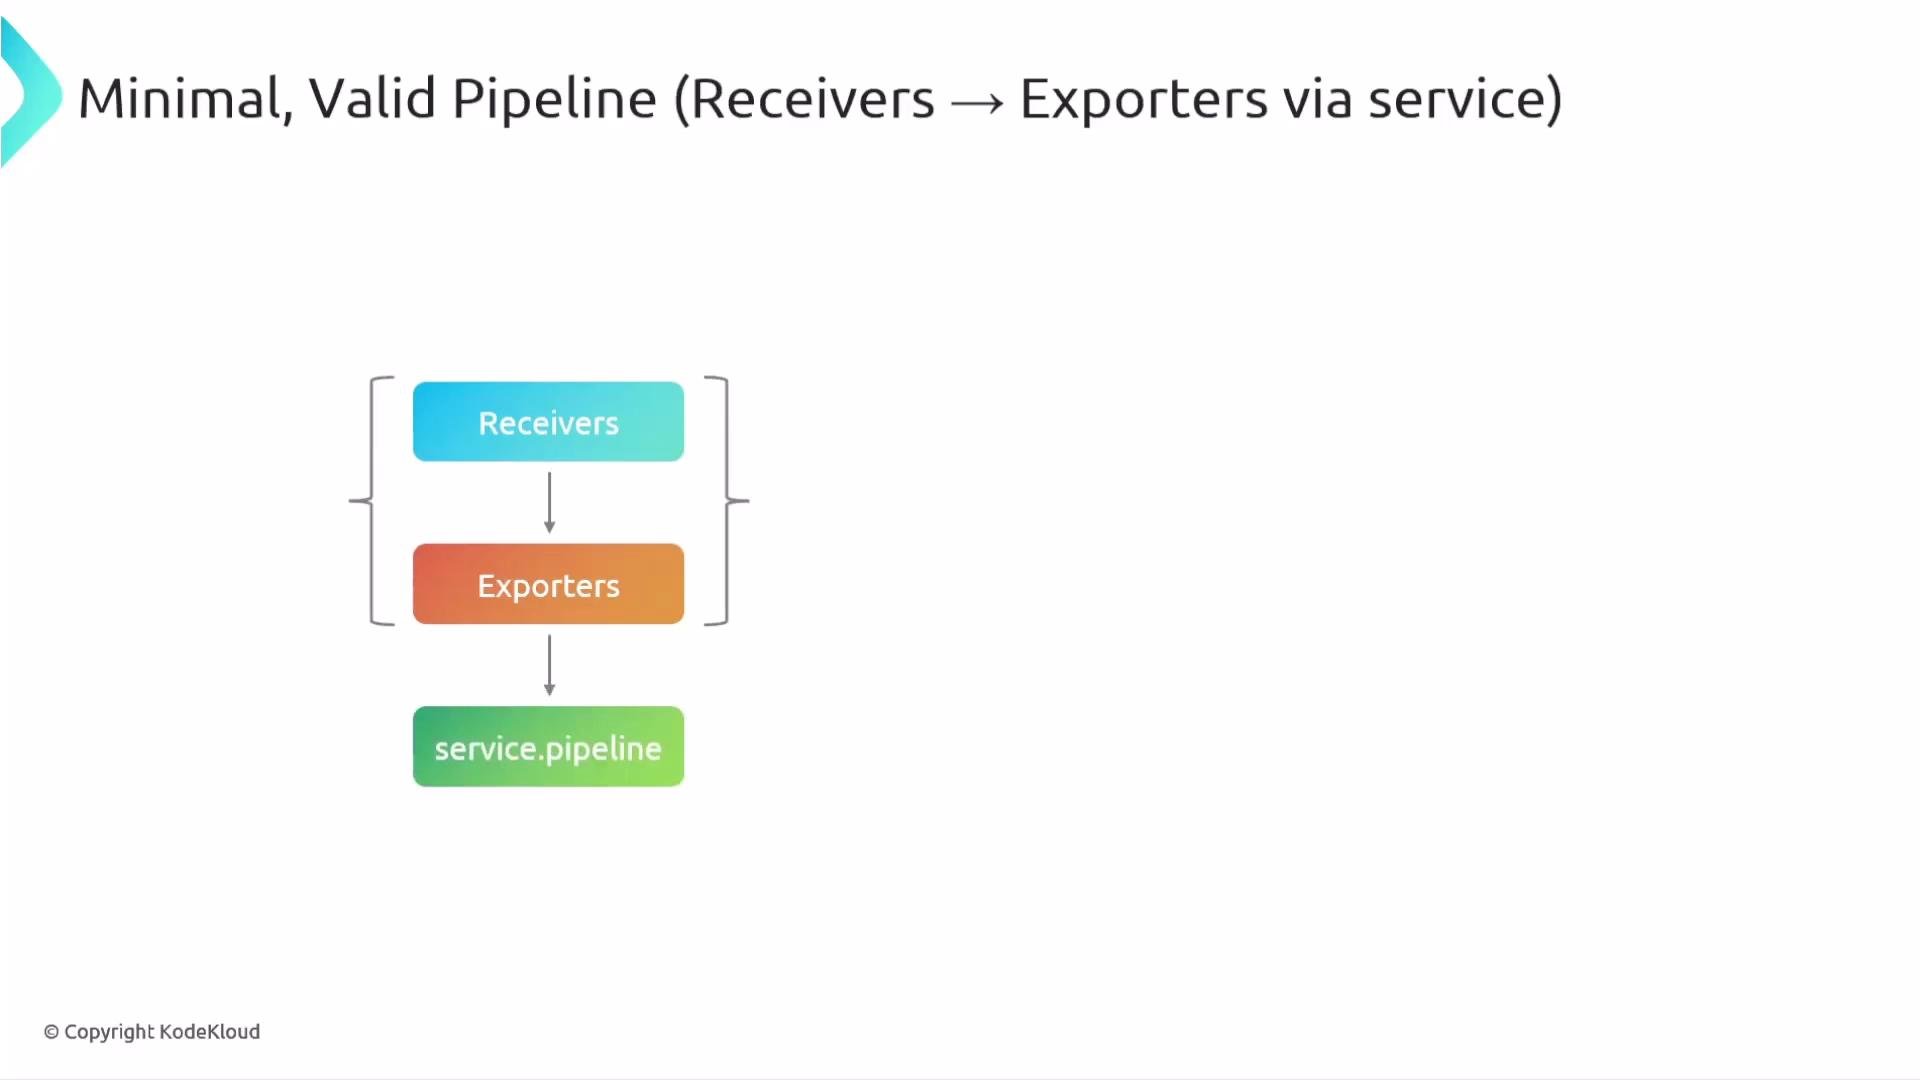
The smallest working Collector config needs a receiver to ingest data and an exporter to send it out. The following diagram shows a minimal pipeline: receiver → service.pipeline → exporter.
 Example: a simple OTLP gRPC receiver on port 4317 and a `debug` exporter that prints incoming spans to the console.
```yaml theme={null}
receivers:
otlp:
protocols:
grpc:
endpoint: 0.0.0.0:4317
exporters:
debug: {}
service:
pipelines:
traces:
receivers: [otlp]
processors: []
exporters: [debug]
```
This configuration omits processors; the `debug` exporter is useful for testing because it logs the telemetry it receives.
## Adding processors and extensions
Processors sit in pipelines to modify, filter, or batch telemetry. Extensions run outside pipelines and provide auxiliary features such as health checks and debugging pages.
Example adding a `batch` processor and two extensions (`health_check`, `zpages`):
```yaml theme={null}
processors:
batch: {}
extensions:
health_check: {}
zpages: {}
service:
extensions: [health_check, zpages]
pipelines:
traces:
receivers: [otlp]
processors: [batch]
exporters: [debug]
```
The `batch` processor accumulates telemetry to improve throughput and reduce exporter load.
## Multiple instances and pipelines
You can declare multiple instances of a component (different names) and multiple pipelines — even multiple pipelines for the same signal type. This enables routing telemetry to different backends or applying distinct processing.
Example: two OTLP receivers on different ports, each routed to a different trace pipeline and exporter.
```yaml theme={null}
receivers:
otlp:
protocols:
grpc: { endpoint: 0.0.0.0:4317 }
otlp/ingest2:
protocols:
grpc: { endpoint: 0.0.0.0:55690 }
exporters:
otlp:
endpoint: backend-1:4317
otlp/alt:
endpoint: backend-2:4317
processors:
batch: {}
service:
pipelines:
traces:
receivers: [otlp]
processors: [batch]
exporters: [otlp]
traces/2:
receivers: [otlp/ingest2]
processors: [batch]
exporters: [otlp/alt]
```
Notes:
* `otlp` and `otlp/ingest2` are distinct receiver instances.
* `traces` and `traces/2` are independent trace pipelines.
* Reusing a processor (like `batch`) across pipelines is common.
## Connectors: cross-pipeline flows
Connectors act as an exporter on one side and a receiver on the other, enabling telemetry conversion or flow between pipelines without an external process. This is useful for generating metrics from traces, for example.
Example: count span events from production spans and expose them as a metric via a connector named `count`.
```yaml theme={null}
connectors:
count:
spanevents:
my.prod.event.count:
description: Count of span events from prod
conditions:
- 'attributes["env"] == "prod"'
service:
pipelines:
traces:
receivers: [otlp]
processors: []
exporters: [count] # connector acts as an exporter for traces
metrics:
receivers: [count] # connector acts as a receiver for metrics
processors: []
exporters: [debug]
```
How it works:
* The `count` connector inspects spans in the traces pipeline and applies the condition `attributes["env"] == "prod"`.
* When a span matches, it emits a metric named `my.prod.event.count`.
* The metrics pipeline receives that metric via the `count` receiver and exports it (here, to `debug`).
## Splitting configuration across files and parameterizing
The Collector supports including and merging multiple YAML files. Use `${file:...}` to include files and `${env:VAR:-default}` for environment variable substitution. This pattern helps keep sensitive or environment-specific settings separate.
Main `config.yaml` example:
```yaml theme={null}
# config.yaml
receivers:
otlp:
protocols:
grpc: { endpoint: 0.0.0.0:4317 }
exporters: ${file:exporters.yaml}
service:
extensions: []
pipelines:
traces:
receivers: [otlp]
processors: []
exporters: [otlp]
```
Included `exporters.yaml` example:
```yaml theme={null}
# exporters.yaml
otlp:
endpoint: ${env:OTLP_ENDPOINT:-otelcol:4317}
```
At startup, the Collector expands `${file:exporters.yaml}`, substitutes any environment variables, and merges everything into a single runtime configuration.
When splitting files, ensure included paths are correct and the merged configuration produces valid references (names in `service.pipelines` must match declared component names). Test locally before deploying to production.
## Quick reference
* Minimum: receiver + exporter wired in `service.pipelines`.
* Common optional components: `processors` (transform/batch) and `extensions` (health, zPages).
* Use multiple instances and pipelines for flexible routing.
* Connectors bridge pipelines for conversions like traces → metrics.
* Use `${file:...}` and `${env:...}` to modularize and parameterize configuration.
Further reading:
* [OpenTelemetry Collector GitHub repository](https://github.com/open-telemetry/opentelemetry-collector)
* [Collector configuration docs](https://opentelemetry.io/docs/collector/configuration/)
Example: a simple OTLP gRPC receiver on port 4317 and a `debug` exporter that prints incoming spans to the console.
```yaml theme={null}
receivers:
otlp:
protocols:
grpc:
endpoint: 0.0.0.0:4317
exporters:
debug: {}
service:
pipelines:
traces:
receivers: [otlp]
processors: []
exporters: [debug]
```
This configuration omits processors; the `debug` exporter is useful for testing because it logs the telemetry it receives.
## Adding processors and extensions
Processors sit in pipelines to modify, filter, or batch telemetry. Extensions run outside pipelines and provide auxiliary features such as health checks and debugging pages.
Example adding a `batch` processor and two extensions (`health_check`, `zpages`):
```yaml theme={null}
processors:
batch: {}
extensions:
health_check: {}
zpages: {}
service:
extensions: [health_check, zpages]
pipelines:
traces:
receivers: [otlp]
processors: [batch]
exporters: [debug]
```
The `batch` processor accumulates telemetry to improve throughput and reduce exporter load.
## Multiple instances and pipelines
You can declare multiple instances of a component (different names) and multiple pipelines — even multiple pipelines for the same signal type. This enables routing telemetry to different backends or applying distinct processing.
Example: two OTLP receivers on different ports, each routed to a different trace pipeline and exporter.
```yaml theme={null}
receivers:
otlp:
protocols:
grpc: { endpoint: 0.0.0.0:4317 }
otlp/ingest2:
protocols:
grpc: { endpoint: 0.0.0.0:55690 }
exporters:
otlp:
endpoint: backend-1:4317
otlp/alt:
endpoint: backend-2:4317
processors:
batch: {}
service:
pipelines:
traces:
receivers: [otlp]
processors: [batch]
exporters: [otlp]
traces/2:
receivers: [otlp/ingest2]
processors: [batch]
exporters: [otlp/alt]
```
Notes:
* `otlp` and `otlp/ingest2` are distinct receiver instances.
* `traces` and `traces/2` are independent trace pipelines.
* Reusing a processor (like `batch`) across pipelines is common.
## Connectors: cross-pipeline flows
Connectors act as an exporter on one side and a receiver on the other, enabling telemetry conversion or flow between pipelines without an external process. This is useful for generating metrics from traces, for example.
Example: count span events from production spans and expose them as a metric via a connector named `count`.
```yaml theme={null}
connectors:
count:
spanevents:
my.prod.event.count:
description: Count of span events from prod
conditions:
- 'attributes["env"] == "prod"'
service:
pipelines:
traces:
receivers: [otlp]
processors: []
exporters: [count] # connector acts as an exporter for traces
metrics:
receivers: [count] # connector acts as a receiver for metrics
processors: []
exporters: [debug]
```
How it works:
* The `count` connector inspects spans in the traces pipeline and applies the condition `attributes["env"] == "prod"`.
* When a span matches, it emits a metric named `my.prod.event.count`.
* The metrics pipeline receives that metric via the `count` receiver and exports it (here, to `debug`).
## Splitting configuration across files and parameterizing
The Collector supports including and merging multiple YAML files. Use `${file:...}` to include files and `${env:VAR:-default}` for environment variable substitution. This pattern helps keep sensitive or environment-specific settings separate.
Main `config.yaml` example:
```yaml theme={null}
# config.yaml
receivers:
otlp:
protocols:
grpc: { endpoint: 0.0.0.0:4317 }
exporters: ${file:exporters.yaml}
service:
extensions: []
pipelines:
traces:
receivers: [otlp]
processors: []
exporters: [otlp]
```
Included `exporters.yaml` example:
```yaml theme={null}
# exporters.yaml
otlp:
endpoint: ${env:OTLP_ENDPOINT:-otelcol:4317}
```
At startup, the Collector expands `${file:exporters.yaml}`, substitutes any environment variables, and merges everything into a single runtime configuration.
When splitting files, ensure included paths are correct and the merged configuration produces valid references (names in `service.pipelines` must match declared component names). Test locally before deploying to production.
## Quick reference
* Minimum: receiver + exporter wired in `service.pipelines`.
* Common optional components: `processors` (transform/batch) and `extensions` (health, zPages).
* Use multiple instances and pipelines for flexible routing.
* Connectors bridge pipelines for conversions like traces → metrics.
* Use `${file:...}` and `${env:...}` to modularize and parameterize configuration.
Further reading:
* [OpenTelemetry Collector GitHub repository](https://github.com/open-telemetry/opentelemetry-collector)
* [Collector configuration docs](https://opentelemetry.io/docs/collector/configuration/)