> ## Documentation Index
> Fetch the complete documentation index at: https://notes.kodekloud.com/llms.txt
> Use this file to discover all available pages before exploring further.
# Introduction to Observability
> Explains observability in distributed systems, comparing metrics, logs, and traces with a medical diagnosis analogy and showing how to correlate signals for troubleshooting.
Modern distributed applications can fail in many ways. When something goes wrong, observability gives you the signals and context to understand what happened and why. This guide explains observability using clear analogies, concrete examples, and practical comparisons of the core telemetry signals: metrics, logs, and traces.
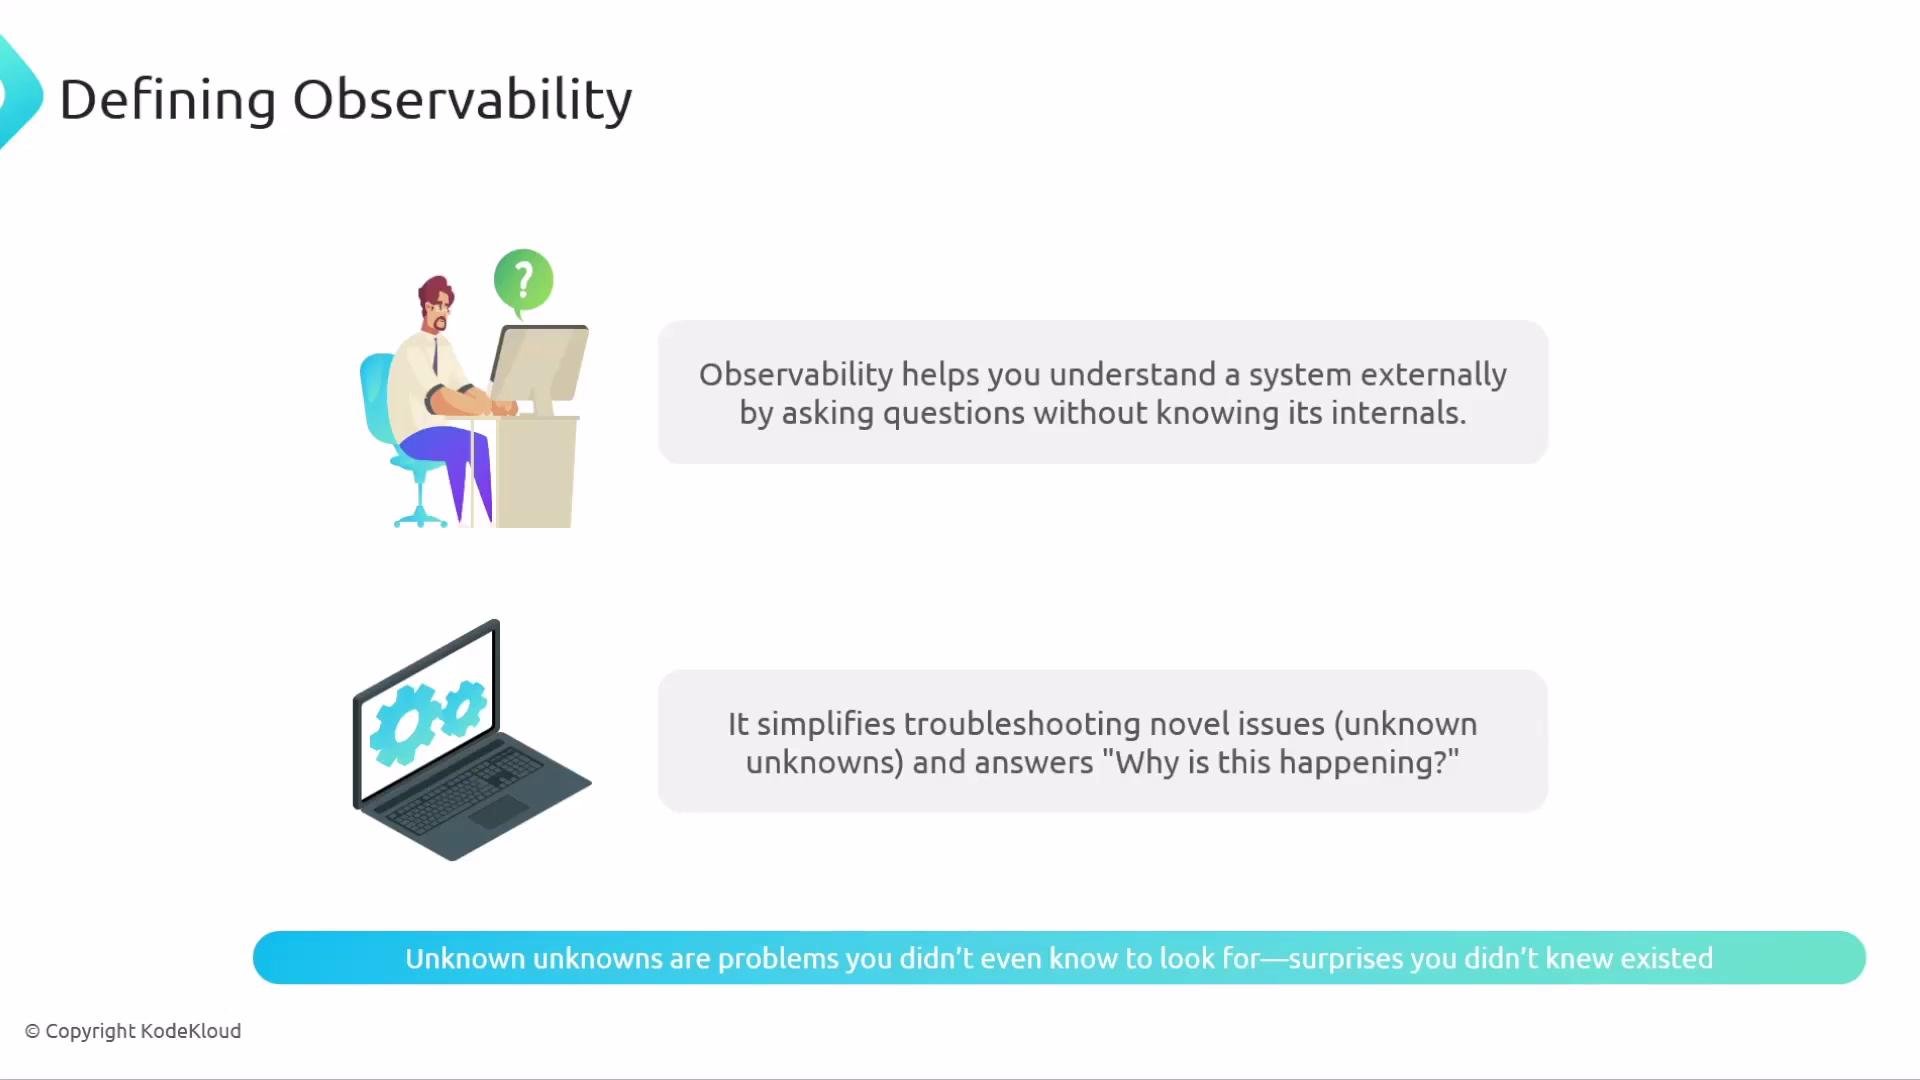
Observability is the ability to understand a system from the outside — to ask questions and get answers without inspecting internal code or processes. Those answers come from dashboards, traces, logs, or other telemetry outputs. The objective is to surface unknown unknowns: issues you weren’t monitoring directly but that affect your system.
 ## Observability through a medical diagnosis analogy
A medical diagnosis is a useful analogy:
* Symptoms (fever, cough, fatigue) tell you *something* is wrong.
* Doctors gather measurements and tests to narrow down the cause.
* Medical history and timelines help build the full picture.
Translate this to telemetry:
* Symptoms → metrics (high-level numeric indicators)
* Timeline and notes → logs (detailed, timestamped events)
* End-to-end diagnostic tests → traces (request-level paths across services)
## Observability through a medical diagnosis analogy
A medical diagnosis is a useful analogy:
* Symptoms (fever, cough, fatigue) tell you *something* is wrong.
* Doctors gather measurements and tests to narrow down the cause.
* Medical history and timelines help build the full picture.
Translate this to telemetry:
* Symptoms → metrics (high-level numeric indicators)
* Timeline and notes → logs (detailed, timestamped events)
* End-to-end diagnostic tests → traces (request-level paths across services)
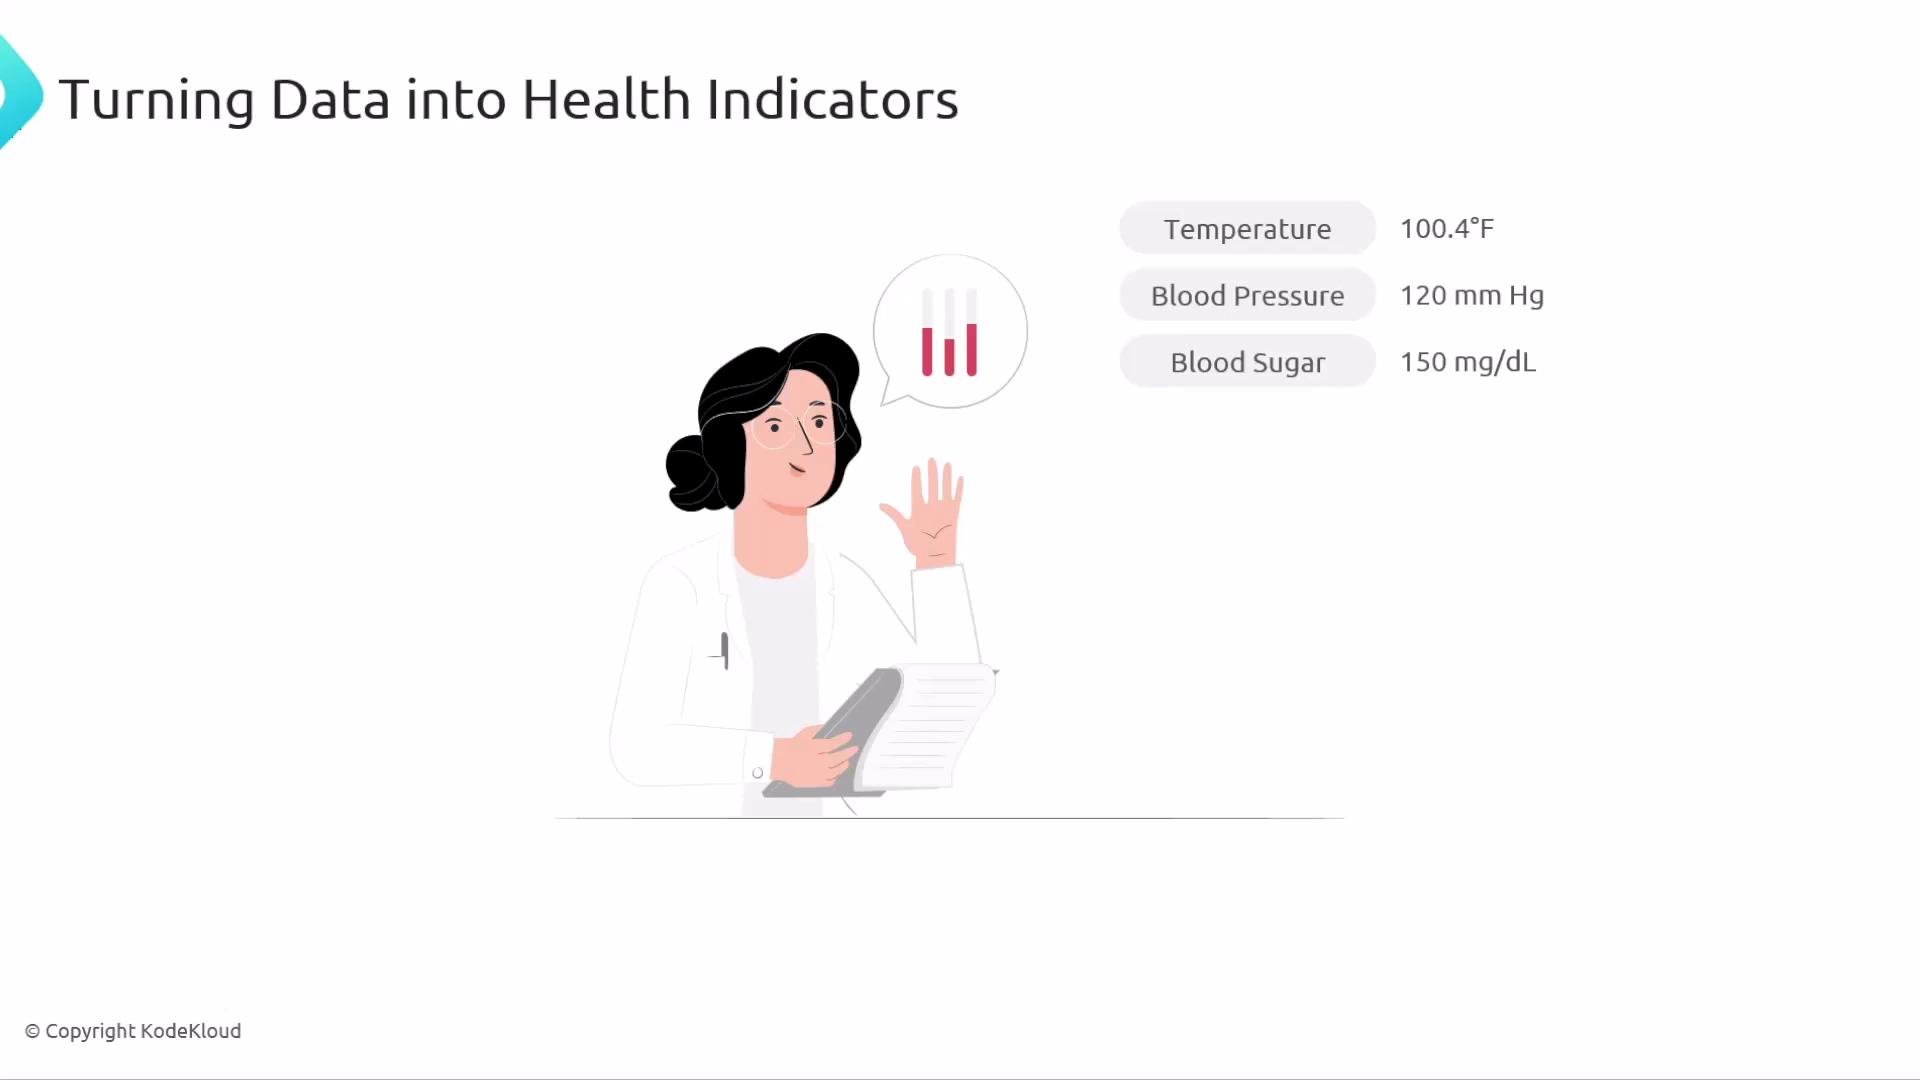
 Doctors don’t rely on observation alone; they order tests (temperature, blood work, scans). In observability terms, these concise, numeric indicators are metrics.
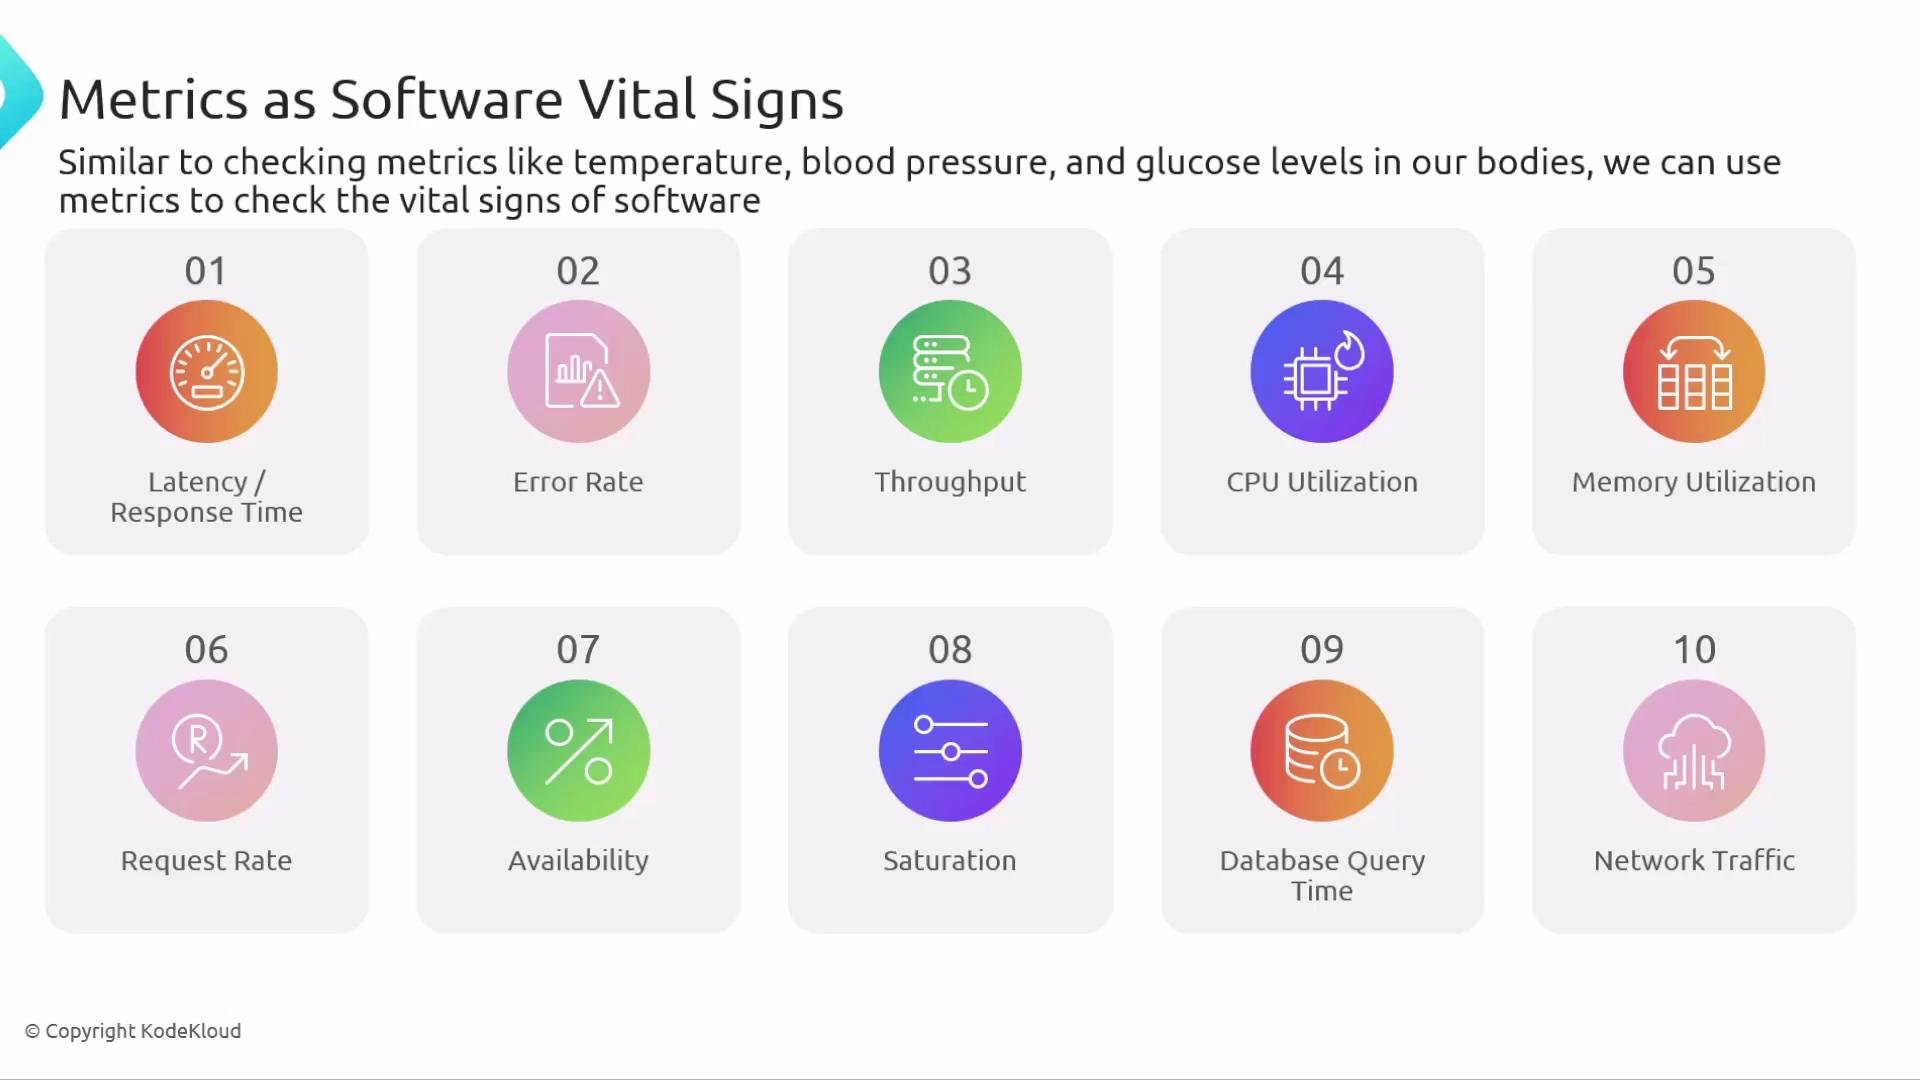
 ### Common software "vital signs" (metrics)
* Latency / response time — indicates slowness.
* Error rate — shows increasing failures.
* Throughput — measures traffic volume.
* CPU / memory usage — show resource pressure.
* Saturation — tells if you’ve hit capacity limits.
* DB query durations and network traffic — additional key signals.
### Common software "vital signs" (metrics)
* Latency / response time — indicates slowness.
* Error rate — shows increasing failures.
* Throughput — measures traffic volume.
* CPU / memory usage — show resource pressure.
* Saturation — tells if you’ve hit capacity limits.
* DB query durations and network traffic — additional key signals.
 For quick reference, here’s a compact comparison of typical metric types and their use-cases:
| Metric type | Use case | Example |
| -------------- | ------------------------------------ | ----------------------- |
| Latency | Detect increased response times | `p95 latency = 450ms` |
| Error rate | Alert on rising failures | `5xx per minute` |
| Throughput | Capacity planning and trend analysis | `requests/sec` |
| Resource usage | Detect saturation | `CPU %`, `memory MB` |
| Saturation | Trigger autoscaling or failover | `connection pool usage` |
## Logs — detailed, timestamped events
Logs are verbose records of individual events. They provide contextual details that metrics alone cannot. Think of a patient’s symptom timeline or diary.
Example patient event timeline:
```text theme={null}
2023-10-27T10:00:00Z INFO: Patient entered Mall.
2023-10-27T11:30:00Z INFO: Patient watched movie "Action Adventure".
2023-10-27T14:00:00Z INFO: Patient entered Football Stadium.
2023-10-27T17:00:00Z INFO: Football game ended.
2023-10-27T19:00:00Z INFO: Patient had dinner with friends at "Italian Place".
2023-10-27T22:00:00Z WARNING: Patient reports occasional cough.
2023-10-27T22:30:00Z WARNING: Patient is feeling unusually tired.
2023-10-27T23:00:00Z ERROR: Patient's temperature is 101°F (38.3°C). Fever detected.
2023-10-27T23:30:00Z ERROR: Patient reports nausea.
2023-10-28T00:00:00Z ERROR: Patient's temperature is 102°F (38.9°C). Fever worsening.
2023-10-28T00:30:00Z ERROR: Patient reports severe nausea and dizziness.
2023-10-28T01:00:00Z ERROR: Patient reports chills and body aches.
```
In systems, logs include timestamps, severity, event text, and structured fields like client IP, request path, upstream host, etc. Example Nginx upstream error logs:
```text theme={null}
2023/10/27 10:00:15 [error] 123540#0: *123456 upstream timed out (110: Connection timed out) while reading response header from upstream, client: 192.168.1.10, server: example.com, request: "GET /api/data HTTP/1.1", upstream: "http://backend:8080/api/data", host: "example.com"
2023/10/27 10:00:16 [error] 123540#0: *123457 upstream prematurely closed connection while reading response header from upstream, client: 192.168.1.11, server: example.com, request: "POST /api/process HTTP/1.1", upstream: "http://backend:8080/api/process", host: "example.com"
...
```
Logs are scoped to a process or service; correlating logs with metrics and traces helps narrow investigations quickly.
## Traces — end-to-end request insight
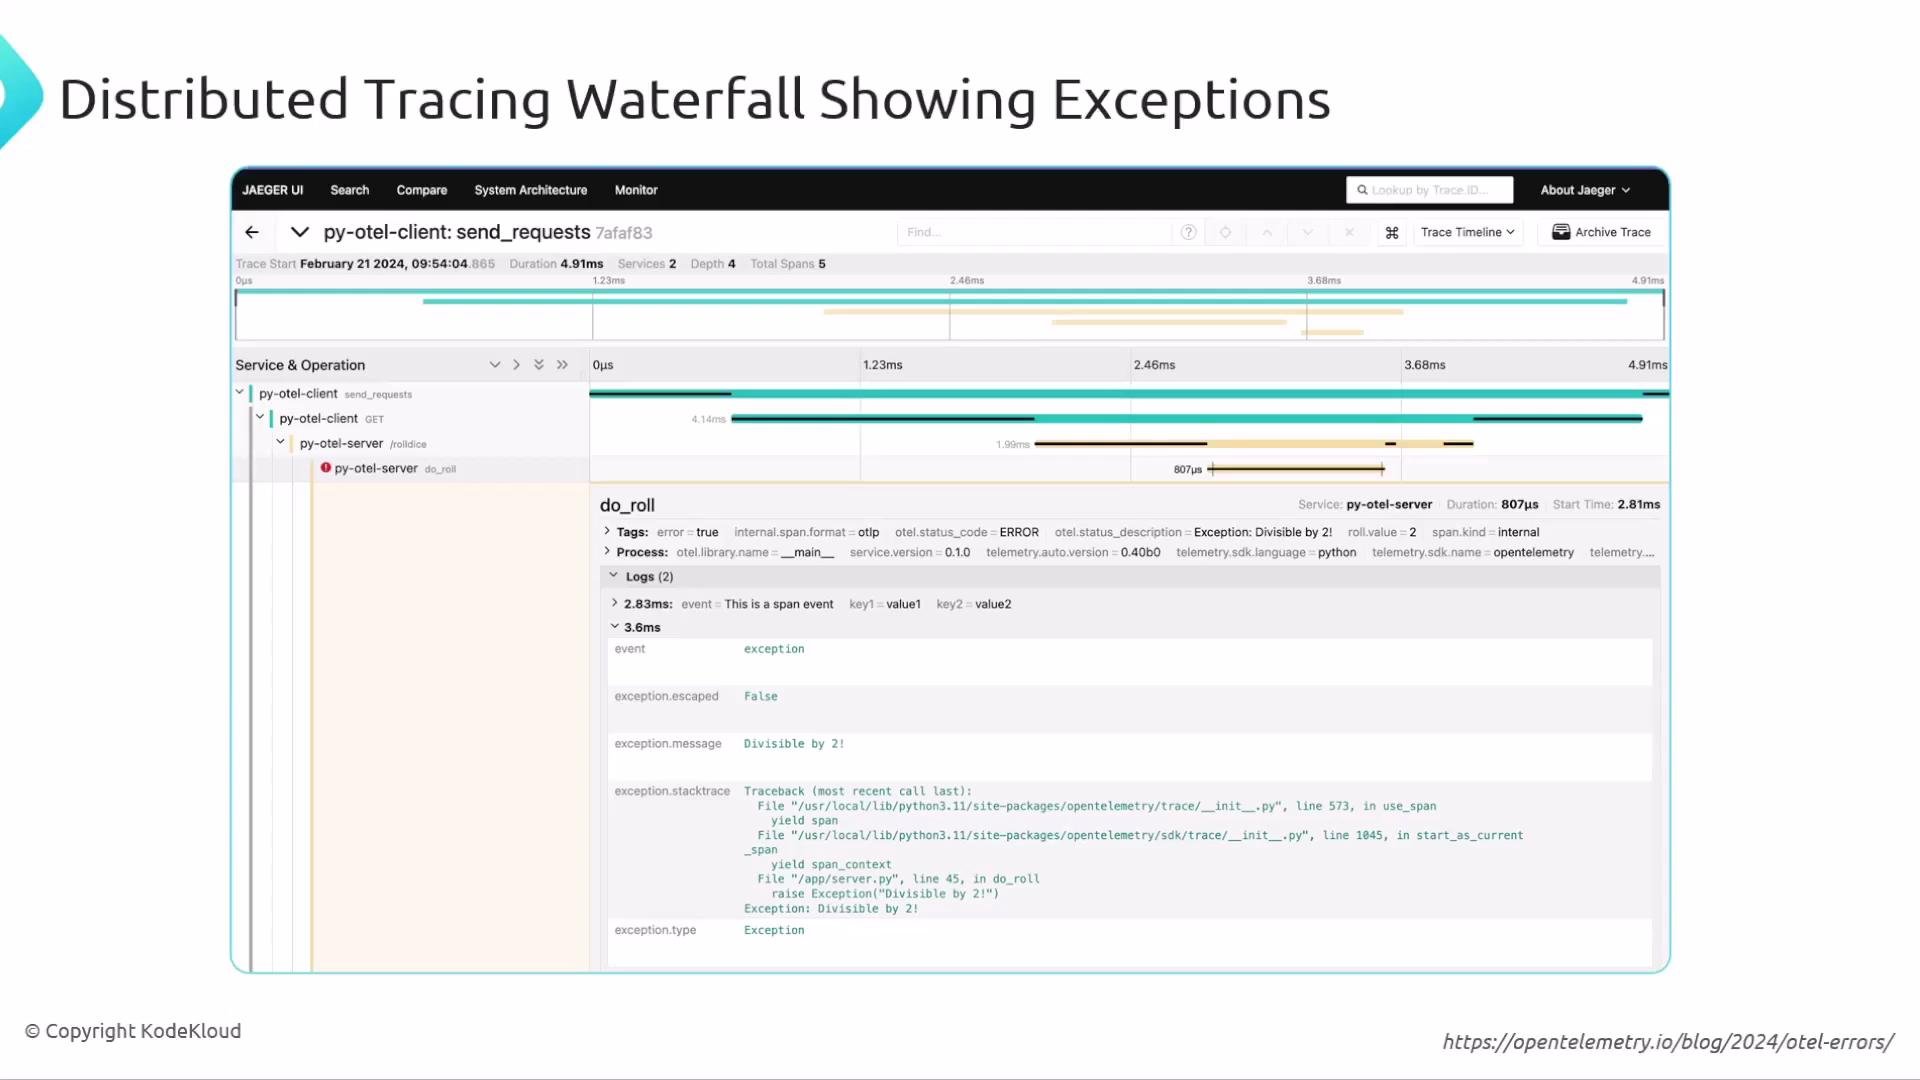
Distributed traces follow a single request as it travels through services. They show timing, dependencies, and where time is spent — ideal for locating latency hotspots or dependency failures. Think of a medical imaging test that reveals the precise area of impaired blood flow.
In a web application example, a checkout request may touch multiple services (frontend → checkout → payment → catalog → shipping). A trace stitches spans from each service into a single end-to-end view, revealing total time and each service’s contribution.
A trace (waterfall) view often highlights the slowest span and surfaces exceptions and errors encountered during the request.
For quick reference, here’s a compact comparison of typical metric types and their use-cases:
| Metric type | Use case | Example |
| -------------- | ------------------------------------ | ----------------------- |
| Latency | Detect increased response times | `p95 latency = 450ms` |
| Error rate | Alert on rising failures | `5xx per minute` |
| Throughput | Capacity planning and trend analysis | `requests/sec` |
| Resource usage | Detect saturation | `CPU %`, `memory MB` |
| Saturation | Trigger autoscaling or failover | `connection pool usage` |
## Logs — detailed, timestamped events
Logs are verbose records of individual events. They provide contextual details that metrics alone cannot. Think of a patient’s symptom timeline or diary.
Example patient event timeline:
```text theme={null}
2023-10-27T10:00:00Z INFO: Patient entered Mall.
2023-10-27T11:30:00Z INFO: Patient watched movie "Action Adventure".
2023-10-27T14:00:00Z INFO: Patient entered Football Stadium.
2023-10-27T17:00:00Z INFO: Football game ended.
2023-10-27T19:00:00Z INFO: Patient had dinner with friends at "Italian Place".
2023-10-27T22:00:00Z WARNING: Patient reports occasional cough.
2023-10-27T22:30:00Z WARNING: Patient is feeling unusually tired.
2023-10-27T23:00:00Z ERROR: Patient's temperature is 101°F (38.3°C). Fever detected.
2023-10-27T23:30:00Z ERROR: Patient reports nausea.
2023-10-28T00:00:00Z ERROR: Patient's temperature is 102°F (38.9°C). Fever worsening.
2023-10-28T00:30:00Z ERROR: Patient reports severe nausea and dizziness.
2023-10-28T01:00:00Z ERROR: Patient reports chills and body aches.
```
In systems, logs include timestamps, severity, event text, and structured fields like client IP, request path, upstream host, etc. Example Nginx upstream error logs:
```text theme={null}
2023/10/27 10:00:15 [error] 123540#0: *123456 upstream timed out (110: Connection timed out) while reading response header from upstream, client: 192.168.1.10, server: example.com, request: "GET /api/data HTTP/1.1", upstream: "http://backend:8080/api/data", host: "example.com"
2023/10/27 10:00:16 [error] 123540#0: *123457 upstream prematurely closed connection while reading response header from upstream, client: 192.168.1.11, server: example.com, request: "POST /api/process HTTP/1.1", upstream: "http://backend:8080/api/process", host: "example.com"
...
```
Logs are scoped to a process or service; correlating logs with metrics and traces helps narrow investigations quickly.
## Traces — end-to-end request insight
Distributed traces follow a single request as it travels through services. They show timing, dependencies, and where time is spent — ideal for locating latency hotspots or dependency failures. Think of a medical imaging test that reveals the precise area of impaired blood flow.
In a web application example, a checkout request may touch multiple services (frontend → checkout → payment → catalog → shipping). A trace stitches spans from each service into a single end-to-end view, revealing total time and each service’s contribution.
A trace (waterfall) view often highlights the slowest span and surfaces exceptions and errors encountered during the request.
 ## Metrics vs Logs vs Traces — quick comparison
| Signal | Purpose | Strengths |
| ------- | ----------------------------------- | ----------------------------------------------- |
| Metrics | Numeric health indicators | Fast, aggregated, ideal for alerting and trends |
| Logs | Event records with context | Detailed troubleshooting and forensic data |
| Traces | Request-level paths across services | Pinpoint latency and dependency issues |
These three are often called the "three pillars" of observability. That mental model helps structure thinking, but modern observability goes beyond just three signals.
## Additional telemetry and contextual signals
* Baggage: key/value context that travels with a trace (e.g., user ID, region) to help correlate behavior across services.
* Profiling: runtime samples of CPU, memory, and heap allocations to find inefficient code paths.
* Events and custom context: business events or debug snapshots that add diagnostic clarity.
The "three pillars" is a useful starting point, but real-world observability improves when metrics, logs, and traces are correlated with additional telemetry (baggage, profiling, events). Treat metrics, logs, and traces as core signals that are amplified by richer context.
## Correlation in practice
When metrics, logs, and traces are available and linked, you can answer the key operational question: why is this happening?
Example: combining container logs with a shell output confirms a pod's startup and worker processes:
```text theme={null}
controlplane ✗ kubectl logs nginx-5808777c-6wbc
/docker-entrypoint.sh: is not empty, will attempt to perform configuration
/docker-entrypoint.sh: Launching /docker-entrypoint.d/01-listen-on-ipv6.sh
/docker-entrypoint.sh: Launching /docker-entrypoint.d/20-listen-on-default.conf
/docker-entrypoint.sh: Configuration complete; ready for start up
2023/10/08 18:38:10 [notice] 1#1: using the "epoll" event method
2023/10/08 18:38:10 [notice] 1#1: start worker process 88
2023/10/08 18:38:10 [notice] 1#1: start worker process 89
```
Correlating that output with metrics (CPU, restarts) and traces (request latency) helps determine if an issue is environmental, configuration-related, or application-level.
## Metrics vs Logs vs Traces — quick comparison
| Signal | Purpose | Strengths |
| ------- | ----------------------------------- | ----------------------------------------------- |
| Metrics | Numeric health indicators | Fast, aggregated, ideal for alerting and trends |
| Logs | Event records with context | Detailed troubleshooting and forensic data |
| Traces | Request-level paths across services | Pinpoint latency and dependency issues |
These three are often called the "three pillars" of observability. That mental model helps structure thinking, but modern observability goes beyond just three signals.
## Additional telemetry and contextual signals
* Baggage: key/value context that travels with a trace (e.g., user ID, region) to help correlate behavior across services.
* Profiling: runtime samples of CPU, memory, and heap allocations to find inefficient code paths.
* Events and custom context: business events or debug snapshots that add diagnostic clarity.
The "three pillars" is a useful starting point, but real-world observability improves when metrics, logs, and traces are correlated with additional telemetry (baggage, profiling, events). Treat metrics, logs, and traces as core signals that are amplified by richer context.
## Correlation in practice
When metrics, logs, and traces are available and linked, you can answer the key operational question: why is this happening?
Example: combining container logs with a shell output confirms a pod's startup and worker processes:
```text theme={null}
controlplane ✗ kubectl logs nginx-5808777c-6wbc
/docker-entrypoint.sh: is not empty, will attempt to perform configuration
/docker-entrypoint.sh: Launching /docker-entrypoint.d/01-listen-on-ipv6.sh
/docker-entrypoint.sh: Launching /docker-entrypoint.d/20-listen-on-default.conf
/docker-entrypoint.sh: Configuration complete; ready for start up
2023/10/08 18:38:10 [notice] 1#1: using the "epoll" event method
2023/10/08 18:38:10 [notice] 1#1: start worker process 88
2023/10/08 18:38:10 [notice] 1#1: start worker process 89
```
Correlating that output with metrics (CPU, restarts) and traces (request latency) helps determine if an issue is environmental, configuration-related, or application-level.
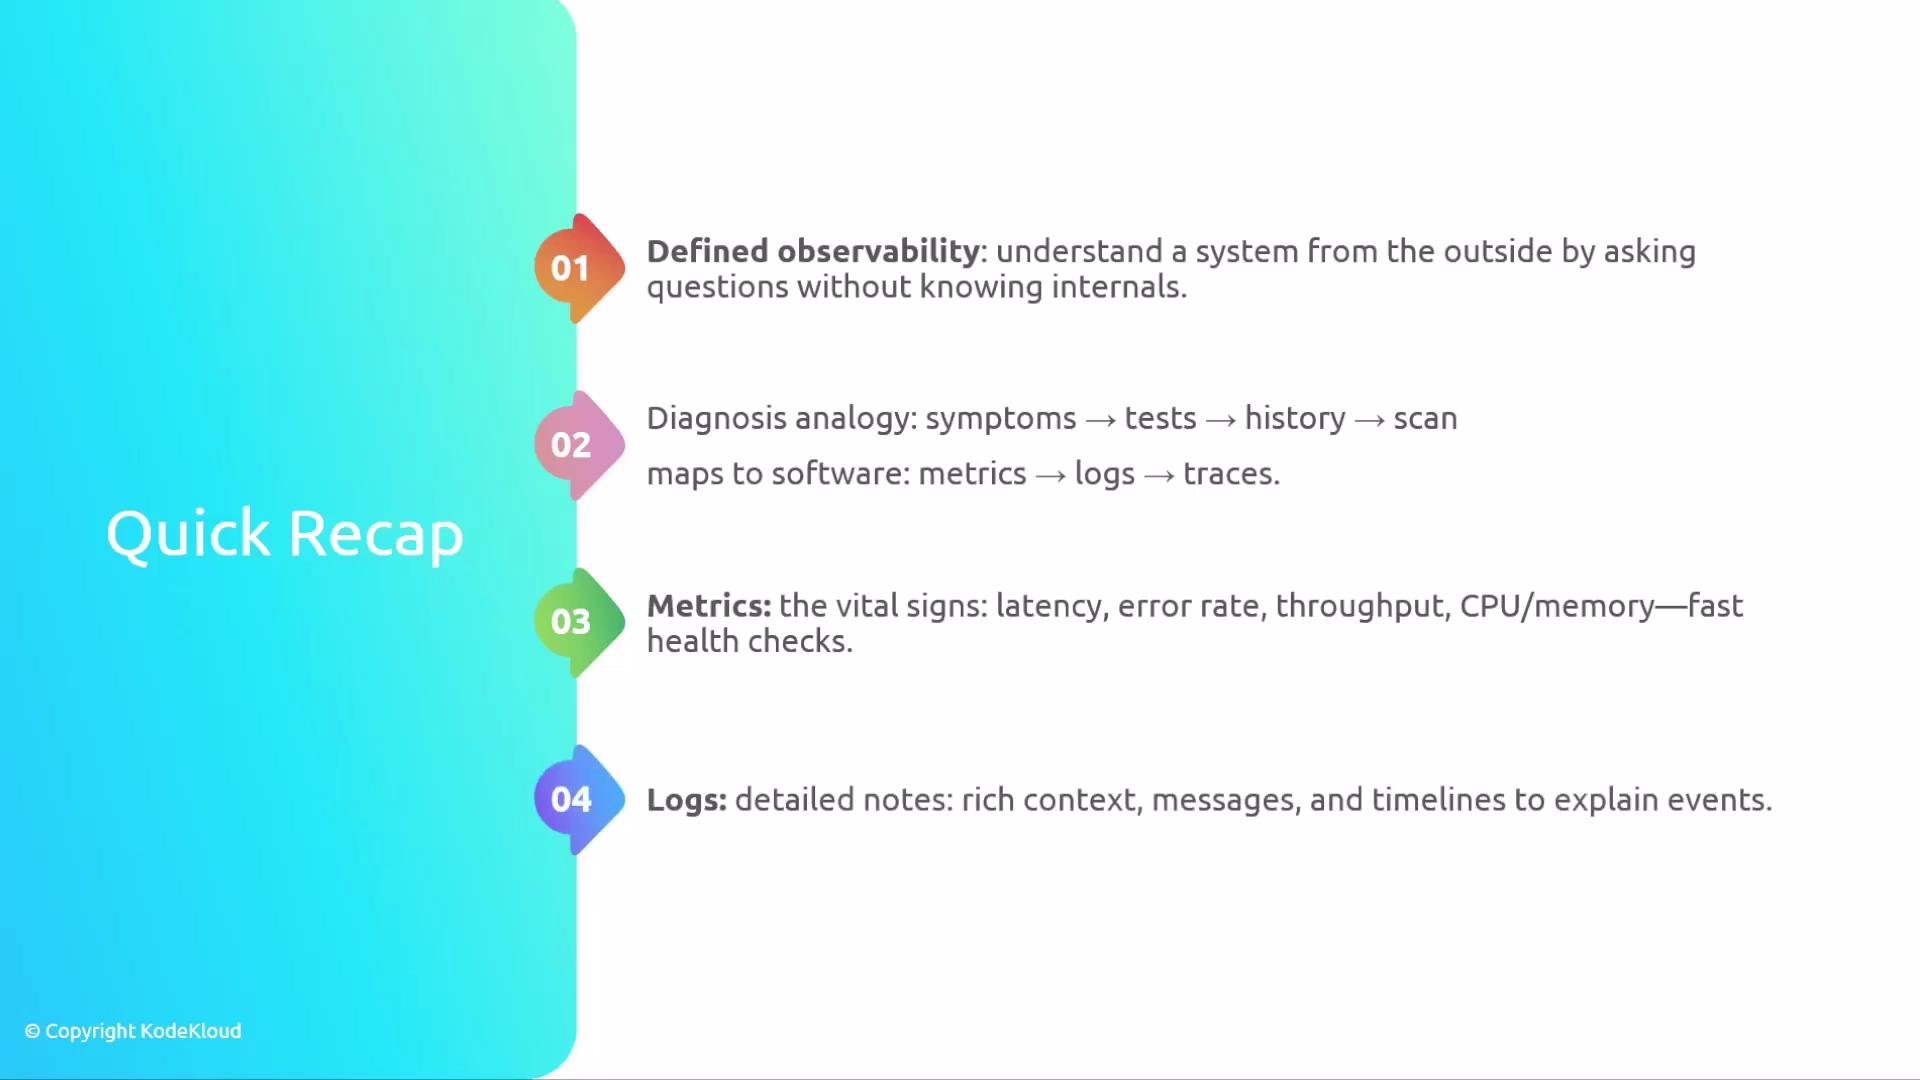 ## Quick recap
* Observability lets you understand a system from the outside without inspecting internals.
* Diagnosis analogy: symptoms → tests → history → scans maps to metrics → logs → traces.
* Metrics = vital signs; Logs = timelines and context; Traces = request paths and timing.
* Correlate signals (plus baggage and profiling when available) to reveal root causes and previously unknown issues.
## Links and references
* [OpenTelemetry](https://opentelemetry.io/)
* [Jaeger Tracing](https://www.jaegertracing.io/)
* [Prometheus Metrics](https://prometheus.io/)
* [Kubernetes Observability Concepts](https://kubernetes.io/docs/concepts/cluster-administration/logging/)
Thank you.
## Quick recap
* Observability lets you understand a system from the outside without inspecting internals.
* Diagnosis analogy: symptoms → tests → history → scans maps to metrics → logs → traces.
* Metrics = vital signs; Logs = timelines and context; Traces = request paths and timing.
* Correlate signals (plus baggage and profiling when available) to reveal root causes and previously unknown issues.
## Links and references
* [OpenTelemetry](https://opentelemetry.io/)
* [Jaeger Tracing](https://www.jaegertracing.io/)
* [Prometheus Metrics](https://prometheus.io/)
* [Kubernetes Observability Concepts](https://kubernetes.io/docs/concepts/cluster-administration/logging/)
Thank you.