> ## Documentation Index
> Fetch the complete documentation index at: https://notes.kodekloud.com/llms.txt
> Use this file to discover all available pages before exploring further.
# Debug Exporter
> Practical guide to the OpenTelemetry Collector debug exporter explaining purpose, configuration, verbosity levels, sampling usage, and best practices for debugging traces, metrics, and logs during development.
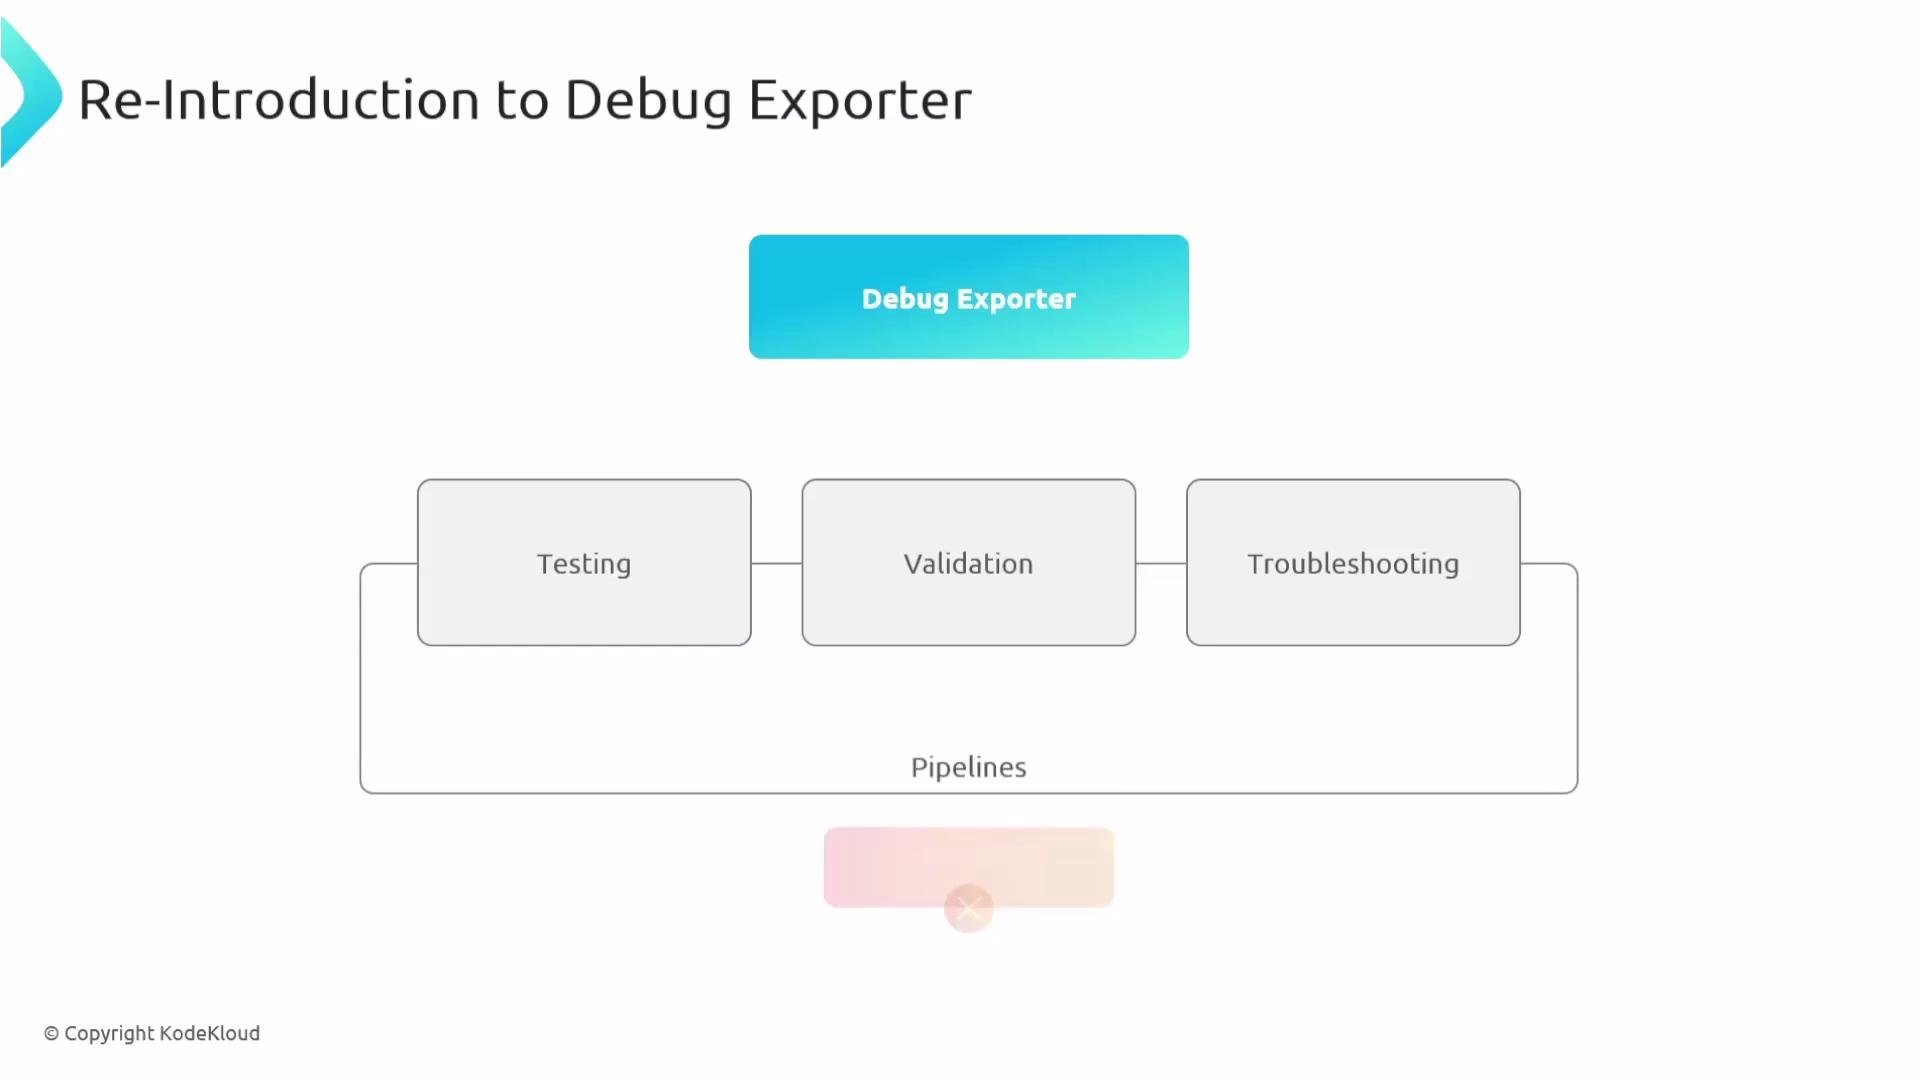
This article gives a concise, practical guide to the OpenTelemetry Collector debug exporter: what it is, how to configure it, and when to use it. The debug exporter writes telemetry (traces, metrics, logs) to the collector’s logs (stdout/stderr) with configurable verbosity and optional sampling. It is ideal for validating data, testing new configurations, and troubleshooting pipeline behavior during development.
The debug exporter is intended for debugging and testing only — it is not recommended for production use.
 ## What the debug exporter does
* Emits telemetry payloads to the collector log stream so you can inspect them in real time.
* Supports verbosity levels to control how much information is printed.
* Offers sampling controls to limit output volume in high-throughput environments.
Sampling is useful to keep log output manageable when telemetry rates are high.
```yaml theme={null}
exporters:
debug:
verbosity: detailed
sampling_initial: 5
sampling_thereafter: 200
```
Note: Setting `sampling_initial` and `sampling_thereafter` reduces how many items are printed (for example, the first N items are printed, then 1 in M thereafter).
To actually see output for a given signal (traces, metrics, logs), include the debug exporter in that signal’s pipeline. If not referenced in a pipeline, the collector will not print that signal’s data.
Example minimal configuration that enables the debug exporter for all three signals:
```yaml theme={null}
exporters:
debug:
verbosity: detailed
sampling_initial: 5
sampling_thereafter: 200
service:
pipelines:
traces:
receivers: [otlp]
exporters: [debug]
metrics:
receivers: [otlp]
exporters: [debug]
logs:
receivers: [otlp]
exporters: [debug]
```
## Verbosity levels
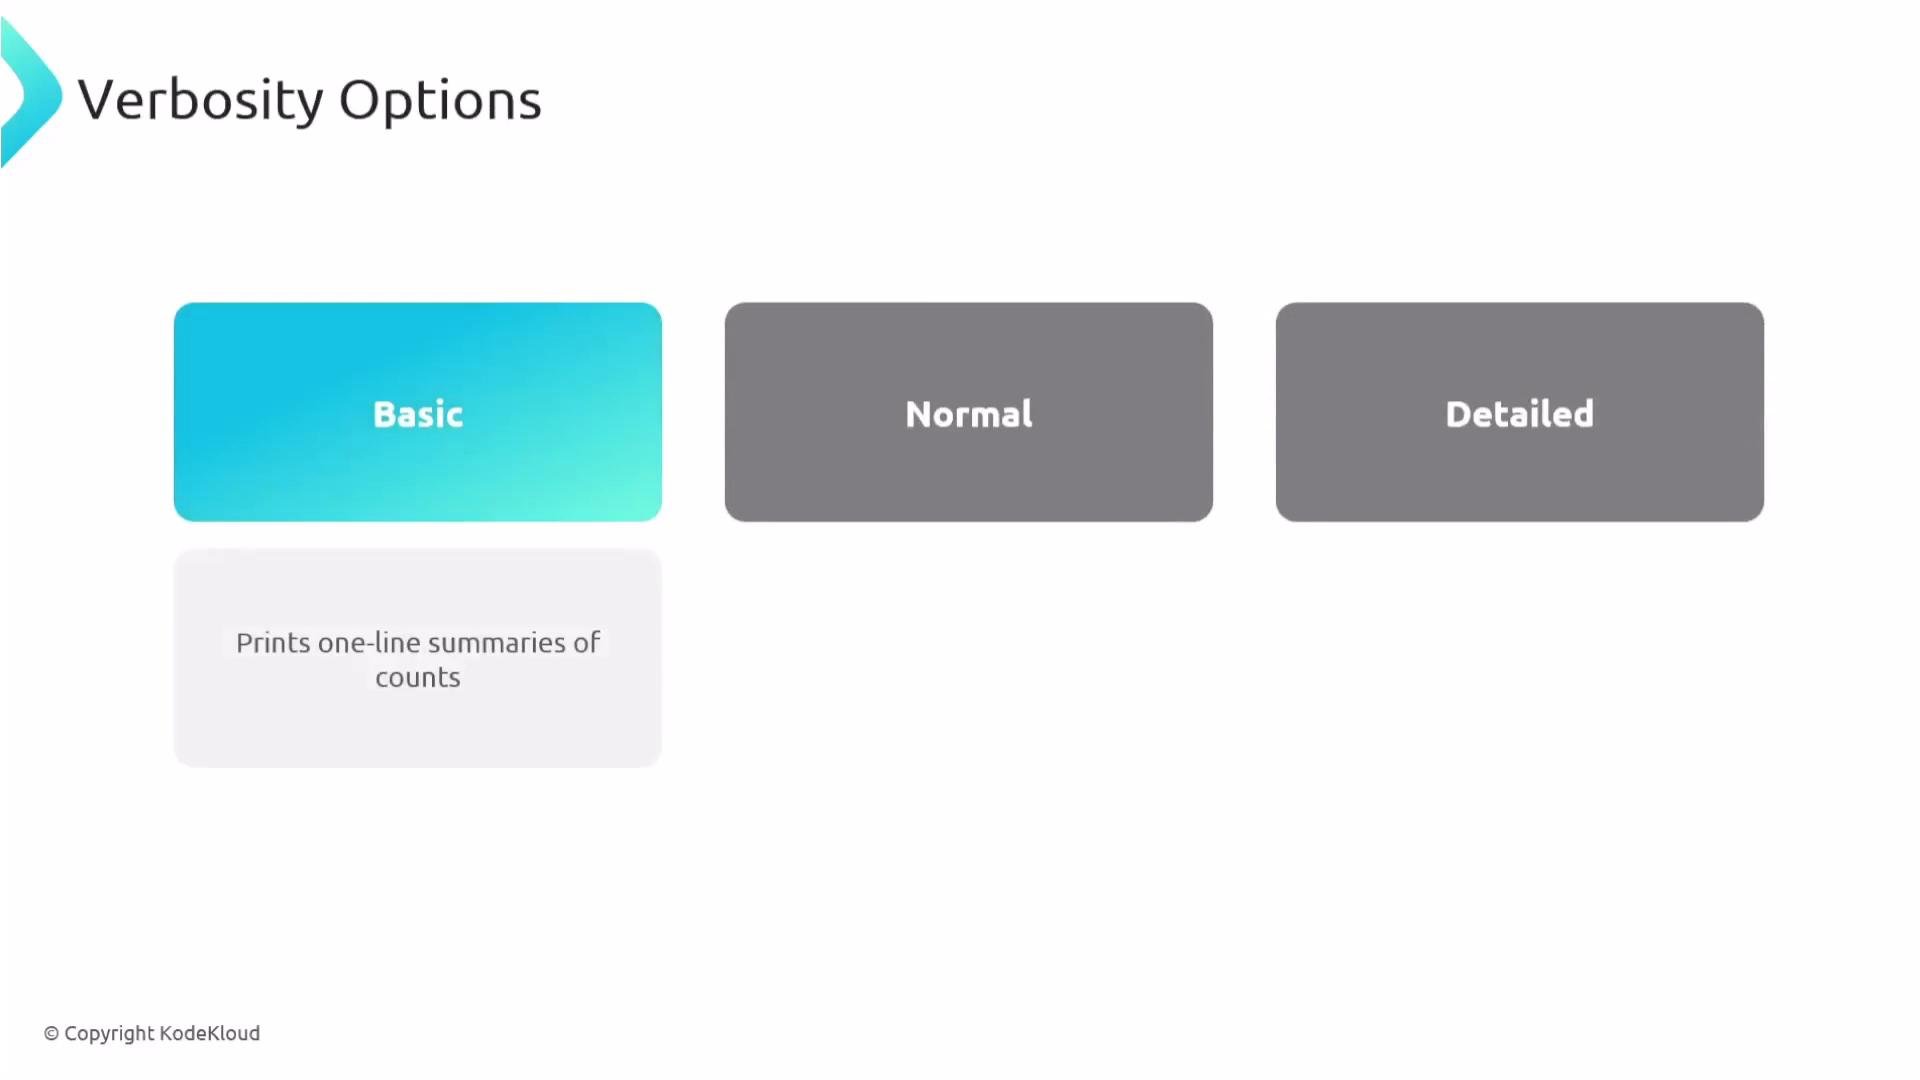
Verbosity controls how much the debug exporter prints. The three supported levels are `basic`, `normal`, and `detailed`. Use the appropriate level depending on how much inspection you need.
| Verbosity | What it prints | When to use it |
| ---------- | --------------------------------------------------------------------------------------- | ---------------------------------------------------------- |
| `basic` | One-line summaries with resource metadata, component ID, signal type, and counts. | Quick confirmation of data flow and volume. |
| `normal` | Resource and instrumentation scope metadata plus counts. | Inspect provenance and scopes without full payloads. |
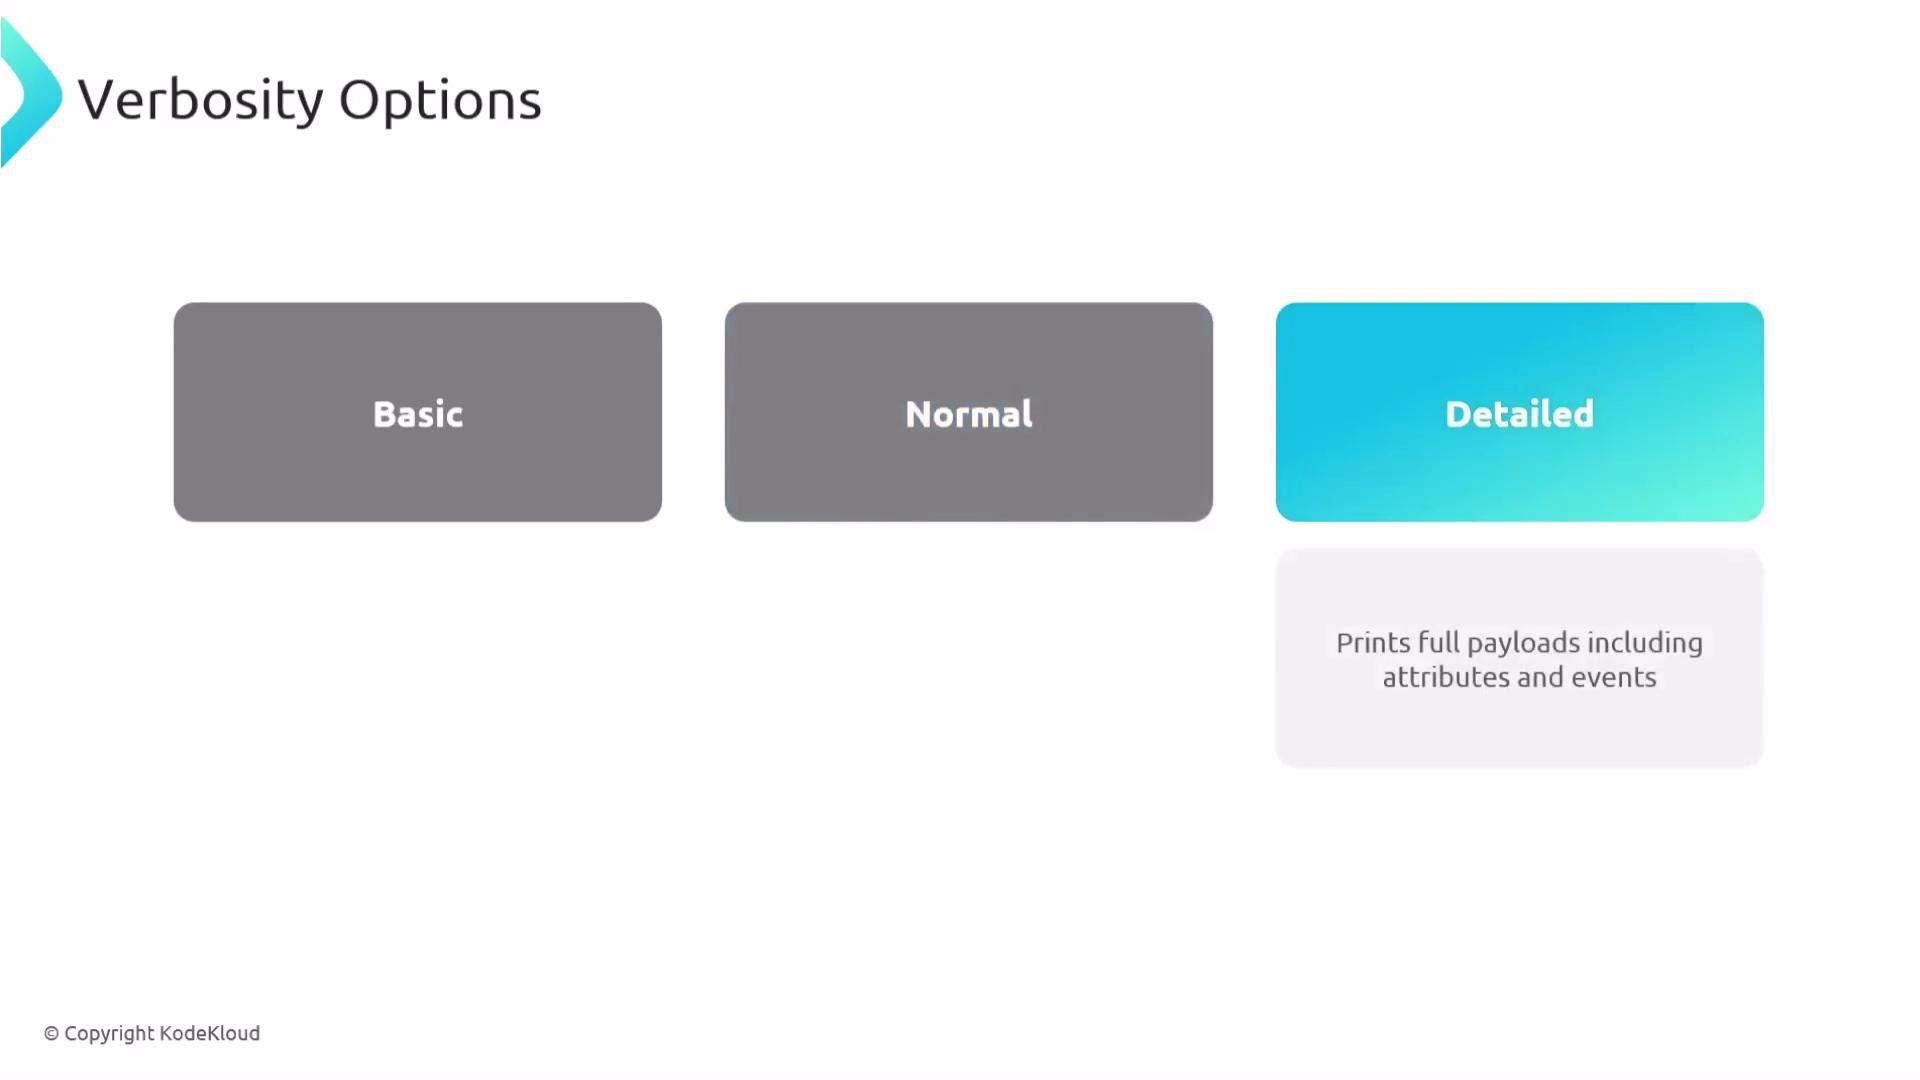
| `detailed` | Full payloads: complete spans, metrics, or log records including attributes and events. | Deep debugging; inspect attribute values, events, and IDs. |
## What the debug exporter does
* Emits telemetry payloads to the collector log stream so you can inspect them in real time.
* Supports verbosity levels to control how much information is printed.
* Offers sampling controls to limit output volume in high-throughput environments.
Sampling is useful to keep log output manageable when telemetry rates are high.
```yaml theme={null}
exporters:
debug:
verbosity: detailed
sampling_initial: 5
sampling_thereafter: 200
```
Note: Setting `sampling_initial` and `sampling_thereafter` reduces how many items are printed (for example, the first N items are printed, then 1 in M thereafter).
To actually see output for a given signal (traces, metrics, logs), include the debug exporter in that signal’s pipeline. If not referenced in a pipeline, the collector will not print that signal’s data.
Example minimal configuration that enables the debug exporter for all three signals:
```yaml theme={null}
exporters:
debug:
verbosity: detailed
sampling_initial: 5
sampling_thereafter: 200
service:
pipelines:
traces:
receivers: [otlp]
exporters: [debug]
metrics:
receivers: [otlp]
exporters: [debug]
logs:
receivers: [otlp]
exporters: [debug]
```
## Verbosity levels
Verbosity controls how much the debug exporter prints. The three supported levels are `basic`, `normal`, and `detailed`. Use the appropriate level depending on how much inspection you need.
| Verbosity | What it prints | When to use it |
| ---------- | --------------------------------------------------------------------------------------- | ---------------------------------------------------------- |
| `basic` | One-line summaries with resource metadata, component ID, signal type, and counts. | Quick confirmation of data flow and volume. |
| `normal` | Resource and instrumentation scope metadata plus counts. | Inspect provenance and scopes without full payloads. |
| `detailed` | Full payloads: complete spans, metrics, or log records including attributes and events. | Deep debugging; inspect attribute values, events, and IDs. |
 Example log entries produced with `basic` verbosity:
```text theme={null}
2025-09-13T15:59:41.427Z info Metrics {"otelcol.signal": "metrics", "metrics": 3, "data points": 3}
2025-09-13T15:59:41.427Z info Logs {"otelcol.signal": "logs", "log records": 50}
2025-09-13T15:59:41.627Z info Traces {"otelcol.signal": "traces", "spans": 100}
```
The `normal` level augments the above with resource and scope metadata. The `detailed` level prints full payloads including attributes and events.
Example log entries produced with `basic` verbosity:
```text theme={null}
2025-09-13T15:59:41.427Z info Metrics {"otelcol.signal": "metrics", "metrics": 3, "data points": 3}
2025-09-13T15:59:41.427Z info Logs {"otelcol.signal": "logs", "log records": 50}
2025-09-13T15:59:41.627Z info Traces {"otelcol.signal": "traces", "spans": 100}
```
The `normal` level augments the above with resource and scope metadata. The `detailed` level prints full payloads including attributes and events.
 A trimmed example of a `detailed` span record:
```text theme={null}
Span #99
Trace ID : 463e0fd125c7a4f513172fd76ad105af
ID : cfc32bcb41a321a2
Name : demo_operation
Attributes:
-> user.id: Str(mr9a9pa511)
-> session.id: Str(6xgsbqnw6jivfnwi)
Events:
SpanEvent #0
-> Name: step
-> Attributes:
-> state: Str(mid)
```
Detailed output is particularly useful to:
* validate payload structure,
* confirm context propagation (e.g., consistent trace IDs across spans),
* inspect attribute and field transformations applied by processors, and
* diagnose pipeline routing or dropping issues.
Be cautious: detailed debug output can include sensitive information and generate very large log volumes. Do not enable `detailed` verbosity in production. If needed, redirect collector stdout/stderr to a controlled file and restrict access.
## Additional notes and best practices
* The collector’s global logging level (e.g., `DEBUG`, `INFO`, `WARN`, `ERROR`) controls the collector’s own logs and is separate from the debug exporter `verbosity`.
* Debug exporter verbosity options: `basic | normal | detailed`.
* Persisting debug output: redirect stdout/stderr when launching the collector (for example, shell redirection or container log drivers).
* Use sampling parameters (`sampling_initial`, `sampling_thereafter`) to reduce noise when testing high-throughput pipelines.
## Links and references
* OpenTelemetry Collector — official docs: [https://opentelemetry.io/docs/collector/](https://opentelemetry.io/docs/collector/)
* OpenTelemetry configuration examples: [https://github.com/open-telemetry/opentelemetry-collector-contrib/tree/main/examples](https://github.com/open-telemetry/opentelemetry-collector-contrib/tree/main/examples)
This concludes the overview of the debug exporter.
A trimmed example of a `detailed` span record:
```text theme={null}
Span #99
Trace ID : 463e0fd125c7a4f513172fd76ad105af
ID : cfc32bcb41a321a2
Name : demo_operation
Attributes:
-> user.id: Str(mr9a9pa511)
-> session.id: Str(6xgsbqnw6jivfnwi)
Events:
SpanEvent #0
-> Name: step
-> Attributes:
-> state: Str(mid)
```
Detailed output is particularly useful to:
* validate payload structure,
* confirm context propagation (e.g., consistent trace IDs across spans),
* inspect attribute and field transformations applied by processors, and
* diagnose pipeline routing or dropping issues.
Be cautious: detailed debug output can include sensitive information and generate very large log volumes. Do not enable `detailed` verbosity in production. If needed, redirect collector stdout/stderr to a controlled file and restrict access.
## Additional notes and best practices
* The collector’s global logging level (e.g., `DEBUG`, `INFO`, `WARN`, `ERROR`) controls the collector’s own logs and is separate from the debug exporter `verbosity`.
* Debug exporter verbosity options: `basic | normal | detailed`.
* Persisting debug output: redirect stdout/stderr when launching the collector (for example, shell redirection or container log drivers).
* Use sampling parameters (`sampling_initial`, `sampling_thereafter`) to reduce noise when testing high-throughput pipelines.
## Links and references
* OpenTelemetry Collector — official docs: [https://opentelemetry.io/docs/collector/](https://opentelemetry.io/docs/collector/)
* OpenTelemetry configuration examples: [https://github.com/open-telemetry/opentelemetry-collector-contrib/tree/main/examples](https://github.com/open-telemetry/opentelemetry-collector-contrib/tree/main/examples)
This concludes the overview of the debug exporter.