> ## Documentation Index
> Fetch the complete documentation index at: https://notes.kodekloud.com/llms.txt
> Use this file to discover all available pages before exploring further.
# Extensions pprof
> Guide to enabling and using pprof in the OpenTelemetry Collector to collect and analyze CPU memory and concurrency profiles for performance debugging, with security and access recommendations
pprof is the built-in Go profiler used to inspect how the OpenTelemetry Collector behaves under load. It’s intended for deep performance debugging by collector developers or advanced operators, not for routine monitoring.
This guide explains how to enable the pprof extension so the collector exposes live runtime profiles. To enable pprof on port 1777, add the following to your collector configuration:
```yaml theme={null}
extensions:
pprof:
endpoint: "0.0.0.0:1777"
```
pprof exposes low-level runtime profiles (CPU, heap, goroutines, mutex contention, etc.). Use it only when diagnosing performance issues or performing targeted profiling—do not leave it exposed in production without access controls.
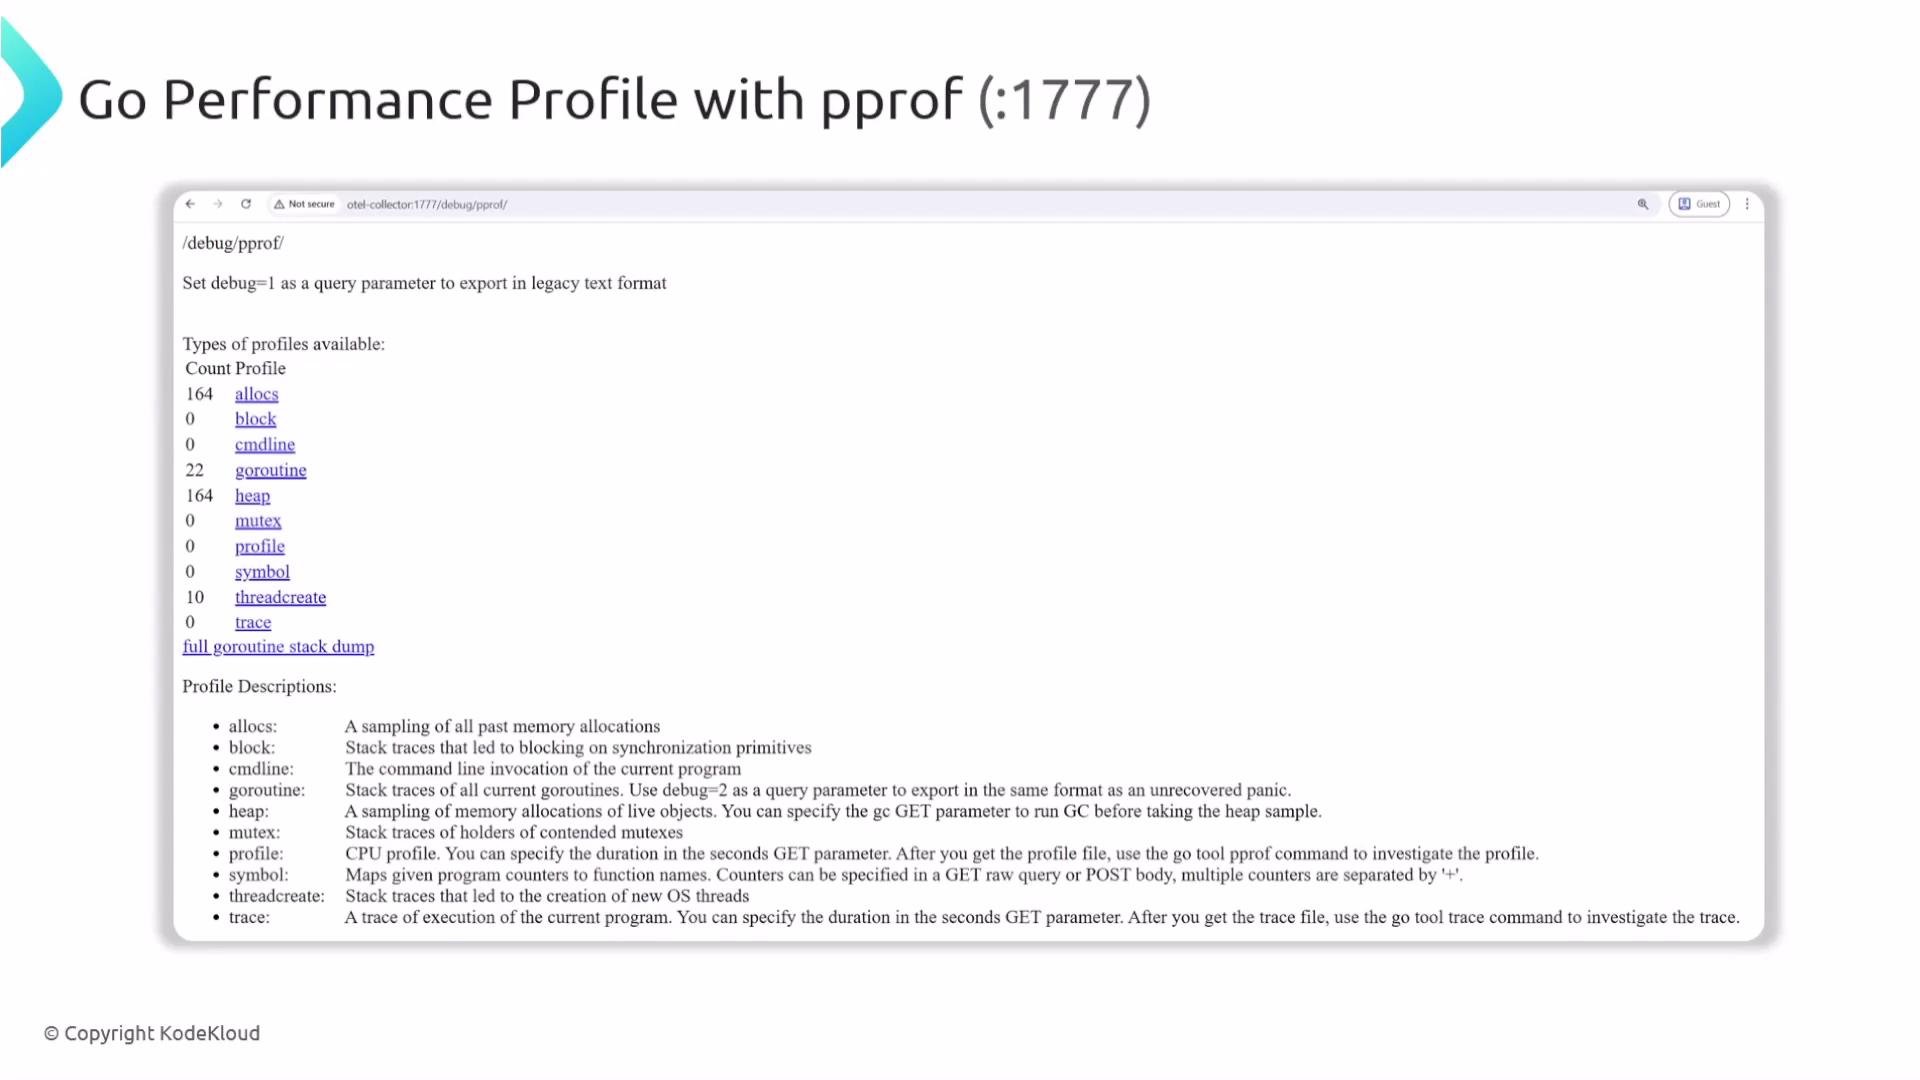
Once enabled, the pprof endpoint provides several runtime profiles. The most commonly used profiles are:
* CPU profile: shows where the collector spends processing time.
* Heap / allocs profiles: reveal memory usage and growth.
* Goroutine: lists active goroutines and helps detect leaks.
* Mutex: shows lock contention points.
* Block: shows where goroutines are blocked waiting (e.g., on network or synchronization).
You can also reference these in a quick lookup table:
| Profile | Purpose | Endpoint |
| ------------: | ---------------------------------------- | ---------------------------------- |
| CPU | Identify hot code paths consuming CPU | `/debug/pprof/profile?seconds=` |
| Heap / allocs | Inspect heap allocations and growth | `/debug/pprof/heap` |
| Goroutine | List active goroutines and stack traces | `/debug/pprof/goroutine?debug=1` |
| Mutex | Find lock contention hotspots | `/debug/pprof/mutex` |
| Block | Show blocking profile (contention/waits) | `/debug/pprof/block` |
The pprof web UI is available at `http://:1777/debug/pprof` and lists all available profiles for download and inspection.
 Downloading profiles for offline analysis
* Record a 30-second CPU profile from a local collector:
```bash theme={null}
curl -o cpu.pprof "http://localhost:1777/debug/pprof/profile?seconds=30"
```
* Download other useful profiles:
```bash theme={null}
curl -o heap.pprof "http://localhost:1777/debug/pprof/heap"
curl -o goroutine.txt "http://localhost:1777/debug/pprof/goroutine?debug=1"
curl -o mutex.pprof "http://localhost:1777/debug/pprof/mutex?seconds=10"
curl -o block.pprof "http://localhost:1777/debug/pprof/block?seconds=10"
```
Replace `localhost` with the collector host or IP where needed (for example, `http://my-collector-host:1777/debug/pprof/...`).
Analyzing profiles with the Go pprof tool
A common interactive workflow uses the `go tool pprof` visualizer:
```bash theme={null}
# Open a local web UI for the profile
go tool pprof -http=:8080 cpu.pprof
# If you have the collector binary for symbolization, include it:
go tool pprof -http=:8080 /path/to/otelcol cpu.pprof
```
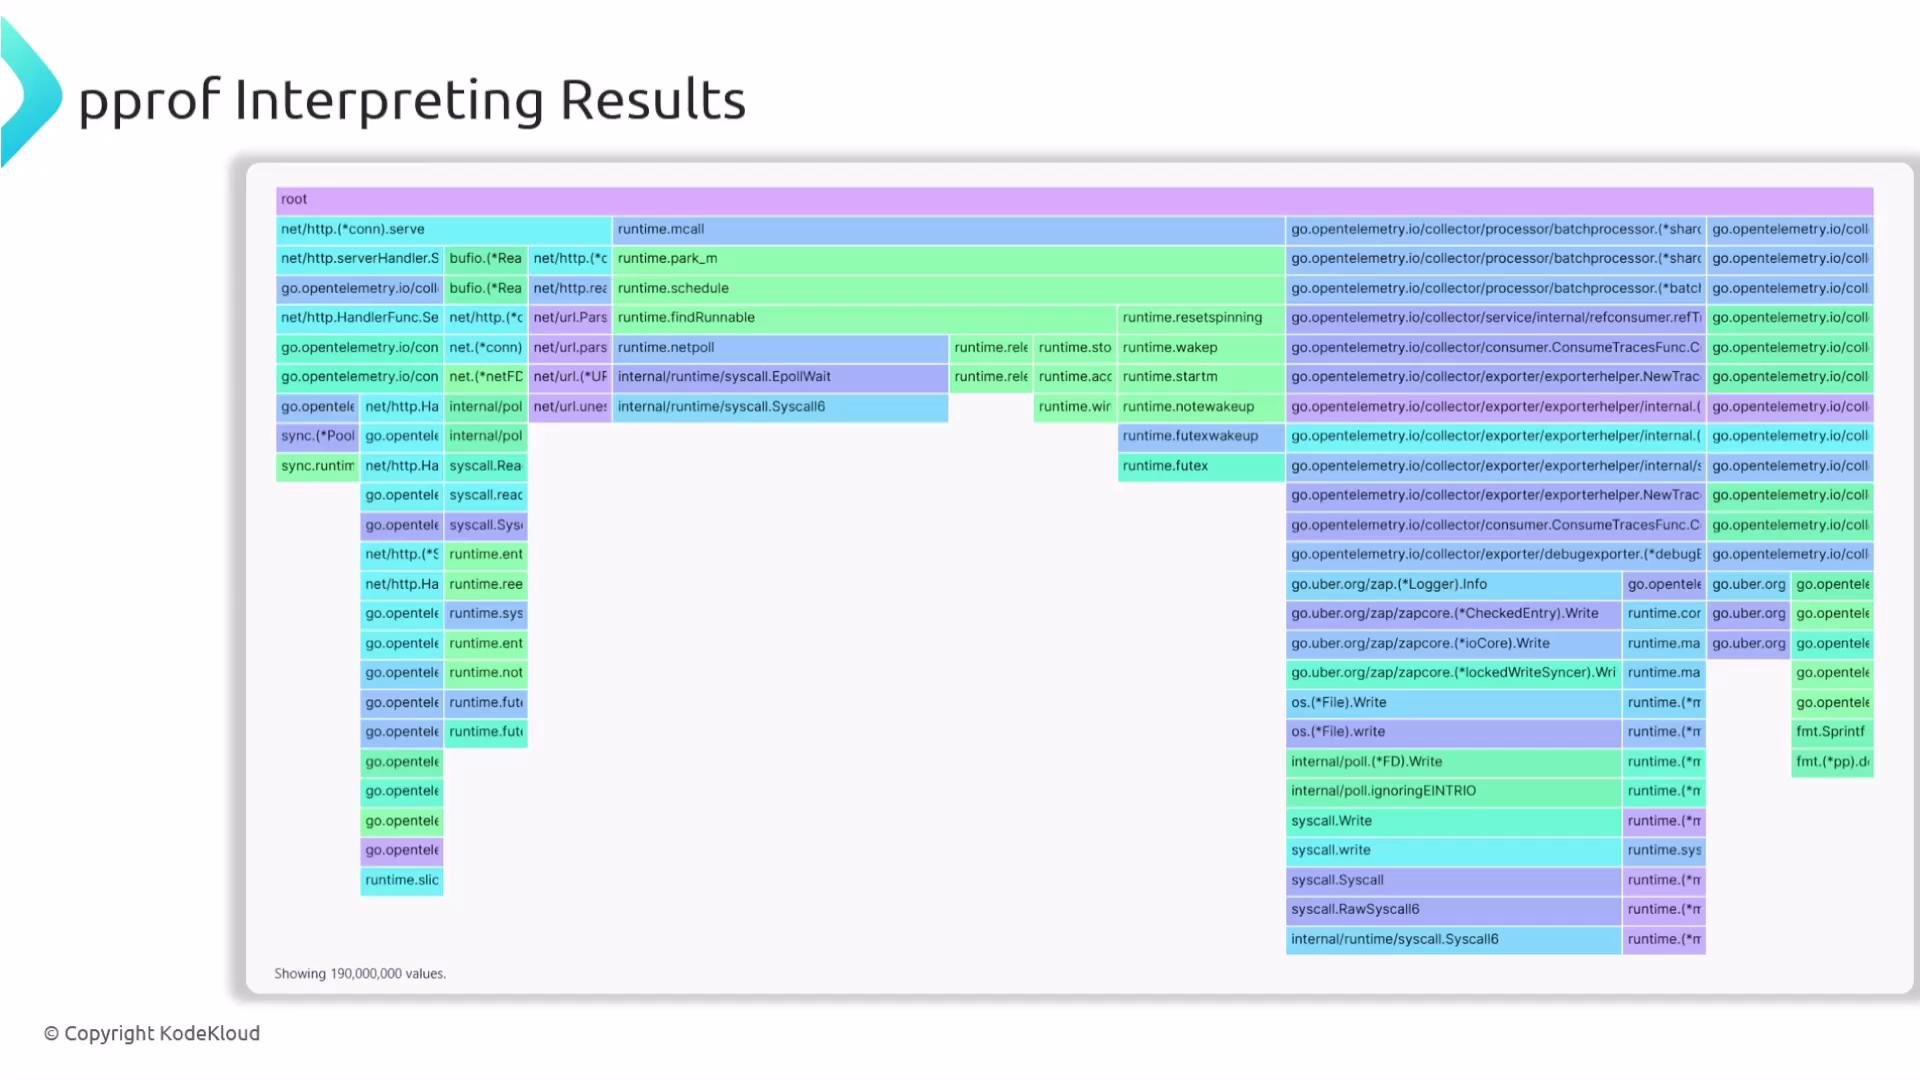
The pprof visualizer supports flame graphs, callgraphs, and textual reports. Flame graphs are particularly useful to quickly identify hot call paths—wider blocks represent functions that consume more CPU time.
Downloading profiles for offline analysis
* Record a 30-second CPU profile from a local collector:
```bash theme={null}
curl -o cpu.pprof "http://localhost:1777/debug/pprof/profile?seconds=30"
```
* Download other useful profiles:
```bash theme={null}
curl -o heap.pprof "http://localhost:1777/debug/pprof/heap"
curl -o goroutine.txt "http://localhost:1777/debug/pprof/goroutine?debug=1"
curl -o mutex.pprof "http://localhost:1777/debug/pprof/mutex?seconds=10"
curl -o block.pprof "http://localhost:1777/debug/pprof/block?seconds=10"
```
Replace `localhost` with the collector host or IP where needed (for example, `http://my-collector-host:1777/debug/pprof/...`).
Analyzing profiles with the Go pprof tool
A common interactive workflow uses the `go tool pprof` visualizer:
```bash theme={null}
# Open a local web UI for the profile
go tool pprof -http=:8080 cpu.pprof
# If you have the collector binary for symbolization, include it:
go tool pprof -http=:8080 /path/to/otelcol cpu.pprof
```
The pprof visualizer supports flame graphs, callgraphs, and textual reports. Flame graphs are particularly useful to quickly identify hot call paths—wider blocks represent functions that consume more CPU time.
 Interpreting flame graphs and call stacks
* Start from the wide blocks (hot functions) and trace downward to leaf functions to understand where time is spent.
* Look for heavy usage in components such as the batch processor, exporters, or custom receivers/processors.
* Use heap and allocs data to correlate CPU activity with memory growth; goroutine and mutex profiles often reveal synchronization bottlenecks or leaks.
* Prioritize optimization on code paths that are both high-cost and frequently executed.
pprof endpoints can expose detailed runtime and stack information. Do not expose them to untrusted networks—restrict access with network controls (firewalls, port binding), or secure access methods (SSH tunnels, VPNs).
Links and references
* Go pprof documentation: [https://pkg.go.dev/net/http/pprof](https://pkg.go.dev/net/http/pprof)
* go tool pprof: [https://github.com/google/pprof](https://github.com/google/pprof)
* OpenTelemetry Collector repo: [https://github.com/open-telemetry/opentelemetry-collector](https://github.com/open-telemetry/opentelemetry-collector)
This covers enabling pprof in the OpenTelemetry Collector, collecting runtime profiles, and basic analysis workflows to find CPU, memory, and concurrency issues.
Interpreting flame graphs and call stacks
* Start from the wide blocks (hot functions) and trace downward to leaf functions to understand where time is spent.
* Look for heavy usage in components such as the batch processor, exporters, or custom receivers/processors.
* Use heap and allocs data to correlate CPU activity with memory growth; goroutine and mutex profiles often reveal synchronization bottlenecks or leaks.
* Prioritize optimization on code paths that are both high-cost and frequently executed.
pprof endpoints can expose detailed runtime and stack information. Do not expose them to untrusted networks—restrict access with network controls (firewalls, port binding), or secure access methods (SSH tunnels, VPNs).
Links and references
* Go pprof documentation: [https://pkg.go.dev/net/http/pprof](https://pkg.go.dev/net/http/pprof)
* go tool pprof: [https://github.com/google/pprof](https://github.com/google/pprof)
* OpenTelemetry Collector repo: [https://github.com/open-telemetry/opentelemetry-collector](https://github.com/open-telemetry/opentelemetry-collector)
This covers enabling pprof in the OpenTelemetry Collector, collecting runtime profiles, and basic analysis workflows to find CPU, memory, and concurrency issues.