> ## Documentation Index
> Fetch the complete documentation index at: https://notes.kodekloud.com/llms.txt
> Use this file to discover all available pages before exploring further.
# Internal Logs of the Collector
> How to view and configure OpenTelemetry Collector internal logs, control log levels and formats, stream logs in environments, and troubleshoot startup and runtime issues
In this lesson we cover how to read and configure the OpenTelemetry Collector's internal logs to help diagnose startup, pipeline loading, configuration issues, and runtime problems.
By default the Collector writes internal logs to standard error (stderr) at the INFO level even if you do not configure `service.telemetry.logs`. These logs include startup/shutdown messages, pipeline readiness confirmations, component warnings, and metadata such as the Collector version and service instance ID.
By default the Collector logs internal activity at INFO to standard error (`stderr`). This provides immediate visibility into startup and runtime behavior without adding any telemetry configuration.
## Minimal configuration example
A minimal Collector config without a `service.telemetry.logs` section still emits INFO logs to stderr:
```yaml theme={null}
receivers:
# No-op receiver - does nothing, lightweight placeholder
nop:
exporters:
# No-op exporter - discards all data, lightweight placeholder
nop:
service:
pipelines:
# noop traces pipeline
traces:
receivers: [nop]
exporters: [nop]
# No service.telemetry.logs section configured
# Even without a service.telemetry.logs section, logs appear at the default INFO level.
```
When you run the Collector with this config, you will see internal logs like the example below printed to the console:
```powershell theme={null}
PS C:\ProgramData\OpenTelemetry Collector> otelcol-contrib --config .\nop.yaml
2025-11-09T18:49:19.745+1100 info service@v0.132.0/service.go:187 Setting up own {"resource": {"service.instance.id": "512d76cd-f7d6-4dee-ae03-a0fd687f6143", "service.name": "otelcol-contrib", "service.version": "0.132.0"}}
2025-11-09T18:49:19.745+1100 info service@v0.132.0/service.go:249 Starting otelcol-contrib... {"resource": {"service.instance.id": "512d76cd-f7d6-4dee-ae03-a0fd687f6143", "service.name": "otelcol-contrib", "service.version": "0.132.0"}, "Version": "0.132.0"}
2025-11-09T18:49:19.745+1100 info extensions/extensions.go:41 Starting extensions... {"resource": {"service.instance.id": "512d76cd-f7d6-4dee-ae03-a0fd687f6143", "service.version": "0.132.0"}}
2025-11-09T18:49:19.745+1100 info service@v0.132.0/service.go:272 Everything is ready. {"resource": {"service.instance.id": "512d76cd-f7d6-4dee-ae03-a0fd687f6143", "service.name": "otelcol-contrib", "service.version": "0.132.0"}}
```
These messages indicate the Collector version, a unique service instance ID, and readiness confirmations.
## Where to view Collector logs in production
Common ways to stream Collector logs by environment:
| Environment | Command |
| --------------- | --------------------------------------------------------------- |
| Linux (systemd) | `sudo journalctl -u otelcol-contrib -f` |
| Docker | `docker logs -f otelcol` |
| Kubernetes | `kubectl logs -n observability -c otel-collector -f` |
Tip: in Kubernetes, replace `` with your actual Collector pod name or use a label selector with `-l`. See [Kubernetes Logs](https://kubernetes.io/docs/concepts/cluster-administration/logging/) for more details.
## Configuring service.telemetry.logs
To control Collector internal logging (verbosity, format, sampling, and destinations), add a `service.telemetry.logs` block under `service`. The `level` field accepts `DEBUG`, `INFO`, `WARN`, and `ERROR`.
* DEBUG: detailed component-level activity — useful for development and troubleshooting.
* INFO: default operational messages.
* WARN / ERROR: reduce output to only problematic events — recommended for production.
Example: enable debug-level logs to get more detailed initialization output:
```powershell theme={null}
PS C:\ProgramData\OpenTelemetry Collector> otelcol-contrib --config .\nop-w-telemetry.yaml
2025-11-09T19:04:35.396+1100 info service@v0.132.0:187 Setting up own telemetry... {"resource": {"service.instance.id": "21fa506d-662f-467f-9e0c-77de328804d6", "service.name": "otelcol-contrib", "service.version": "0.132.0"}}
2025-11-09T19:04:35.397+1100 debug builders/builders.go:24 Beta component. May change in the future. {"resource": {"service.instance.id": "21fa506d-662f-467f-9e0c-77de328804d6", "service.name": "otelcol-contrib", "service.version": "0.132.0", "otelcol.component.id": "nop", "otelcol.component.kind": "exporter", "otelcol.signal": "traces"}}
2025-11-09T19:04:35.397+1100 debug builders/builders.go:24 Beta component. May change in the future. {"resource": {"service.instance.id": "21fa506d-662f-467f-9e0c-77de328804d6", "service.name": "otelcol-contrib", "service.version": "0.132.0", "otelcol.component.id": "nop", "otelcol.component.kind": "receiver", "otelcol.signal": "traces"}}
2025-11-09T19:04:35.397+1100 info service@v0.132.0/service.go:249 Starting otelcol-contrib... {"resource": {"service.instance.id": "21fa506d-662f-467f-9e0c-77de328804d6", "service.name": "otelcol-contrib", "service.version": "0.132.0"}, "Version": "0.132.0"}
2025-11-09T19:04:35.397+1100 info extensions/extensions.go:41 Starting extensions... {"resource": {"service.instance.id": "21fa506d-662f-467f-9e0c-77de328804d6", "service.name": "otelcol-contrib", "service.version": "0.132.0"}}
2025-11-09T19:04:35.397+1100 info service@v0.132.0/service.go:272 Everything is ready. {"resource": {"service.instance.id": "21fa506d-662f-467f-9e0c-77de328804d6", "service.name": "otelcol-contrib", "service.version": "0.132.0"}}
```
YAML to set the level to DEBUG:
```yaml theme={null}
service:
telemetry:
logs:
level: "DEBUG"
```
For production use a higher threshold such as ERROR:
```yaml theme={null}
service:
telemetry:
logs:
level: "ERROR" # DEBUG | INFO | WARN | ERROR
```
Writing logs to local files or enabling DEBUG in production can increase disk usage and expose sensitive details. Review retention and access controls if you persist Collector logs.
## Advanced logging options
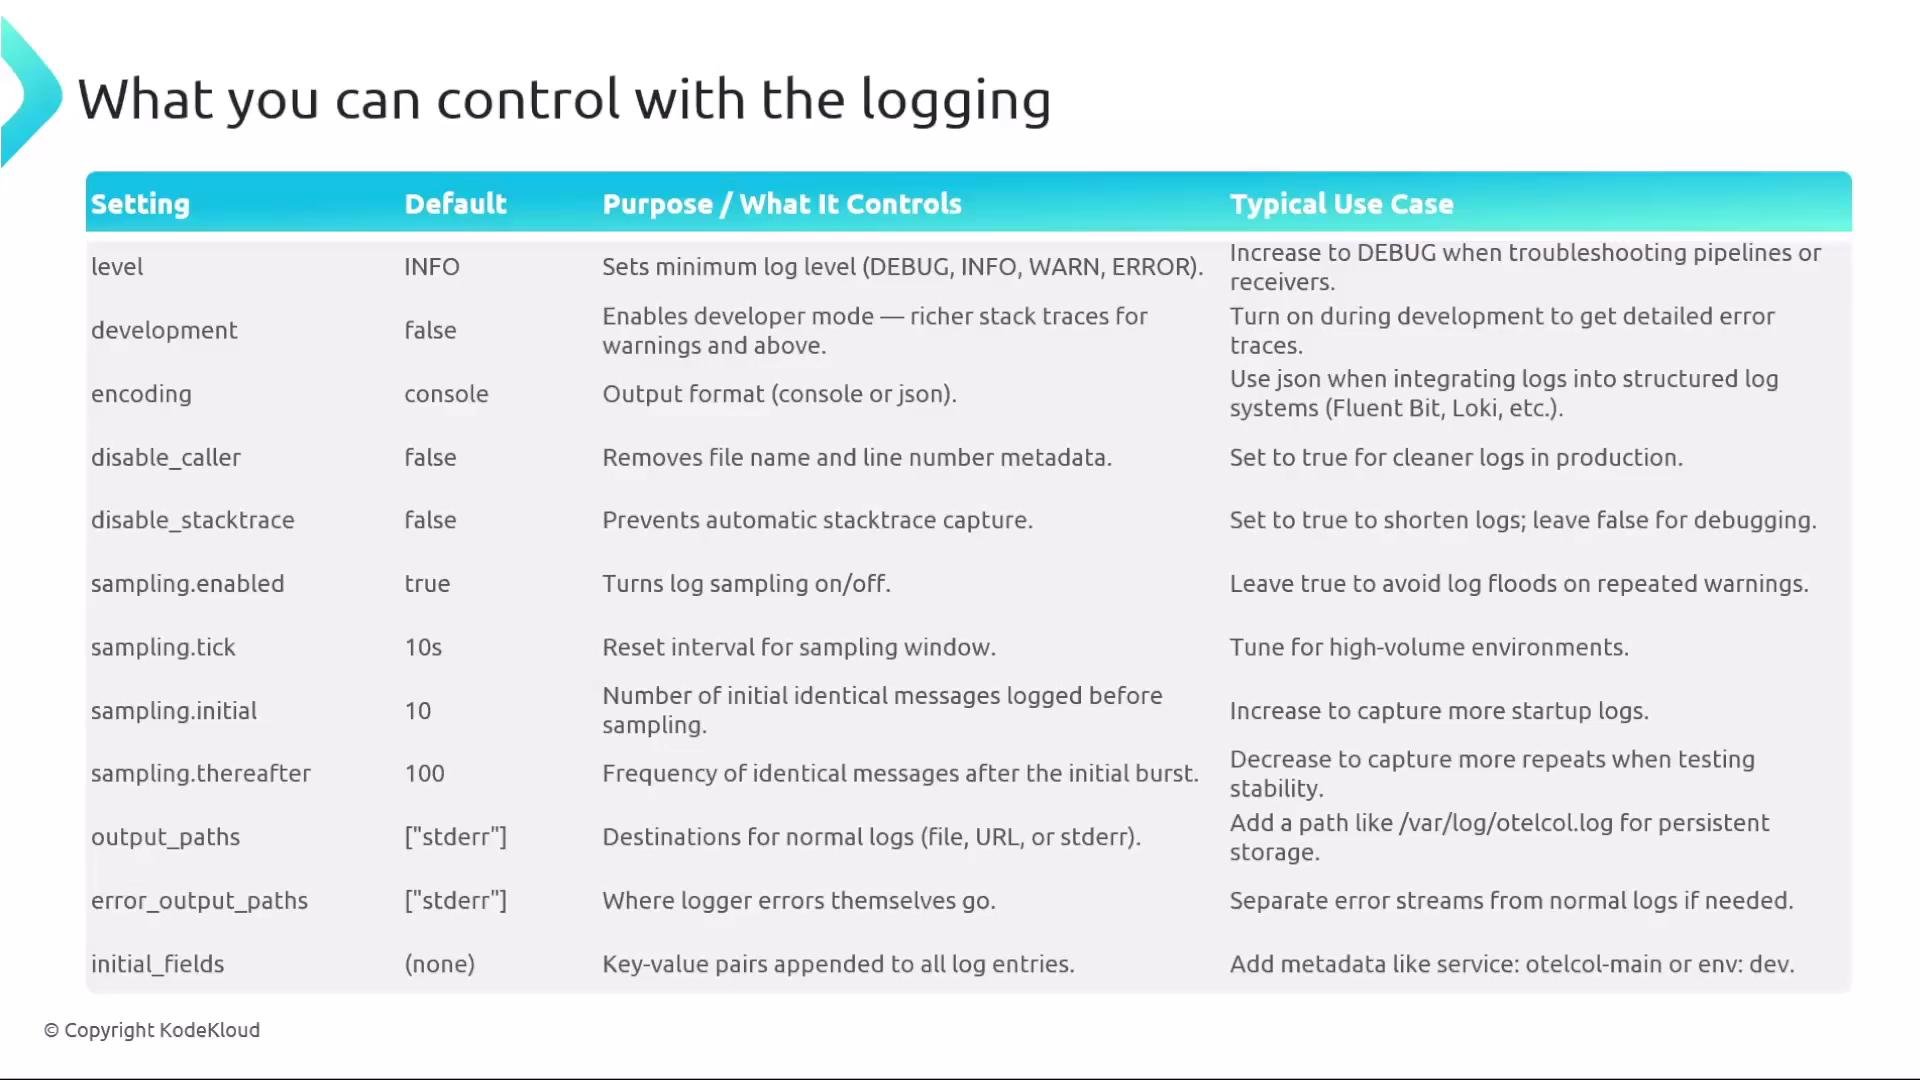
Beyond `level`, the `service.telemetry.logs` block supports additional fields to fine-tune behavior: `development`, `encoding`, caller info, stack traces, sampling, and output paths.
Example advanced configuration:
```yaml theme={null}
service:
telemetry:
logs:
level: "DEBUG" # DEBUG | INFO | WARN | ERROR
development: true # Enables developer mode (richer error context)
encoding: json # "console" (default) or "json"
disable_caller: false # Include source file & line number in log messages
disable_stacktrace: false # Include stacktraces for WARN/ERROR logs
sampling:
enabled: true # Enable log sampling to prevent floods
tick: 5s # Reset sampling every 5 seconds
initial: 5 # Log the first 5 identical messages
thereafter: 50 # Then log every 50th repeated message
output_paths: ["stderr", "/var/log/otelcol.log"] # Normal logs (stderr or file paths)
error_output_paths: ["/var/log/otelcol_error.log"] # Error logs (file paths or stderr)
initial_fields: # Key-value pairs added to every log entry
service: "otelcol-contrib"
environment: "dev-lab"
```
Notes:
* Use `encoding: json` for structured logs that integrate with log aggregation systems.
* Enable `sampling` to prevent repeated identical messages from flooding logs.
* `output_paths` and `error_output_paths` let you persist logs to files in addition to stderr.
 ## Structured logging and troubleshooting
When `encoding: json` is enabled, each log line is a JSON object which is much easier to ingest and query in centralized log systems. During debugging, keep `disable_stacktrace: false` and `disable_caller: false` to get file/line and stack traces for errors.
Example pipeline + telemetry configuration — ensure the `telemetry` block is nested under `service`:
```yaml theme={null}
receivers:
otlp:
protocols:
grpc:
http:
exporters:
debug:
verbosity: detailed # basic | normal | detailed
service:
pipelines:
traces:
receivers: [otlp]
exporters: [debug]
metrics:
receivers: [otlp]
exporters: [debug]
logs:
receivers: [otlp]
exporters: [debug]
telemetry:
logs:
level: "INFO" # DEBUG | INFO | WARN | ERROR
```
This setup validates pipelines and allows you to inspect telemetry data and internal Collector logs via the `debug` exporter.
## Quick references
Log level summary:
| Level | Purpose | When to use |
| ----- | -------------------------------------- | ----------------------------------------------- |
| DEBUG | Verbose, component-level messages | Development, deep troubleshooting |
| INFO | General operational messages (default) | Normal operations, startup checks |
| WARN | Warnings about potential issues | Restricted noise while still surfacing concerns |
| ERROR | Only errors | Production when you want minimal logs |
Commands to stream Collector logs (repeat):
| Platform | Example |
| ---------- | ---------------------------------------------------------------------------- |
| systemd | `sudo journalctl -u otelcol-contrib -f` |
| Docker | `docker logs -f otelcol` |
| Kubernetes | `kubectl logs -n observability \` + "``" + ` -c otel-collector -f` |
## Key takeaways
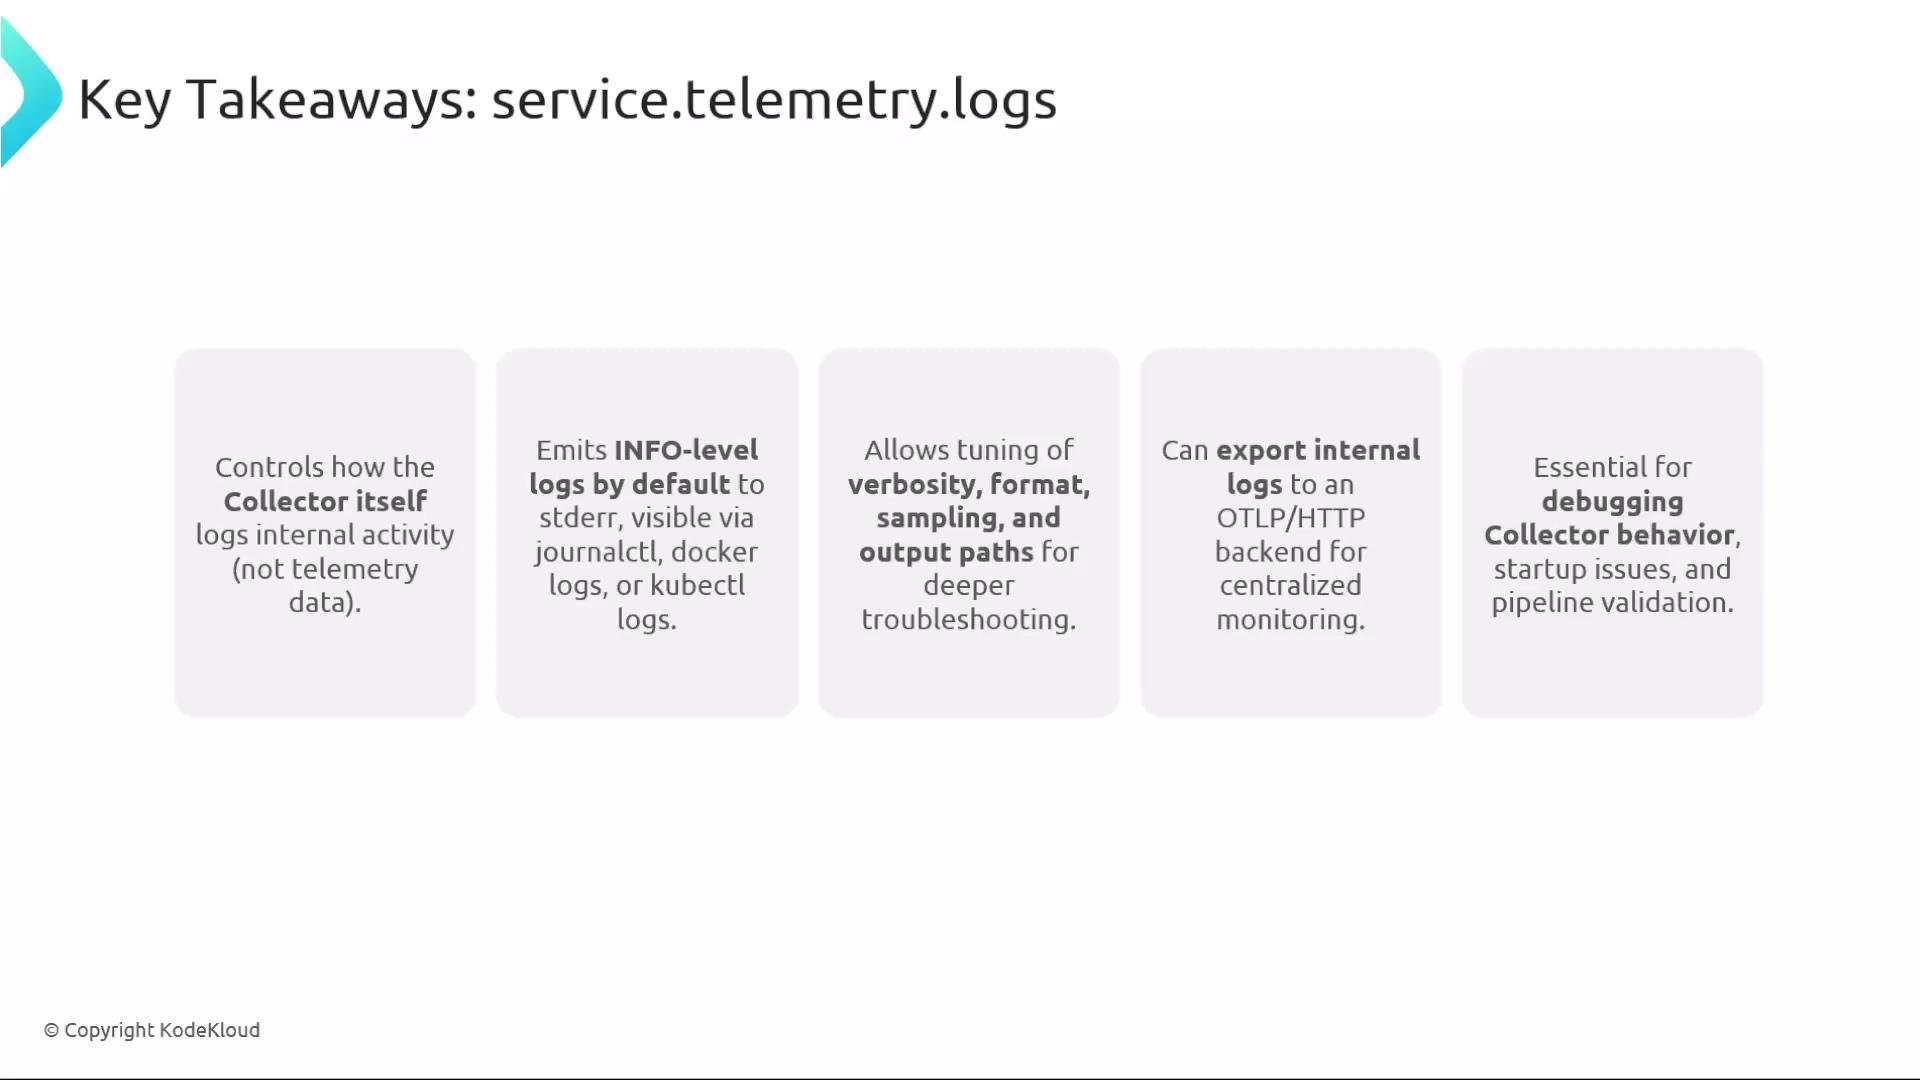
* `service.telemetry.logs.level` controls the Collector's internal log verbosity (this is separate from telemetry data you collect or export).
* By default, the Collector emits INFO-level logs to `stderr`.
* Use `journalctl`, `docker logs`, or `kubectl logs` to access Collector logs in common environments.
* Tune `level`, `encoding`, `sampling`, and `output_paths` to balance visibility and performance.
* Persist or forward internal logs to a centralized backend to aid cross-system troubleshooting and historical analysis.
## Structured logging and troubleshooting
When `encoding: json` is enabled, each log line is a JSON object which is much easier to ingest and query in centralized log systems. During debugging, keep `disable_stacktrace: false` and `disable_caller: false` to get file/line and stack traces for errors.
Example pipeline + telemetry configuration — ensure the `telemetry` block is nested under `service`:
```yaml theme={null}
receivers:
otlp:
protocols:
grpc:
http:
exporters:
debug:
verbosity: detailed # basic | normal | detailed
service:
pipelines:
traces:
receivers: [otlp]
exporters: [debug]
metrics:
receivers: [otlp]
exporters: [debug]
logs:
receivers: [otlp]
exporters: [debug]
telemetry:
logs:
level: "INFO" # DEBUG | INFO | WARN | ERROR
```
This setup validates pipelines and allows you to inspect telemetry data and internal Collector logs via the `debug` exporter.
## Quick references
Log level summary:
| Level | Purpose | When to use |
| ----- | -------------------------------------- | ----------------------------------------------- |
| DEBUG | Verbose, component-level messages | Development, deep troubleshooting |
| INFO | General operational messages (default) | Normal operations, startup checks |
| WARN | Warnings about potential issues | Restricted noise while still surfacing concerns |
| ERROR | Only errors | Production when you want minimal logs |
Commands to stream Collector logs (repeat):
| Platform | Example |
| ---------- | ---------------------------------------------------------------------------- |
| systemd | `sudo journalctl -u otelcol-contrib -f` |
| Docker | `docker logs -f otelcol` |
| Kubernetes | `kubectl logs -n observability \` + "``" + ` -c otel-collector -f` |
## Key takeaways
* `service.telemetry.logs.level` controls the Collector's internal log verbosity (this is separate from telemetry data you collect or export).
* By default, the Collector emits INFO-level logs to `stderr`.
* Use `journalctl`, `docker logs`, or `kubectl logs` to access Collector logs in common environments.
* Tune `level`, `encoding`, `sampling`, and `output_paths` to balance visibility and performance.
* Persist or forward internal logs to a centralized backend to aid cross-system troubleshooting and historical analysis.
 This is the first place to inspect when validating pipeline initialization or diagnosing why telemetry data is not reaching its backend. For more details, see the Collector documentation and the OpenTelemetry specifications:
* OpenTelemetry Collector: [https://opentelemetry.io/docs/collector/](https://opentelemetry.io/docs/collector/)
* Kubernetes logging: [https://kubernetes.io/docs/concepts/cluster-administration/logging/](https://kubernetes.io/docs/concepts/cluster-administration/logging/)
This is the first place to inspect when validating pipeline initialization or diagnosing why telemetry data is not reaching its backend. For more details, see the Collector documentation and the OpenTelemetry specifications:
* OpenTelemetry Collector: [https://opentelemetry.io/docs/collector/](https://opentelemetry.io/docs/collector/)
* Kubernetes logging: [https://kubernetes.io/docs/concepts/cluster-administration/logging/](https://kubernetes.io/docs/concepts/cluster-administration/logging/)