> ## Documentation Index
> Fetch the complete documentation index at: https://notes.kodekloud.com/llms.txt
> Use this file to discover all available pages before exploring further.
# Internal Metrics of the Collector
> Guide to OpenTelemetry Collector internal telemetry, exposing Prometheus metrics, health checks, zPages and pprof for diagnosing performance, resource issues, and troubleshooting pipelines.
In this lesson we continue the Collector diagnostics journey by focusing on internal telemetry. Telemetry logs show activities across the Collector, while internal metrics reveal how each component is performing over time. The OpenTelemetry Collector exposes built-in telemetry (Prometheus format) and several debugging extensions for deeper inspection. Together, these signals provide a clear view of Collector health, performance, and where to investigate when things go wrong.
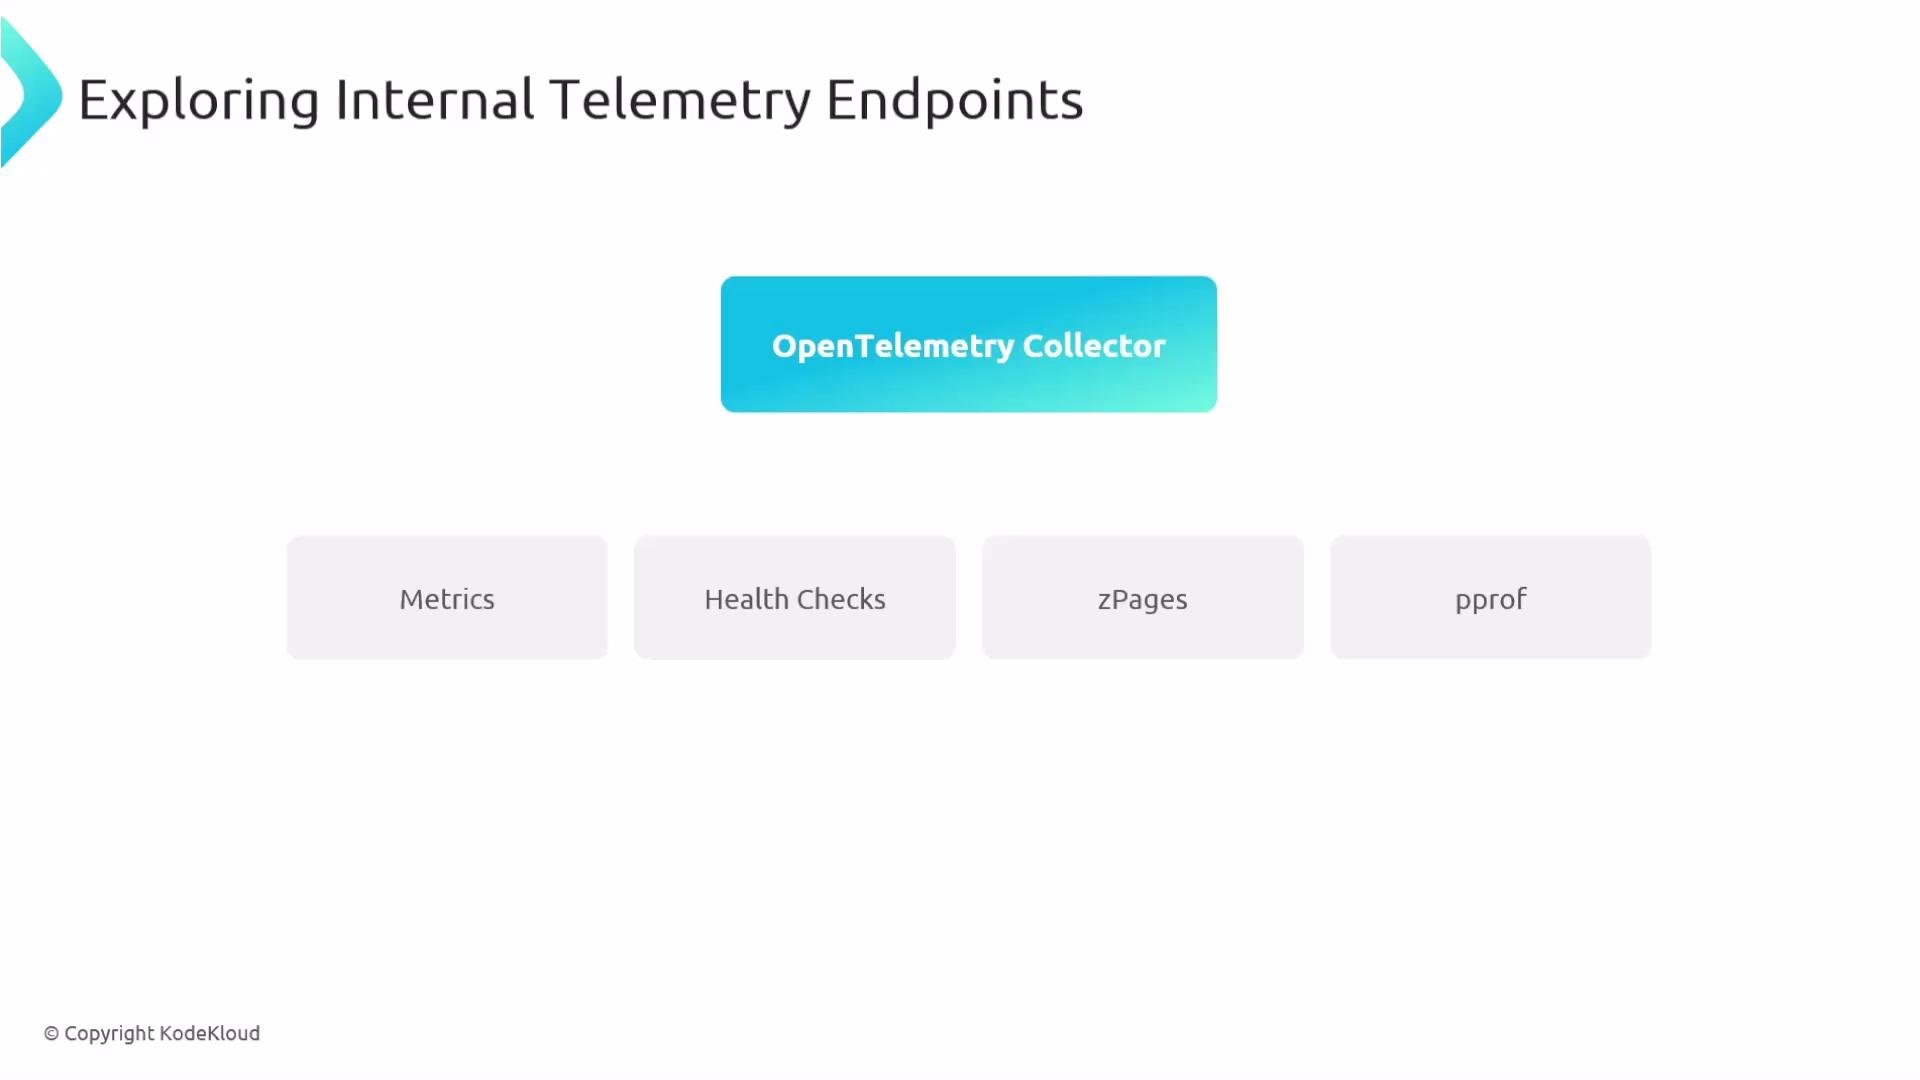
Key diagnostic tools and endpoints:
* Internal metrics (Prometheus format) for runtime visibility and alerting.
* Health checks to confirm the Collector is up and ready.
* zPages to inspect live traces, spans, and internal workings of receivers and exporters.
* Performance profiler (pprof) for detailed CPU and memory profiling.
pprof is an advanced diagnostic tool used for deep performance investigations. It’s usually not necessary for routine troubleshooting.
 Why these endpoints matter
* Metrics let you quantify throughput, error rates, drops, and resource pressure.
* Health checks give a quick boolean of liveness/readiness.
* zPages provide an interactive look at pipeline internals without stopping the Collector.
* pprof helps find hotspots, memory leaks, and expensive code paths.
Tool summary
| Diagnostic tool | Purpose | Where to learn more |
| ----------------------------- | ------------------------------------------------------------------ | ------------------------------------ |
| Internal metrics (Prometheus) | Monitor pipeline throughput, failures, queue sizes, resource usage | [Prometheus](https://prometheus.io/) |
| Health checks | Liveness/readiness probes for orchestration platforms | Collector docs |
| zPages | Live inspection of receivers/exporters and internal spans | zPages extension |
| pprof | CPU/memory profiling for deep performance analysis | `net/http/pprof` docs |
Important: Do not expose Collector telemetry endpoints (metrics, pprof, zPages, health) to the public internet. Restrict access with network controls, authentication, or internal-only interfaces.
How the Collector exposes internal metrics
By default many Collector setups expose internal metrics on port 8888 via a Prometheus pull-style reader. Example telemetry configuration:
```yaml theme={null}
service:
telemetry:
metrics:
readers:
- pull:
exporter:
prometheus:
host: "0.0.0.0"
port: 8888
```
You can change the port or binding as needed to fit your deployment model. The metrics are available at `http://:8888/metrics` (or the host/port you configure).
What these metrics reveal
Internal metrics provide insights into:
* Pipeline health and stability
* Throughput for receivers, processors, and exporters
* Performance hotspots and bottlenecks
* Backpressure and queue growth indicating possible drops
* Resource pressure (CPU, memory) and potential leaks
* Which components are loaded and their versions (metadata)
Why these endpoints matter
* Metrics let you quantify throughput, error rates, drops, and resource pressure.
* Health checks give a quick boolean of liveness/readiness.
* zPages provide an interactive look at pipeline internals without stopping the Collector.
* pprof helps find hotspots, memory leaks, and expensive code paths.
Tool summary
| Diagnostic tool | Purpose | Where to learn more |
| ----------------------------- | ------------------------------------------------------------------ | ------------------------------------ |
| Internal metrics (Prometheus) | Monitor pipeline throughput, failures, queue sizes, resource usage | [Prometheus](https://prometheus.io/) |
| Health checks | Liveness/readiness probes for orchestration platforms | Collector docs |
| zPages | Live inspection of receivers/exporters and internal spans | zPages extension |
| pprof | CPU/memory profiling for deep performance analysis | `net/http/pprof` docs |
Important: Do not expose Collector telemetry endpoints (metrics, pprof, zPages, health) to the public internet. Restrict access with network controls, authentication, or internal-only interfaces.
How the Collector exposes internal metrics
By default many Collector setups expose internal metrics on port 8888 via a Prometheus pull-style reader. Example telemetry configuration:
```yaml theme={null}
service:
telemetry:
metrics:
readers:
- pull:
exporter:
prometheus:
host: "0.0.0.0"
port: 8888
```
You can change the port or binding as needed to fit your deployment model. The metrics are available at `http://:8888/metrics` (or the host/port you configure).
What these metrics reveal
Internal metrics provide insights into:
* Pipeline health and stability
* Throughput for receivers, processors, and exporters
* Performance hotspots and bottlenecks
* Backpressure and queue growth indicating possible drops
* Resource pressure (CPU, memory) and potential leaks
* Which components are loaded and their versions (metadata)
 Naming pattern overview
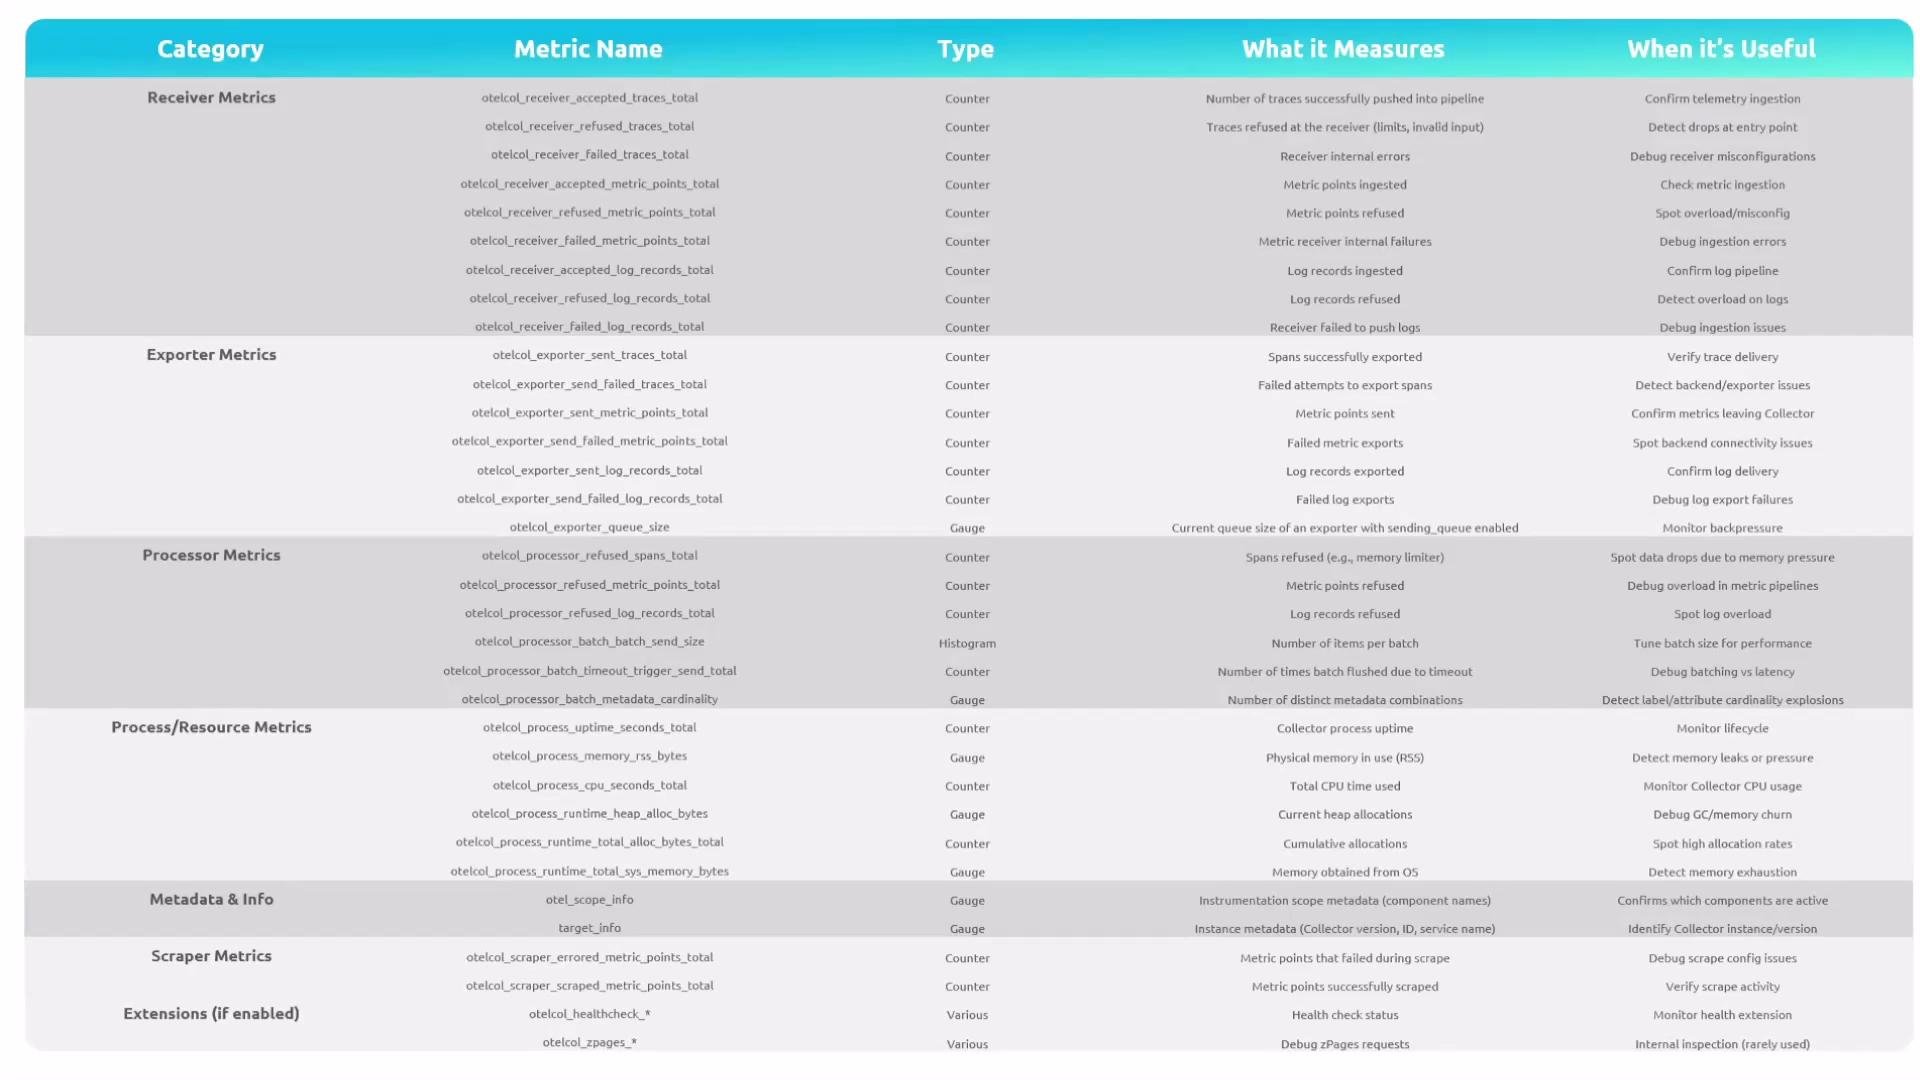
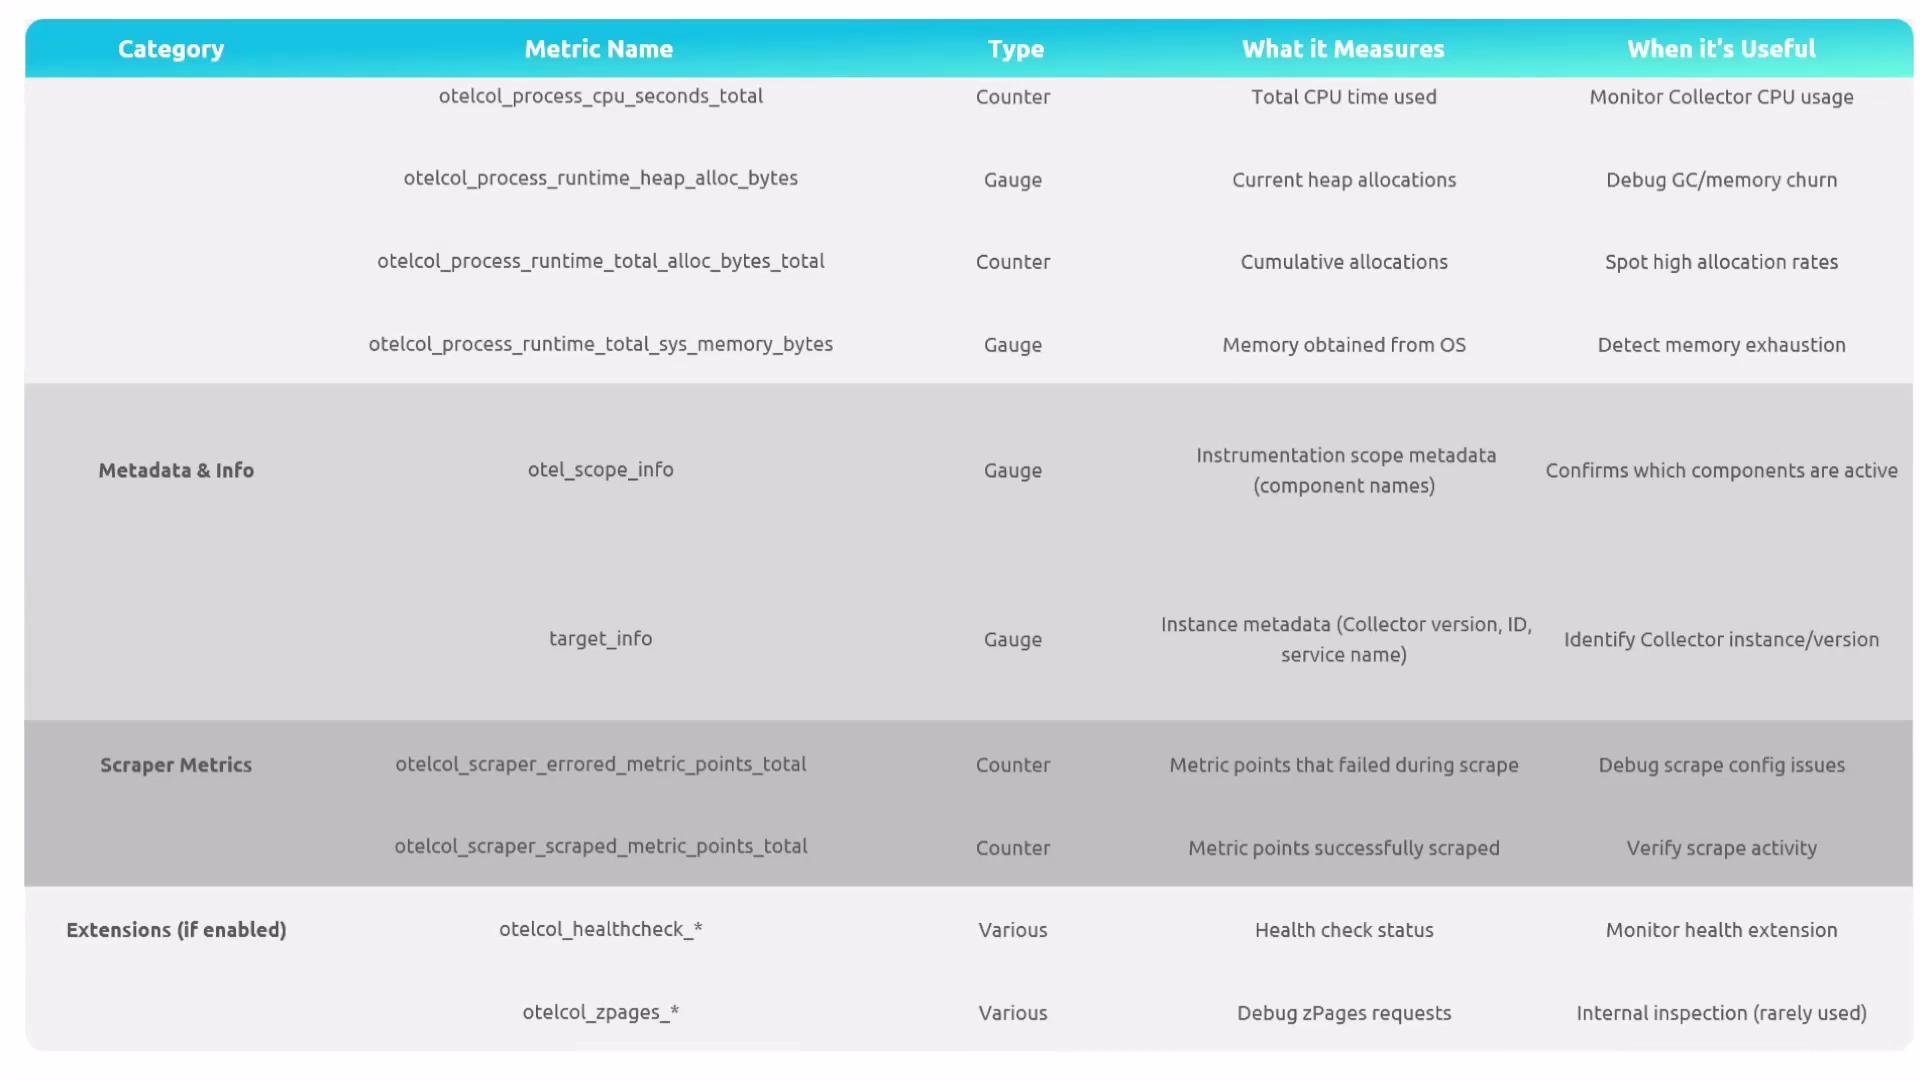
Metrics follow a consistent, readable pattern. Parse names logically rather than memorizing them.
* Prefix: `otelcol_` — indicates the metric is from the OpenTelemetry Collector.
* Component: `receiver`, `exporter`, `processor`, `extension`, etc.
* Signal (optional): `traces`, `metrics`, `logs`.
* Suffix: e.g., `_total` for counters, `_bytes`, `_duration_seconds`.
Common examples and what to look for
* Receiver activity: `otelcol_receiver_accepted_traces_total` — incoming traffic accepted by receivers.
* Refused/Rejected metrics: `otelcol_receiver_refused_traces_total` — indicates drops due to limits or malformed inputs.
* Exporter success/failure: `otelcol_exporter_sent_spans_total`, `otelcol_exporter_send_failed_spans_total` — failures often mean connectivity/backend issues.
* Queue/Buffer metrics: queue size growth suggests backpressure or downstream slowness.
* Processor metrics: batch sizes and timeout metrics help tune throughput vs. latency.
* Process/resource metrics: CPU, memory, heap allocations (`process_cpu_seconds_total`, memory-related metrics) show resource pressure.
* Metadata metrics: `otel_scope_info` and similar indicate active components and versions.
Naming pattern overview
Metrics follow a consistent, readable pattern. Parse names logically rather than memorizing them.
* Prefix: `otelcol_` — indicates the metric is from the OpenTelemetry Collector.
* Component: `receiver`, `exporter`, `processor`, `extension`, etc.
* Signal (optional): `traces`, `metrics`, `logs`.
* Suffix: e.g., `_total` for counters, `_bytes`, `_duration_seconds`.
Common examples and what to look for
* Receiver activity: `otelcol_receiver_accepted_traces_total` — incoming traffic accepted by receivers.
* Refused/Rejected metrics: `otelcol_receiver_refused_traces_total` — indicates drops due to limits or malformed inputs.
* Exporter success/failure: `otelcol_exporter_sent_spans_total`, `otelcol_exporter_send_failed_spans_total` — failures often mean connectivity/backend issues.
* Queue/Buffer metrics: queue size growth suggests backpressure or downstream slowness.
* Processor metrics: batch sizes and timeout metrics help tune throughput vs. latency.
* Process/resource metrics: CPU, memory, heap allocations (`process_cpu_seconds_total`, memory-related metrics) show resource pressure.
* Metadata metrics: `otel_scope_info` and similar indicate active components and versions.
 Example: Prometheus-format metrics output
Here is a sample of metrics as exposed by the Collector (available at `http://:8888/metrics` when using the example config above):
```text theme={null}
# HELP otel_scope_info Instrumentation Scope metadata
# TYPE otel_scope_info gauge
otel_scope_info{otel_scope_name="go.opentelemetry.io/collector/exporter/exporterhelper",otel_scope_version=""} 1
otel_scope_info{otel_scope_name="go.opentelemetry.io/collector/processor/batchprocessor",otel_scope_version=""} 1
otel_scope_info{otel_scope_name="go.opentelemetry.io/collector/receiver/receiverhelper",otel_scope_version=""} 1
otel_scope_info{otel_scope_name="go.opentelemetry.io/collector/service",otel_scope_version=""} 1
# HELP otelcol_exporter_send_failed_log_records_total Number of log records in failed attempts to send to destination. [alpha]
# TYPE otelcol_exporter_send_failed_log_records_total counter
otelcol_exporter_send_failed_log_records_total{exporter="debug",otel_scope_name="go.opentelemetry.io/collector/exporter/exporterhelper",otel_scope_version=""} 0
# HELP otelcol_exporter_send_failed_metric_points_total Number of metric points in failed attempts to send to destination. [alpha]
# TYPE otelcol_exporter_send_failed_metric_points_total counter
otelcol_exporter_send_failed_metric_points_total{exporter="debug",otel_scope_name="go.opentelemetry.io/collector/exporter/exporterhelper",otel_scope_version=""} 0
# HELP otelcol_exporter_send_failed_spans_total Number of spans in failed attempts to send to destination. [alpha]
# TYPE otelcol_exporter_send_failed_spans_total counter
otelcol_exporter_send_failed_spans_total{exporter="debug",otel_scope_name="go.opentelemetry.io/collector/exporter/exporterhelper",otel_scope_version=""} 0
# HELP otelcol_exporter_sent_log_records_total Number of log records successfully sent to destination. [alpha]
# TYPE otelcol_exporter_sent_log_records_total counter
otelcol_exporter_sent_log_records_total{exporter="debug",otel_scope_name="go.opentelemetry.io/collector/exporter/exporterhelper",otel_scope_version=""} 42
```
Scraping and forward-ing
* Scrape with Prometheus or any compatible scrape-based monitoring system.
* The Collector can also ingest its own metrics and forward them to any supported backend for dashboards, alerts, and long-term analysis.
Troubleshooting approach (quick checklist)
* Check receiver accepted/refused counters for ingestion issues.
* Inspect exporter send failures to identify backend problems.
* Monitor queue size and processor metrics for backpressure.
* Correlate process CPU/memory metrics with spikes in refused or failed counts.
* Use zPages for quick, live introspection; use pprof for deep performance profiling.
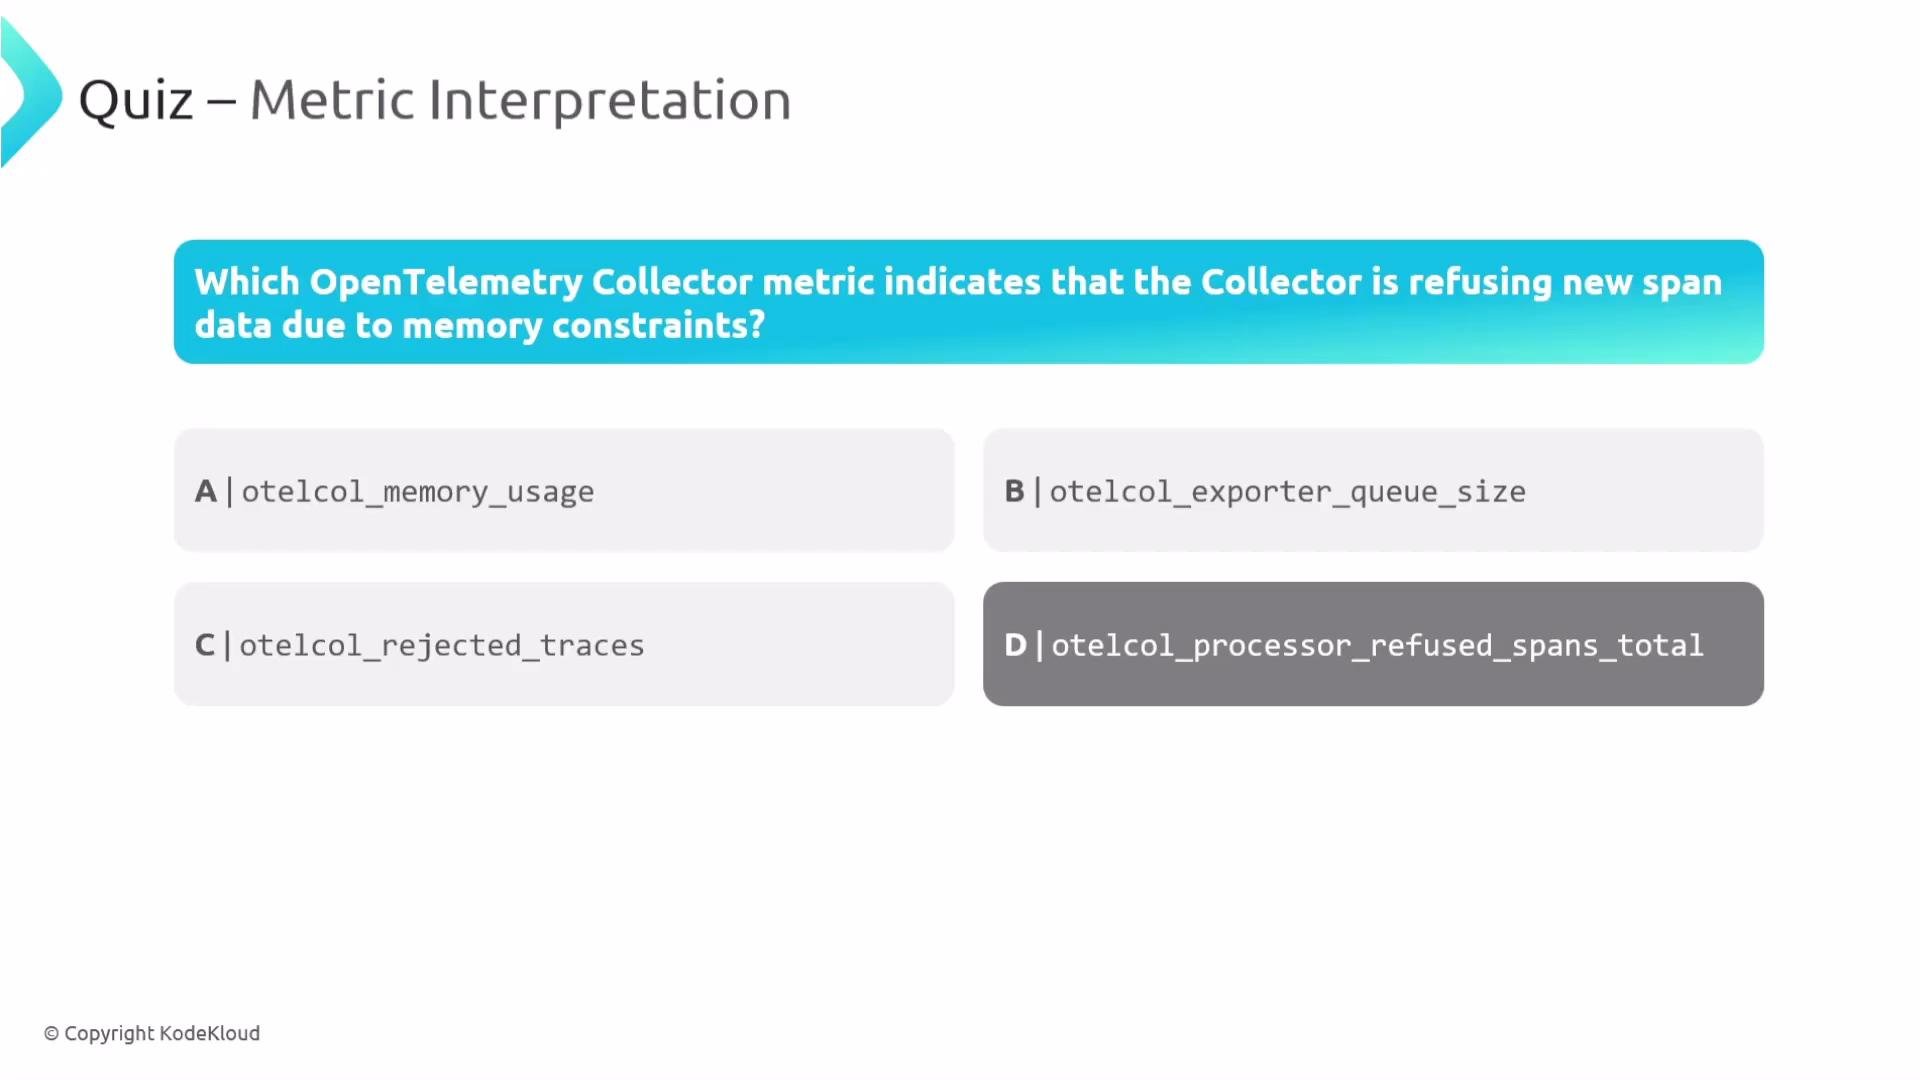
Quiz: which OpenTelemetry Collector metric indicates that the Collector is refusing new span data due to memory constraints?
* A. Memory usage
* B. Exported queue size
* C. Rejected traces
* D. otelcol\_processor\_refused\_spans\_total
Example: Prometheus-format metrics output
Here is a sample of metrics as exposed by the Collector (available at `http://:8888/metrics` when using the example config above):
```text theme={null}
# HELP otel_scope_info Instrumentation Scope metadata
# TYPE otel_scope_info gauge
otel_scope_info{otel_scope_name="go.opentelemetry.io/collector/exporter/exporterhelper",otel_scope_version=""} 1
otel_scope_info{otel_scope_name="go.opentelemetry.io/collector/processor/batchprocessor",otel_scope_version=""} 1
otel_scope_info{otel_scope_name="go.opentelemetry.io/collector/receiver/receiverhelper",otel_scope_version=""} 1
otel_scope_info{otel_scope_name="go.opentelemetry.io/collector/service",otel_scope_version=""} 1
# HELP otelcol_exporter_send_failed_log_records_total Number of log records in failed attempts to send to destination. [alpha]
# TYPE otelcol_exporter_send_failed_log_records_total counter
otelcol_exporter_send_failed_log_records_total{exporter="debug",otel_scope_name="go.opentelemetry.io/collector/exporter/exporterhelper",otel_scope_version=""} 0
# HELP otelcol_exporter_send_failed_metric_points_total Number of metric points in failed attempts to send to destination. [alpha]
# TYPE otelcol_exporter_send_failed_metric_points_total counter
otelcol_exporter_send_failed_metric_points_total{exporter="debug",otel_scope_name="go.opentelemetry.io/collector/exporter/exporterhelper",otel_scope_version=""} 0
# HELP otelcol_exporter_send_failed_spans_total Number of spans in failed attempts to send to destination. [alpha]
# TYPE otelcol_exporter_send_failed_spans_total counter
otelcol_exporter_send_failed_spans_total{exporter="debug",otel_scope_name="go.opentelemetry.io/collector/exporter/exporterhelper",otel_scope_version=""} 0
# HELP otelcol_exporter_sent_log_records_total Number of log records successfully sent to destination. [alpha]
# TYPE otelcol_exporter_sent_log_records_total counter
otelcol_exporter_sent_log_records_total{exporter="debug",otel_scope_name="go.opentelemetry.io/collector/exporter/exporterhelper",otel_scope_version=""} 42
```
Scraping and forward-ing
* Scrape with Prometheus or any compatible scrape-based monitoring system.
* The Collector can also ingest its own metrics and forward them to any supported backend for dashboards, alerts, and long-term analysis.
Troubleshooting approach (quick checklist)
* Check receiver accepted/refused counters for ingestion issues.
* Inspect exporter send failures to identify backend problems.
* Monitor queue size and processor metrics for backpressure.
* Correlate process CPU/memory metrics with spikes in refused or failed counts.
* Use zPages for quick, live introspection; use pprof for deep performance profiling.
Quiz: which OpenTelemetry Collector metric indicates that the Collector is refusing new span data due to memory constraints?
* A. Memory usage
* B. Exported queue size
* C. Rejected traces
* D. otelcol\_processor\_refused\_spans\_total
 Answer explanation
* The phrasing "refusing new span data" maps directly to a refused-spans metric. The metric `otelcol_processor_refused_spans_total` explicitly records spans that were refused by a processor (for example, because of memory pressure or configured dropping rules). Parse metric names logically: component → action → signal.
Takeaway
* Focus on the consistent naming pattern: `otelcol____`.
* Use metrics to pinpoint where the problem lies (receivers, processors, exporters, or resource exhaustion) and then apply targeted debugging (zPages, logs, pprof) as needed.
Links and references
* [OpenTelemetry Collector docs](https://opentelemetry.io/docs/collector/)
* [Prometheus documentation](https://prometheus.io/)
* [zPages extension repo](https://github.com/open-telemetry/opentelemetry-collector/tree/main/extension/zpages)
* [pprof (net/http/pprof)](https://pkg.go.dev/net/http/pprof)
Answer explanation
* The phrasing "refusing new span data" maps directly to a refused-spans metric. The metric `otelcol_processor_refused_spans_total` explicitly records spans that were refused by a processor (for example, because of memory pressure or configured dropping rules). Parse metric names logically: component → action → signal.
Takeaway
* Focus on the consistent naming pattern: `otelcol____`.
* Use metrics to pinpoint where the problem lies (receivers, processors, exporters, or resource exhaustion) and then apply targeted debugging (zPages, logs, pprof) as needed.
Links and references
* [OpenTelemetry Collector docs](https://opentelemetry.io/docs/collector/)
* [Prometheus documentation](https://prometheus.io/)
* [zPages extension repo](https://github.com/open-telemetry/opentelemetry-collector/tree/main/extension/zpages)
* [pprof (net/http/pprof)](https://pkg.go.dev/net/http/pprof)