> ## Documentation Index
> Fetch the complete documentation index at: https://notes.kodekloud.com/llms.txt
> Use this file to discover all available pages before exploring further.
# Recap When to Use What
> Overview of OpenTelemetry Collector diagnostic endpoints and when to use metrics, health checks, zPages, and pprof for operational visibility and performance troubleshooting
Quickly review the diagnostic endpoints built into the OpenTelemetry Collector and when to use each. These tools help with operational visibility, orchestration readiness, live component inspection, and deep runtime profiling.
We have four main endpoints for troubleshooting the Collector:
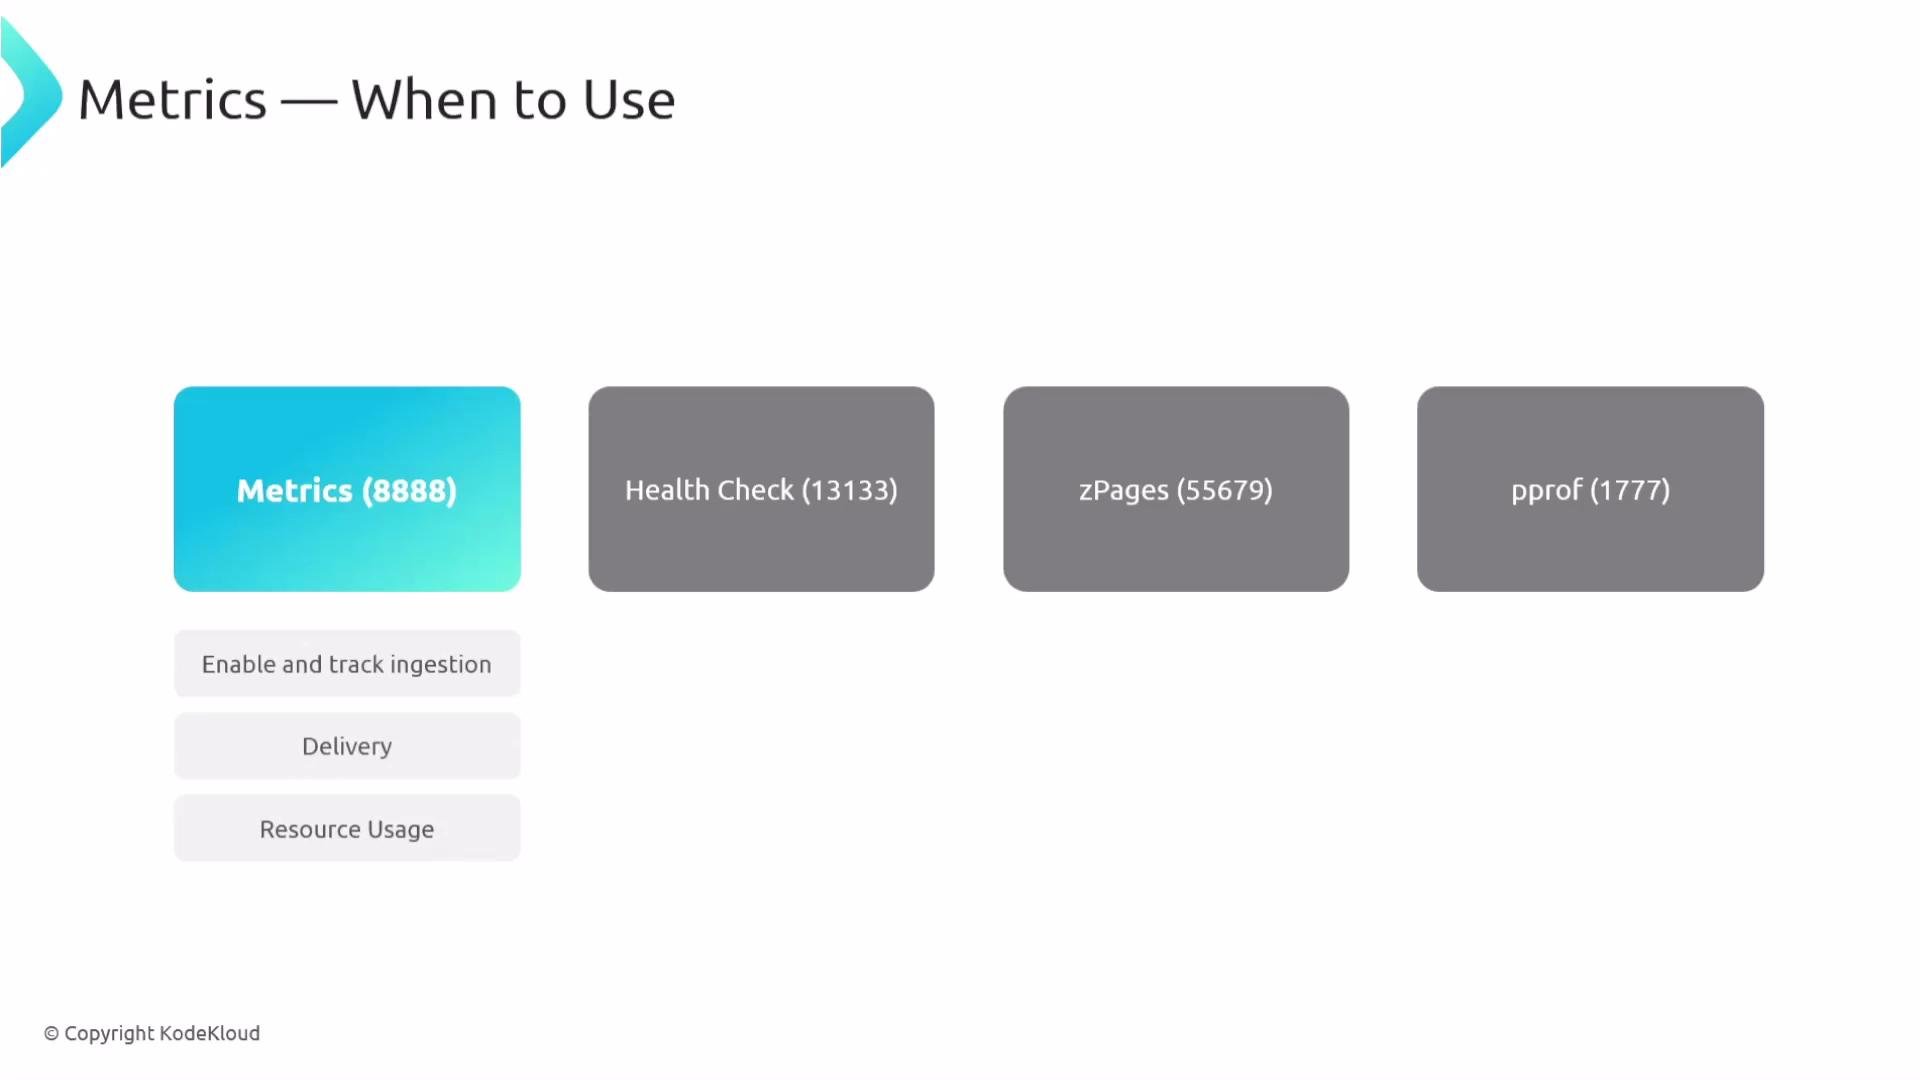
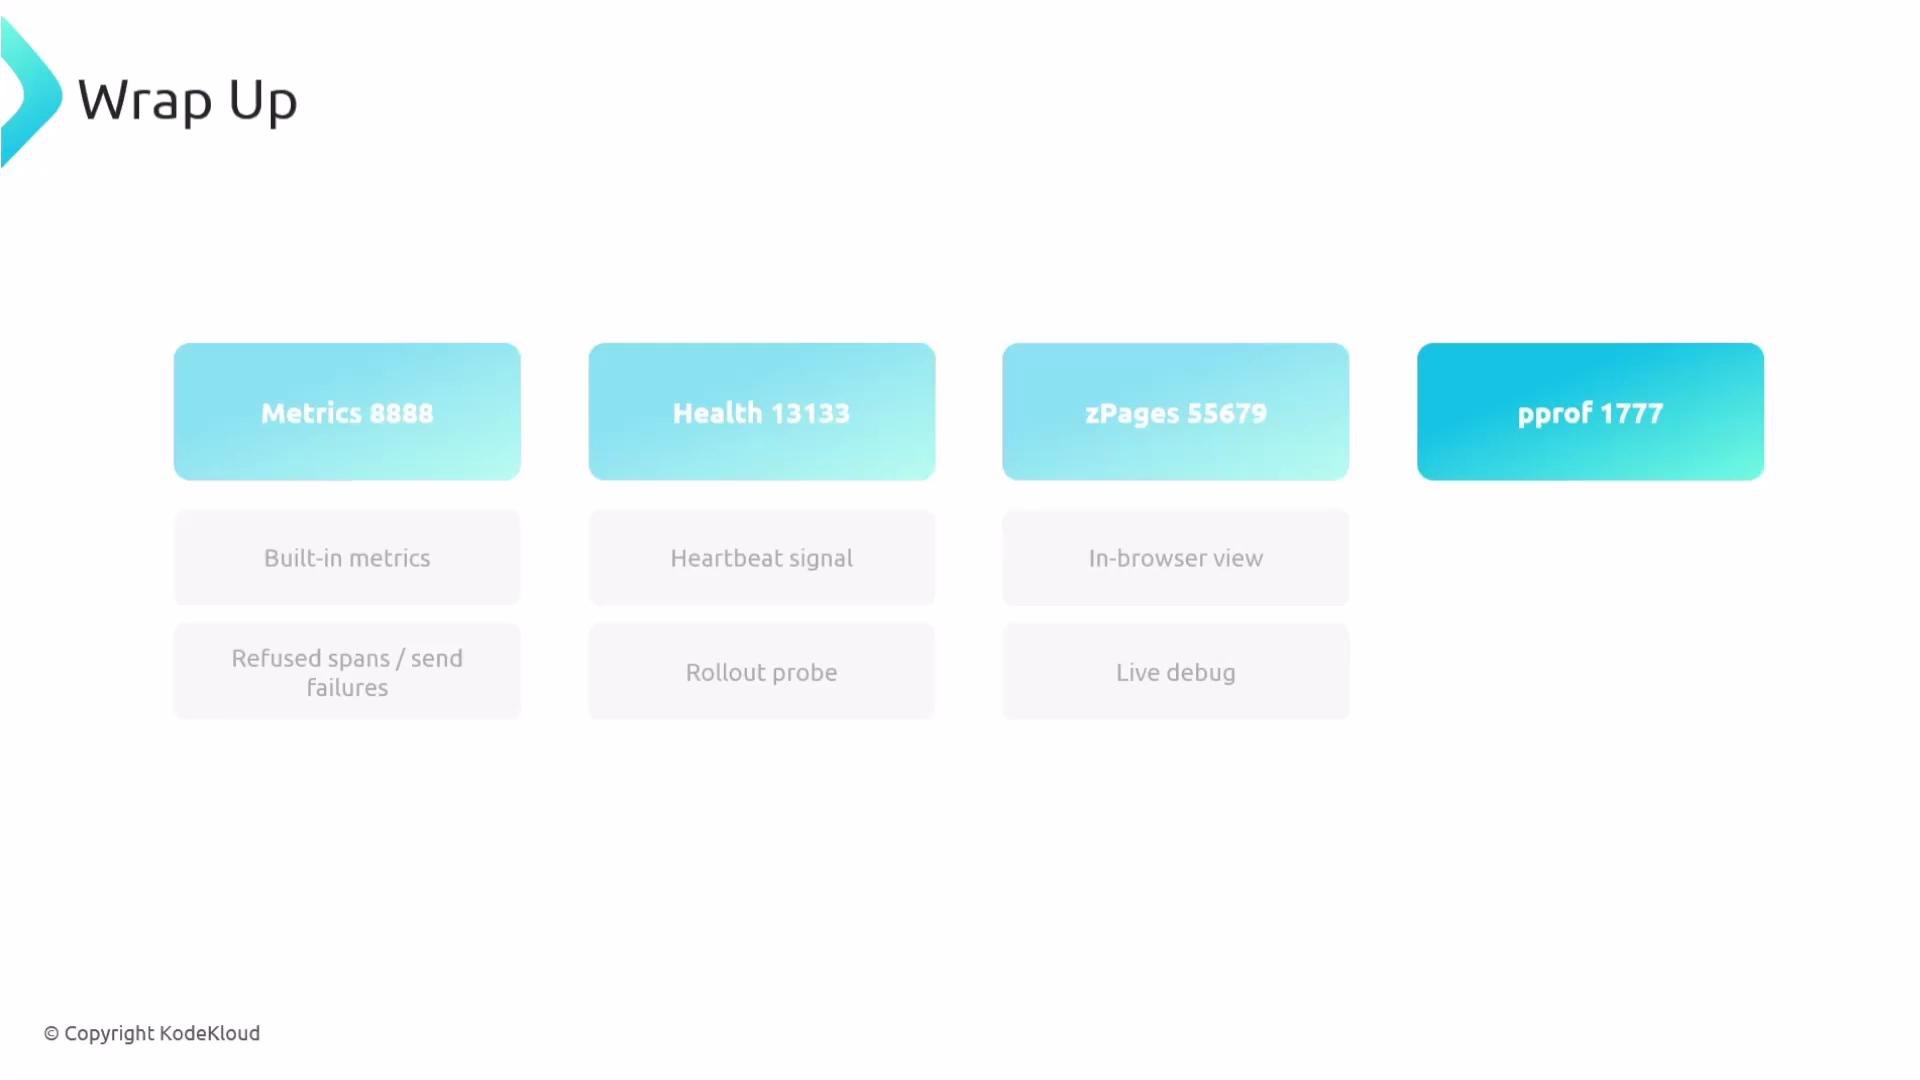
* Metrics: operational visibility and ingestion verification.
* Health check: simple heartbeat for orchestration Liveness/Readiness checks.
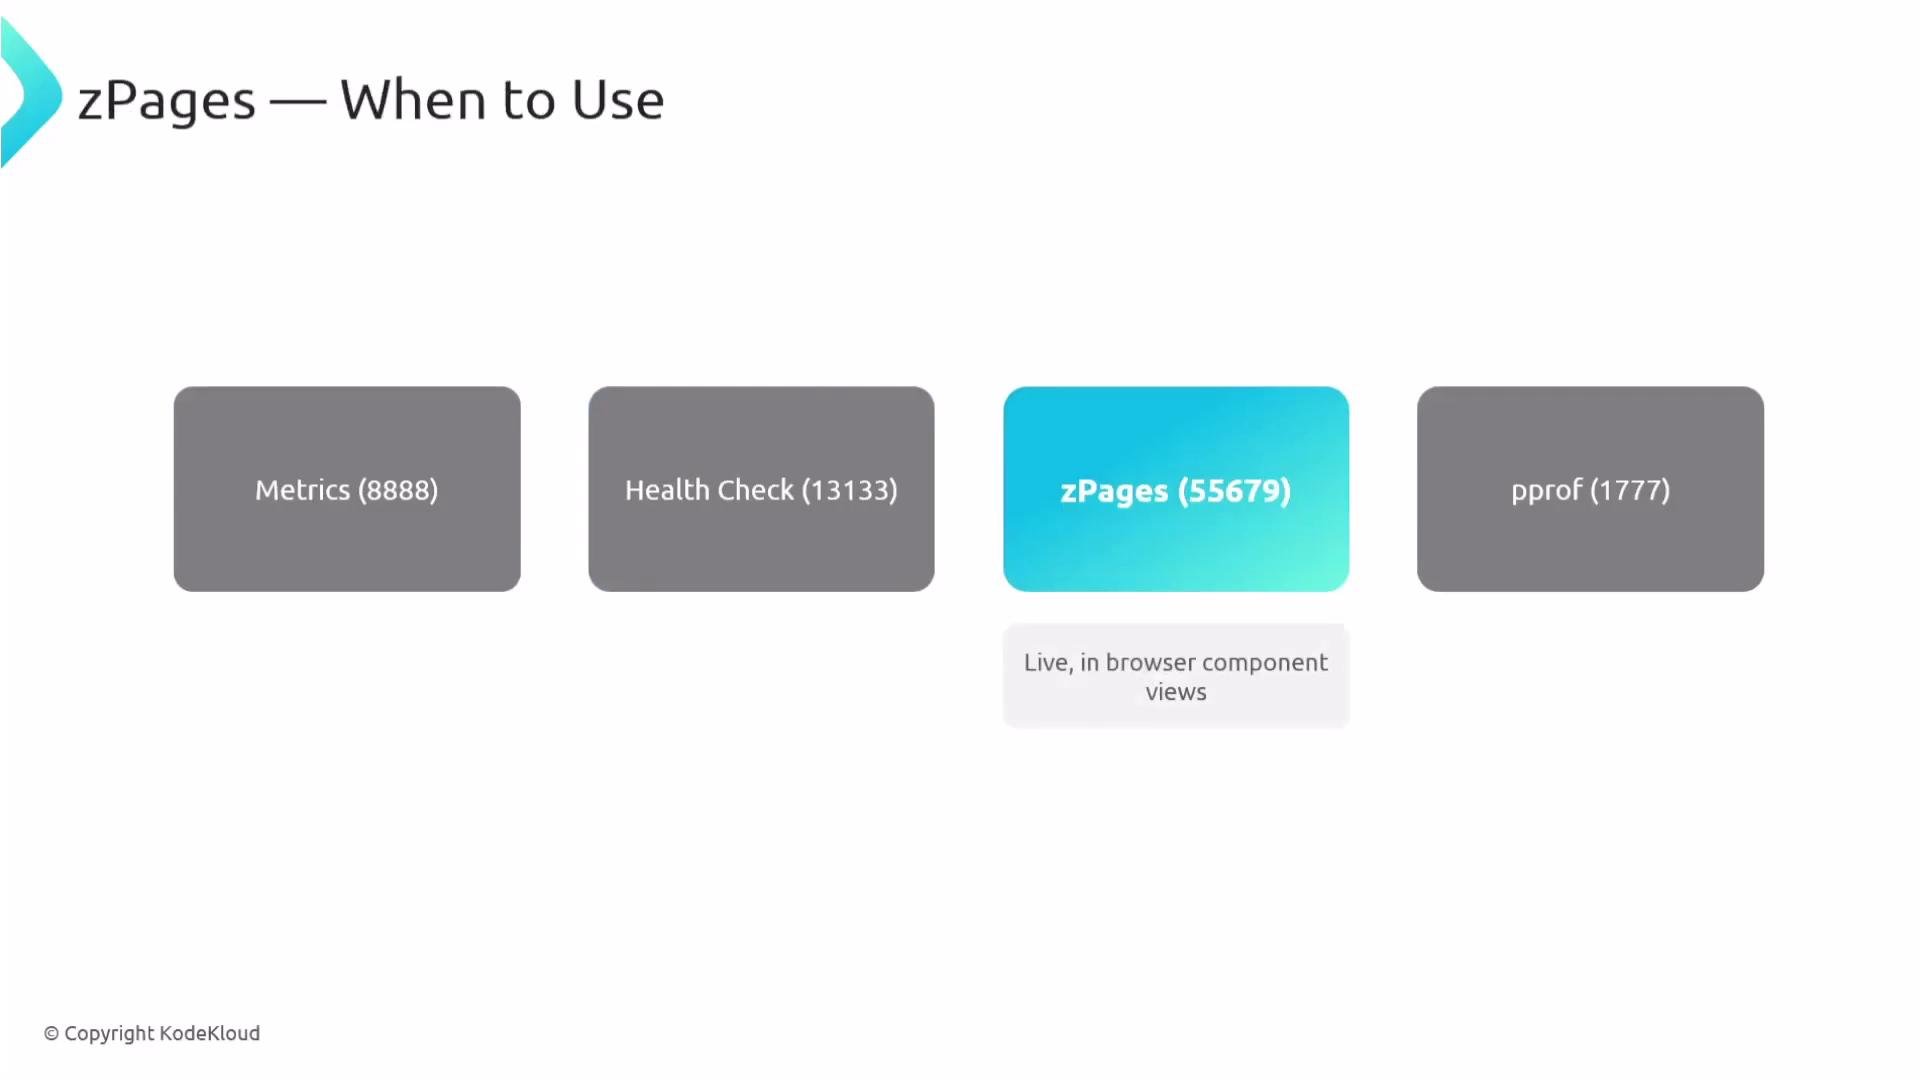
* zPages: live, in-browser component views for interactive debugging.
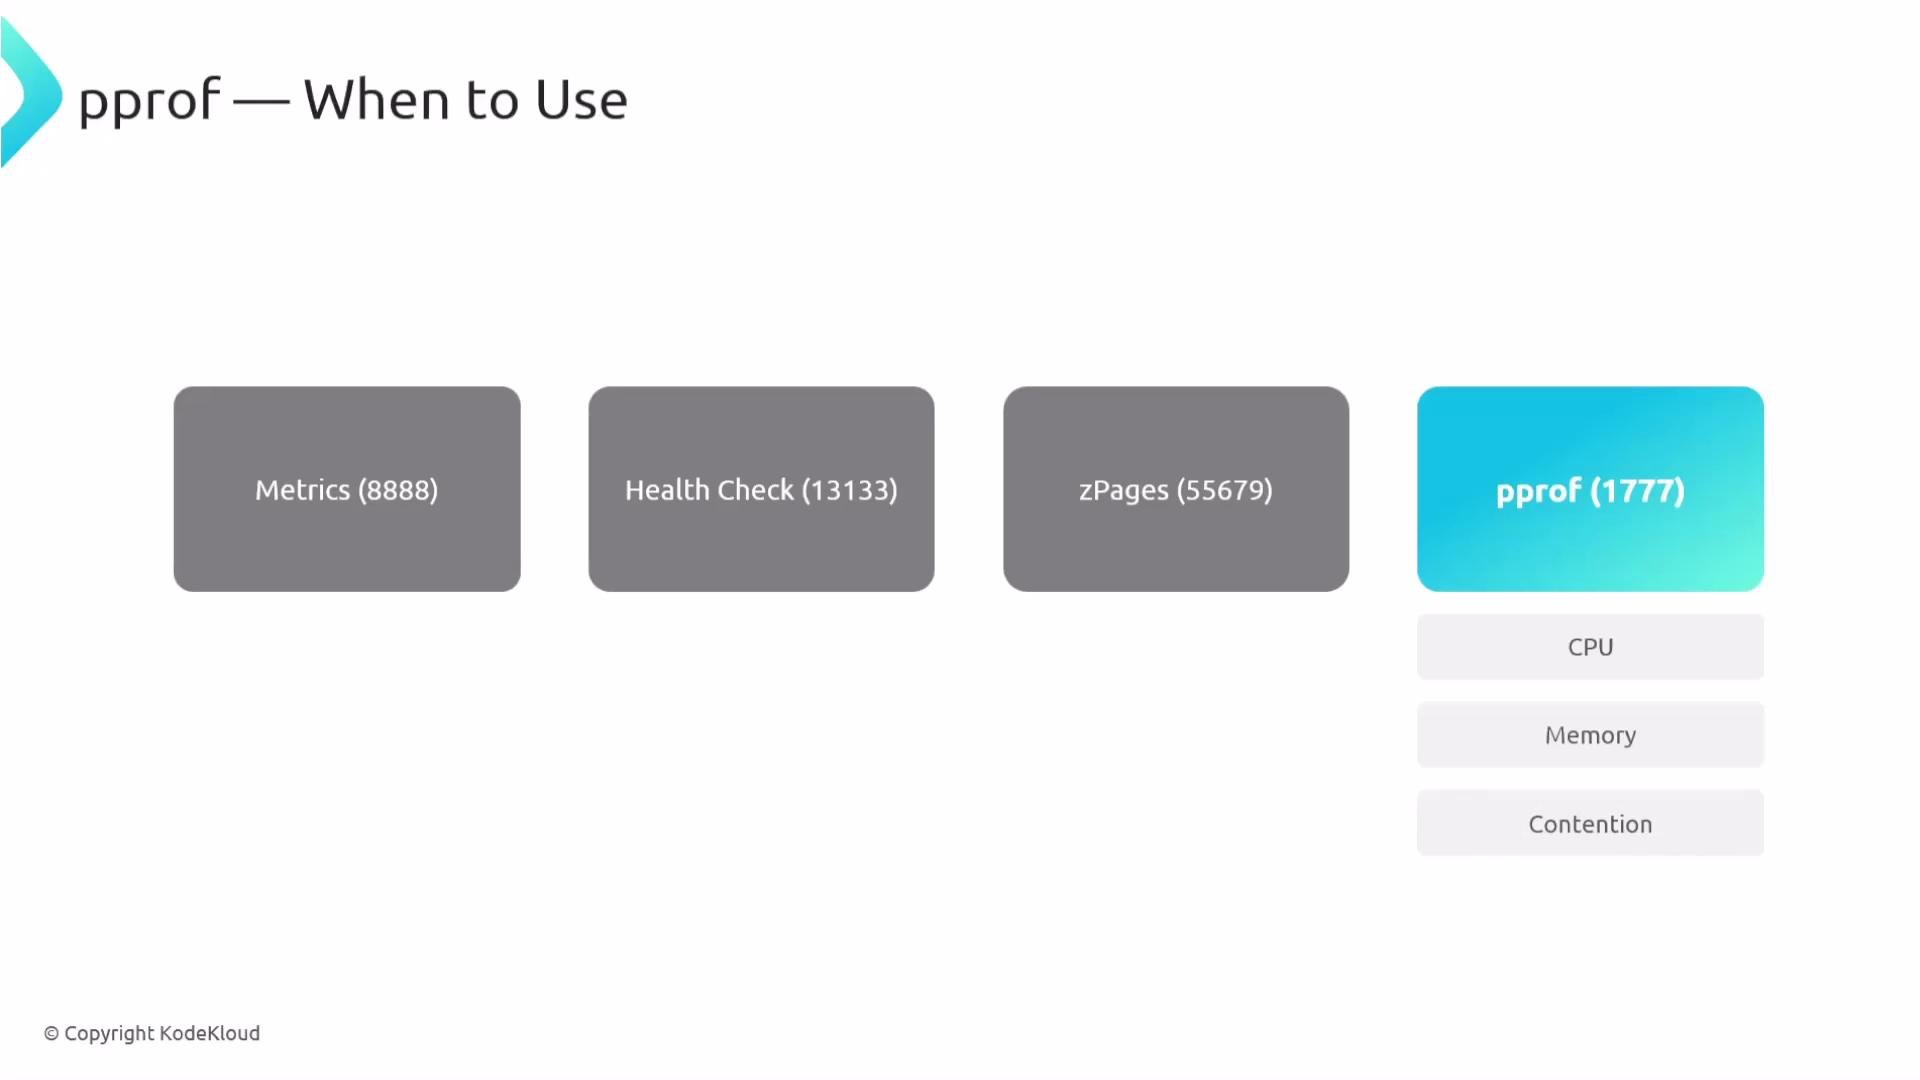
* pprof: advanced Go runtime profiles (CPU, memory, contention).
Metrics validate that data is being received and delivered to backends. They reveal ingestion/delivery patterns and surface internal resource usage trends inside the Collector.
 Health check endpoints are primarily for orchestration systems (Kubernetes, Nomad, etc.). Use them during rollouts, restarts, or whenever the orchestrator needs a simple OK/Not-OK probe to manage lifecycle operations.
zPages provides quick, live, in-browser views of what Collector components are doing. Use zPages for hands-on troubleshooting when you want to inspect component internals without attaching debuggers or altering configuration.
Health check endpoints are primarily for orchestration systems (Kubernetes, Nomad, etc.). Use them during rollouts, restarts, or whenever the orchestrator needs a simple OK/Not-OK probe to manage lifecycle operations.
zPages provides quick, live, in-browser views of what Collector components are doing. Use zPages for hands-on troubleshooting when you want to inspect component internals without attaching debuggers or altering configuration.
 pprof is for advanced investigations: capture CPU profiles, inspect heap allocations, and analyze mutex contention. Use pprof when you suspect performance bottlenecks or need to profile under realistic load.
 Below is a concise example Collector configuration showing where to enable these diagnostic extensions and how to expose the Collector’s own Prometheus metrics for scraping. Note that metrics are configured under `service.telemetry.metrics`, while health check, pprof, and zPages are configured as extensions and then referenced under `service.extensions`.
```yaml theme={null}
extensions:
health_check:
endpoint: "0.0.0.0:13133" # GET http://localhost:13133/ -> 200 OK when healthy
pprof:
endpoint: "0.0.0.0:1777" # http://localhost:1777/debug/pprof/
zpages:
endpoint: "0.0.0.0:55679" # http://localhost:55679/debug/servicez/
receivers:
otlp:
protocols:
http:
endpoint: "0.0.0.0:4318" # matches your load generator defaults
processors:
batch: {}
exporters:
debug:
verbosity: detailed # if this errors in your build, use: debug: {}
service:
telemetry:
metrics:
# optional level: basic | normal | detailed
level: normal
readers:
- pull:
exporter:
prometheus:
host: "0.0.0.0"
port: 8888 # Prometheus scrape at http://localhost:8888/metrics
extensions: [health_check, pprof, zpages]
pipelines:
traces:
receivers: [otlp]
processors: [batch]
exporters: [debug]
```
pprof is powerful but advanced. Use it when you need CPU or memory profiles to diagnose performance bottlenecks. For day-to-day checks, rely on metrics, health checks, and zPages.
Below is a quick reference table for these endpoints and when to use them:
| Endpoint | Port | Purpose | Typical Use |
| -----------: | :-----: | ---------------------------------------------- | ---------------------------------------------------------------- |
| Metrics | `8888` | Prometheus-compatible operational metrics | Validate ingestion and delivery patterns; monitor resource usage |
| Health check | `13133` | Liveness/readiness heartbeat | Orchestration probes during rollouts and restarts |
| zPages | `55679` | In-browser component insights | Live troubleshooting of component internals without a debugger |
| pprof | `1777` | Go runtime profiling (CPU, memory, contention) | Deep performance analysis under load |
Links and references:
* OpenTelemetry Collector diagnostics overview (conceptual)
* Advanced Golang profiling: [https://learn.kodekloud.com/user/courses/advanced-golang](https://learn.kodekloud.com/user/courses/advanced-golang)
* Prometheus basics and scraping: [https://learn.kodekloud.com/user/courses/prep-course-prometheus-certified-associate-pca-certification](https://learn.kodekloud.com/user/courses/prep-course-prometheus-certified-associate-pca-certification)
Below is a concise example Collector configuration showing where to enable these diagnostic extensions and how to expose the Collector’s own Prometheus metrics for scraping. Note that metrics are configured under `service.telemetry.metrics`, while health check, pprof, and zPages are configured as extensions and then referenced under `service.extensions`.
```yaml theme={null}
extensions:
health_check:
endpoint: "0.0.0.0:13133" # GET http://localhost:13133/ -> 200 OK when healthy
pprof:
endpoint: "0.0.0.0:1777" # http://localhost:1777/debug/pprof/
zpages:
endpoint: "0.0.0.0:55679" # http://localhost:55679/debug/servicez/
receivers:
otlp:
protocols:
http:
endpoint: "0.0.0.0:4318" # matches your load generator defaults
processors:
batch: {}
exporters:
debug:
verbosity: detailed # if this errors in your build, use: debug: {}
service:
telemetry:
metrics:
# optional level: basic | normal | detailed
level: normal
readers:
- pull:
exporter:
prometheus:
host: "0.0.0.0"
port: 8888 # Prometheus scrape at http://localhost:8888/metrics
extensions: [health_check, pprof, zpages]
pipelines:
traces:
receivers: [otlp]
processors: [batch]
exporters: [debug]
```
pprof is powerful but advanced. Use it when you need CPU or memory profiles to diagnose performance bottlenecks. For day-to-day checks, rely on metrics, health checks, and zPages.
Below is a quick reference table for these endpoints and when to use them:
| Endpoint | Port | Purpose | Typical Use |
| -----------: | :-----: | ---------------------------------------------- | ---------------------------------------------------------------- |
| Metrics | `8888` | Prometheus-compatible operational metrics | Validate ingestion and delivery patterns; monitor resource usage |
| Health check | `13133` | Liveness/readiness heartbeat | Orchestration probes during rollouts and restarts |
| zPages | `55679` | In-browser component insights | Live troubleshooting of component internals without a debugger |
| pprof | `1777` | Go runtime profiling (CPU, memory, contention) | Deep performance analysis under load |
Links and references:
* OpenTelemetry Collector diagnostics overview (conceptual)
* Advanced Golang profiling: [https://learn.kodekloud.com/user/courses/advanced-golang](https://learn.kodekloud.com/user/courses/advanced-golang)
* Prometheus basics and scraping: [https://learn.kodekloud.com/user/courses/prep-course-prometheus-certified-associate-pca-certification](https://learn.kodekloud.com/user/courses/prep-course-prometheus-certified-associate-pca-certification)
 That wraps up this topic.