> ## Documentation Index
> Fetch the complete documentation index at: https://notes.kodekloud.com/llms.txt
> Use this file to discover all available pages before exploring further.
# Scaling the OpenTelemetry Collector
> Practical strategies to safely scale the OpenTelemetry Collector using load balancing, sharding, and consistent routing, and diagnosing when scaling versus backend changes are appropriate
Given diagnostic signals from your Collector, the next question is: what action should you take? This guide explains practical, safe strategies to scale the OpenTelemetry Collector, how to interpret internal metrics to drive those decisions, and when scaling is ineffective.
This article will:
* show the high-level Collector topology and load distribution patterns,
* explain which Collector components actually require scaling,
* describe when scaling will help and when it will not,
* outline safe scaling strategies for common workloads (stateless ingestion, Prometheus-style scrapers, and stateful processors).
 Overview
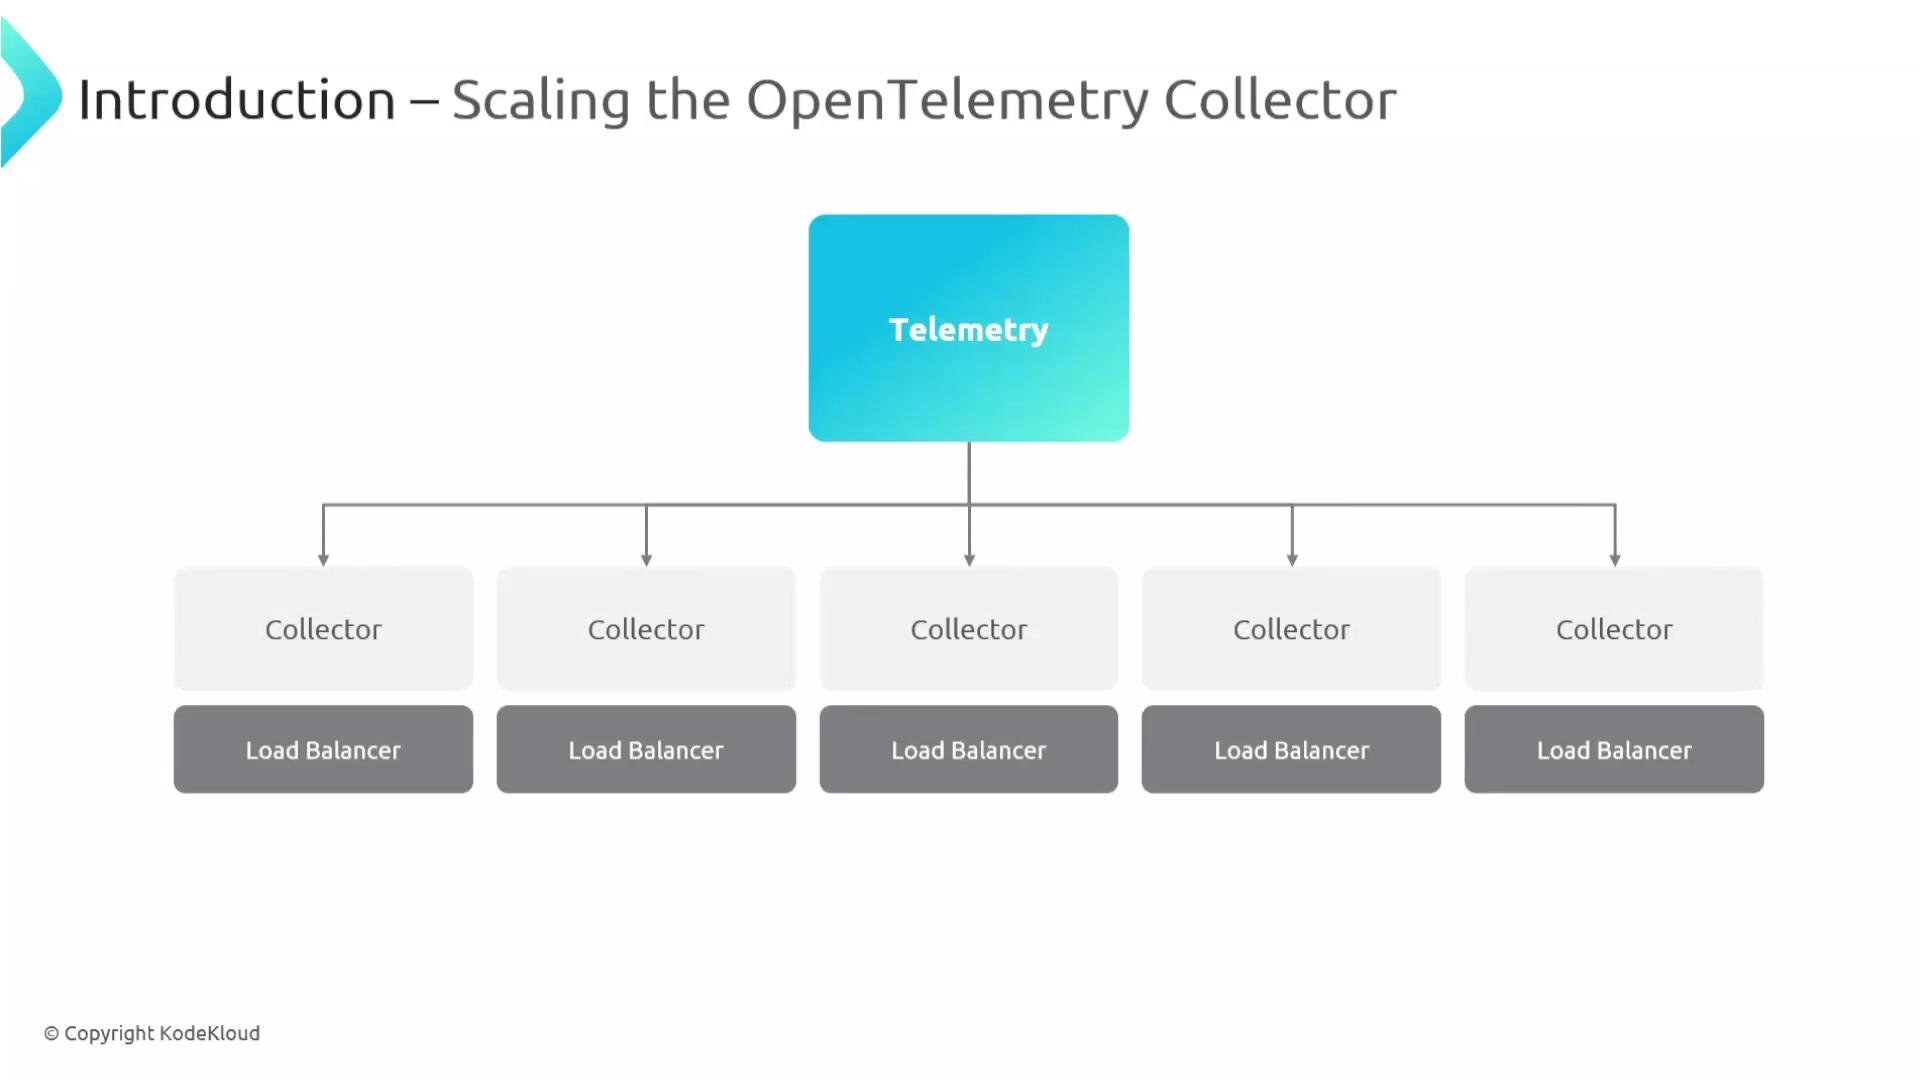
Telemetry typically flows from clients into multiple Collector instances. Each Collector generally forwards data to the same backend(s). Load balancers are commonly placed in front of stateless receivers to distribute incoming traffic. The tasks when scaling are:
* identify which component in a pipeline is under pressure,
* choose a scaling pattern appropriate to that component (load balancing, sharding, or consistent routing),
* verify that the backend and network can absorb increased load before increasing Collector replicas.
Overview
Telemetry typically flows from clients into multiple Collector instances. Each Collector generally forwards data to the same backend(s). Load balancers are commonly placed in front of stateless receivers to distribute incoming traffic. The tasks when scaling are:
* identify which component in a pipeline is under pressure,
* choose a scaling pattern appropriate to that component (load balancing, sharding, or consistent routing),
* verify that the backend and network can absorb increased load before increasing Collector replicas.
 When planning scale operations, focus on the overloaded signal (logs, metrics, or traces), inspect collector metrics that indicate processor, queue, or exporter pressure, and decide whether to scale the Collector, tune configuration, or scale the backend.
What to scale: three broad categories
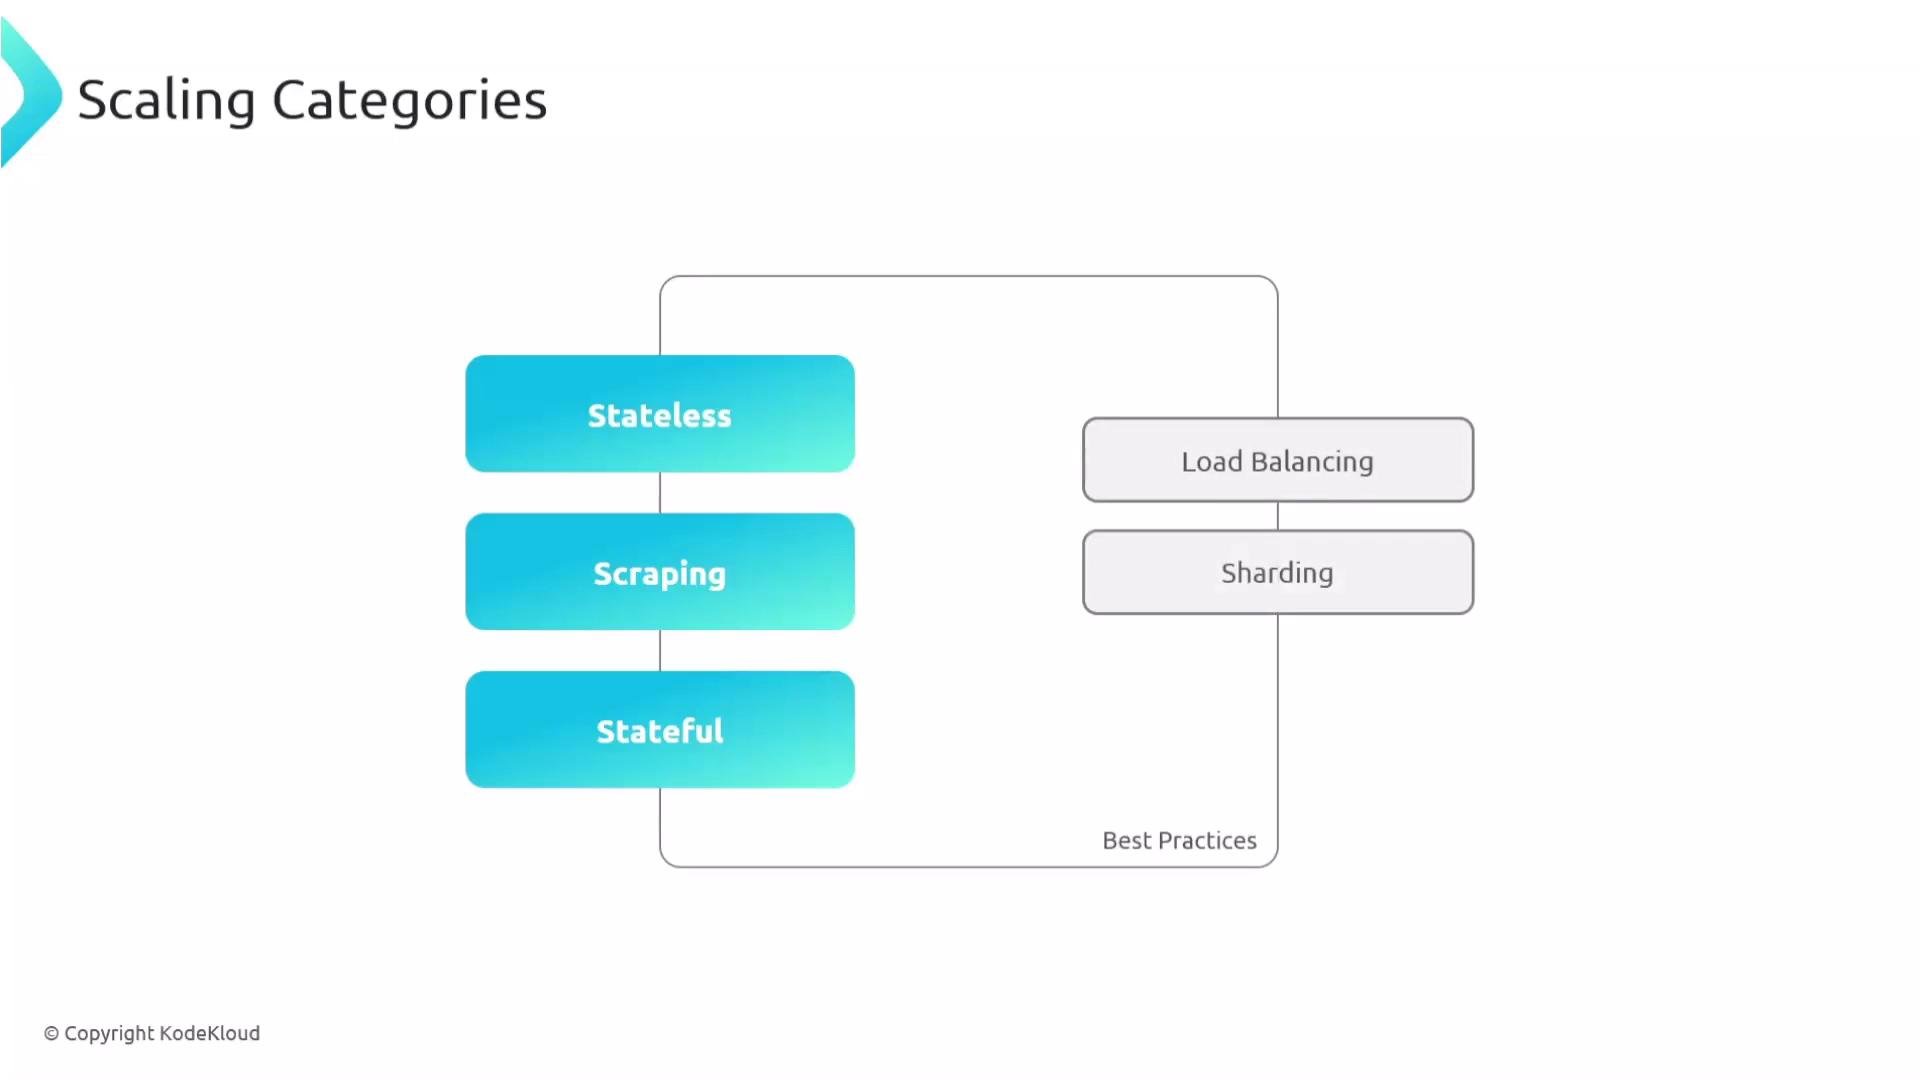
Use the table below to decide which scaling strategy fits each component type.
| Component type | Description | Primary scaling strategy | Key signals / considerations |
| --------------------------- | ----------------------------------------------------------------------------------------------------------------------: | ------------------------------------------------------------------------------------------------ | ------------------------------------------------------------------- |
| Stateless components | Receivers/processors that forward data without keeping per-entity state (e.g., OTLP ingestion that immediately exports) | Horizontal scaling behind a load balancer | Use load balancing; watch `memory`, `cpu`, `exporter_queue` metrics |
| Scrapers (Prometheus-style) | Components that actively pull metrics from targets | Shard scrape targets across collectors (target allocator) | Avoid duplicate metrics; use per-collector `http_sd_config` |
| Stateful processors | Processors that keep per-trace or per-entity state (e.g., tail-based sampling) | Consistent routing (trace ID hashing) or pinned routing so all related data reaches same replica | Requires routing that preserves group affinity for correctness |
When planning scale operations, focus on the overloaded signal (logs, metrics, or traces), inspect collector metrics that indicate processor, queue, or exporter pressure, and decide whether to scale the Collector, tune configuration, or scale the backend.
What to scale: three broad categories
Use the table below to decide which scaling strategy fits each component type.
| Component type | Description | Primary scaling strategy | Key signals / considerations |
| --------------------------- | ----------------------------------------------------------------------------------------------------------------------: | ------------------------------------------------------------------------------------------------ | ------------------------------------------------------------------- |
| Stateless components | Receivers/processors that forward data without keeping per-entity state (e.g., OTLP ingestion that immediately exports) | Horizontal scaling behind a load balancer | Use load balancing; watch `memory`, `cpu`, `exporter_queue` metrics |
| Scrapers (Prometheus-style) | Components that actively pull metrics from targets | Shard scrape targets across collectors (target allocator) | Avoid duplicate metrics; use per-collector `http_sd_config` |
| Stateful processors | Processors that keep per-trace or per-entity state (e.g., tail-based sampling) | Consistent routing (trace ID hashing) or pinned routing so all related data reaches same replica | Requires routing that preserves group affinity for correctness |
 Mapping diagnostics to actions
Inspect the Collector's internal metrics and exporter telemetry to determine if you should scale the Collector tier, tune queue/configuration, or fix the backend/network. The table below summarizes common symptoms and recommended responses.
| Symptom | Typical metric(s) | Recommended action |
| ---------------------------------------------------------- | ---------------------------------------------: | ---------------------------------------------------------------------------------------------------- |
| Spans dropped by processor / memory pressure | `processor_refused_spans`, other `*_refused_*` | Increase Collector CPU/memory or add replicas; tune memory\_limiter settings |
| Growing exporter queue / sustained queue utilization \~70% | exporter queue size, queue utilization | Increase queue capacity, adjust timeouts/retry settings, or scale Collector tier |
| Exporter enqueue failures (queues full) | `exporter_enqueue_failed_spans` | Investigate queue limits and backpressure; scale Collectors or tune queue policies |
| High exporter latency / backend slow to respond | `exporter_latency`, backend response metrics | Likely backend or network bottleneck — scale or optimize backend, do not only add Collector replicas |
Mapping diagnostics to actions
Inspect the Collector's internal metrics and exporter telemetry to determine if you should scale the Collector tier, tune queue/configuration, or fix the backend/network. The table below summarizes common symptoms and recommended responses.
| Symptom | Typical metric(s) | Recommended action |
| ---------------------------------------------------------- | ---------------------------------------------: | ---------------------------------------------------------------------------------------------------- |
| Spans dropped by processor / memory pressure | `processor_refused_spans`, other `*_refused_*` | Increase Collector CPU/memory or add replicas; tune memory\_limiter settings |
| Growing exporter queue / sustained queue utilization \~70% | exporter queue size, queue utilization | Increase queue capacity, adjust timeouts/retry settings, or scale Collector tier |
| Exporter enqueue failures (queues full) | `exporter_enqueue_failed_spans` | Investigate queue limits and backpressure; scale Collectors or tune queue policies |
| High exporter latency / backend slow to respond | `exporter_latency`, backend response metrics | Likely backend or network bottleneck — scale or optimize backend, do not only add Collector replicas |
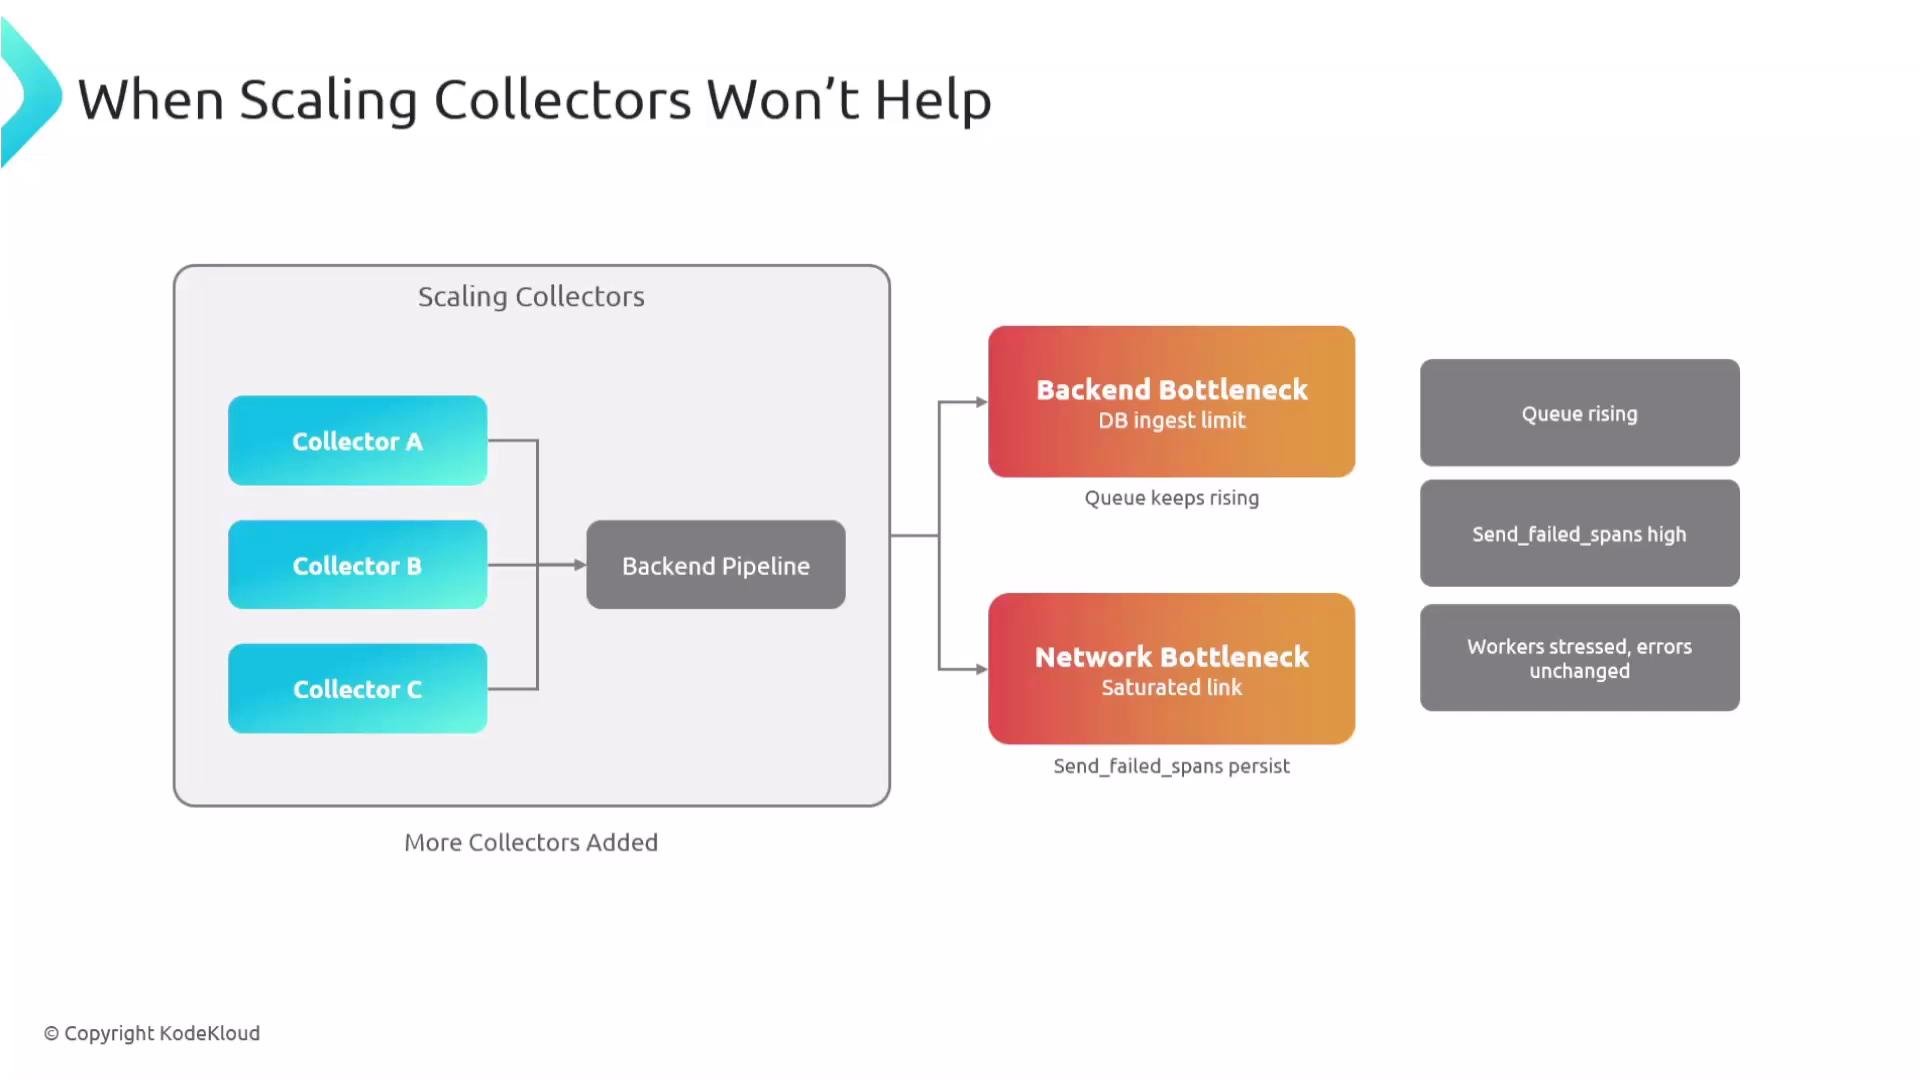 If the network link to your backend is saturated or your backend is unable to ingest more telemetry, adding Collector replicas amplifies failures rather than resolving them. Diagnose and resolve backend or network issues before scaling the Collector tier.
Scaling patterns by component type
Stateless components
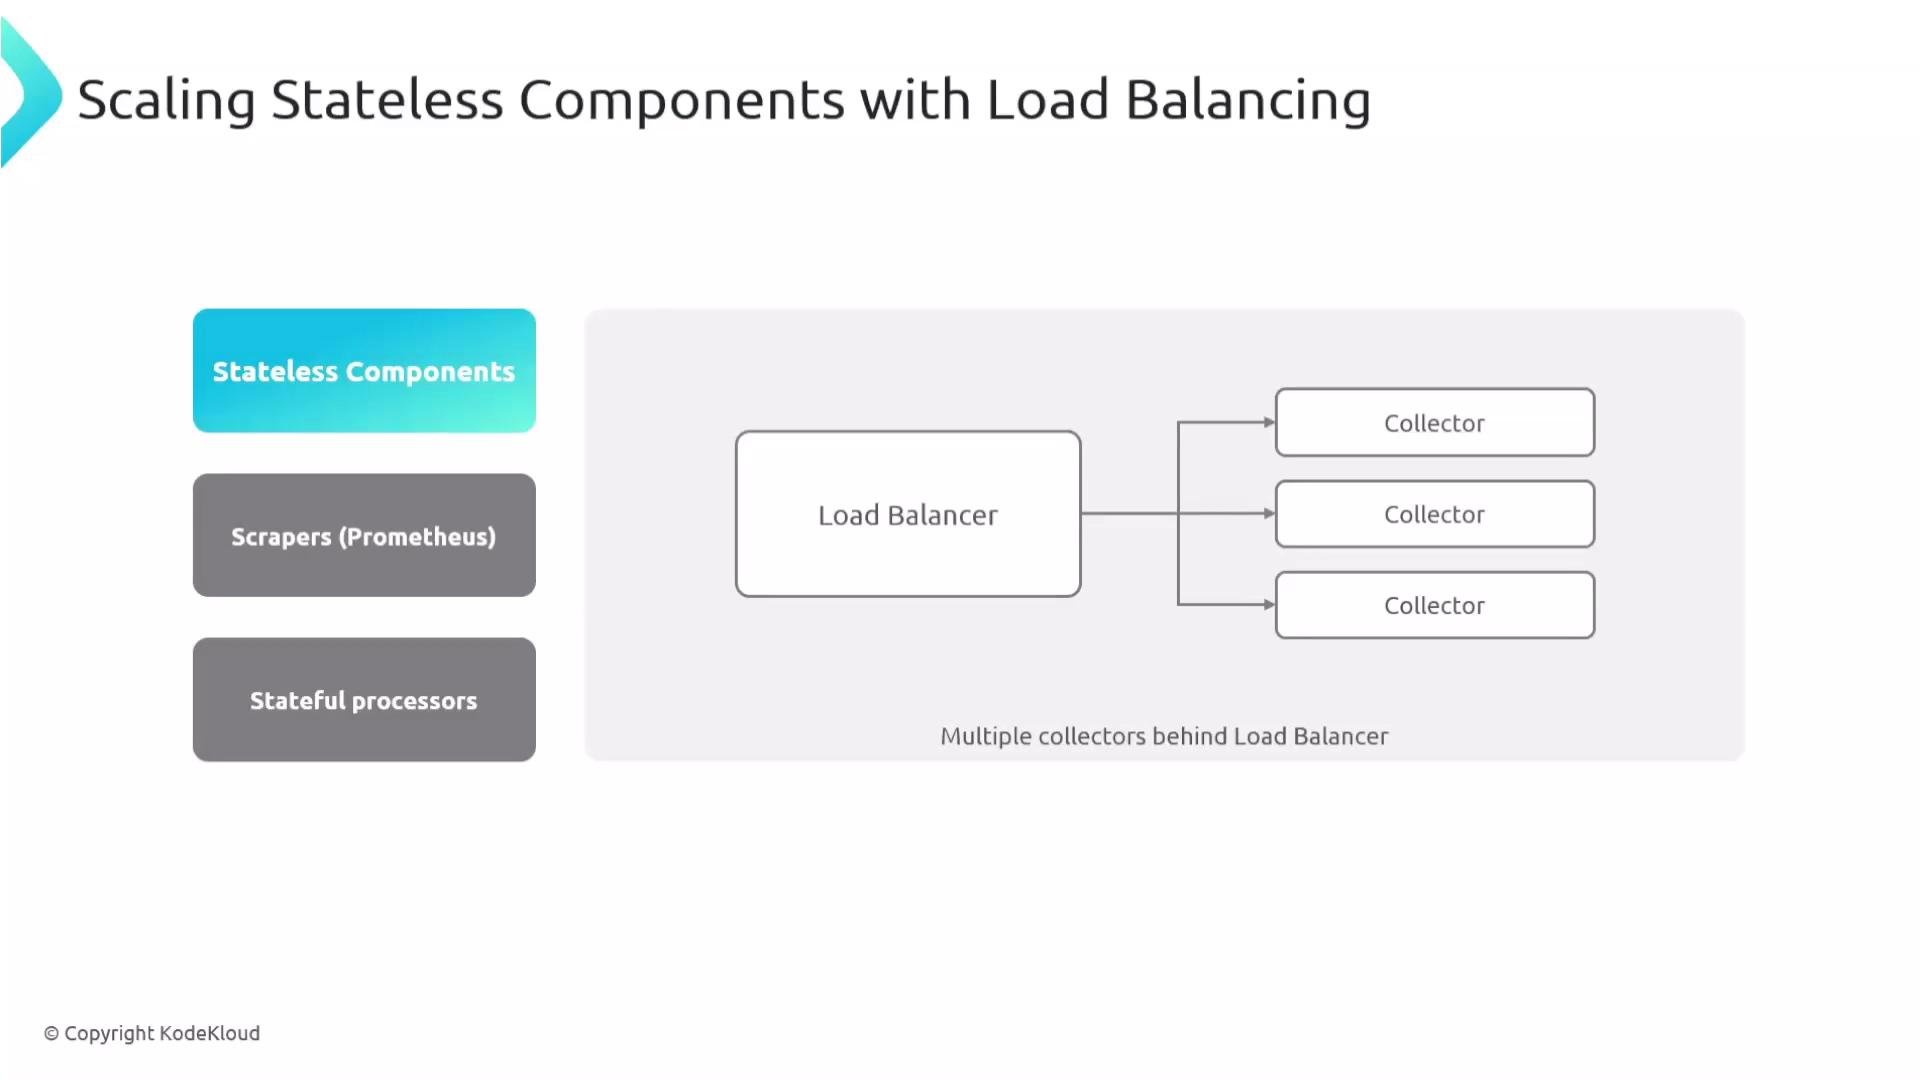
* Stateless receivers and processors (for example, OTLP ingestors that simply forward data) are the easiest to scale horizontally. Place a load balancer in front of multiple identical Collector replicas and scale replicas as demand grows.
* Typical setup: clients -> load balancer -> N stateless Collector replicas -> exporter(s).
If the network link to your backend is saturated or your backend is unable to ingest more telemetry, adding Collector replicas amplifies failures rather than resolving them. Diagnose and resolve backend or network issues before scaling the Collector tier.
Scaling patterns by component type
Stateless components
* Stateless receivers and processors (for example, OTLP ingestors that simply forward data) are the easiest to scale horizontally. Place a load balancer in front of multiple identical Collector replicas and scale replicas as demand grows.
* Typical setup: clients -> load balancer -> N stateless Collector replicas -> exporter(s).
 Prometheus-style scrapers
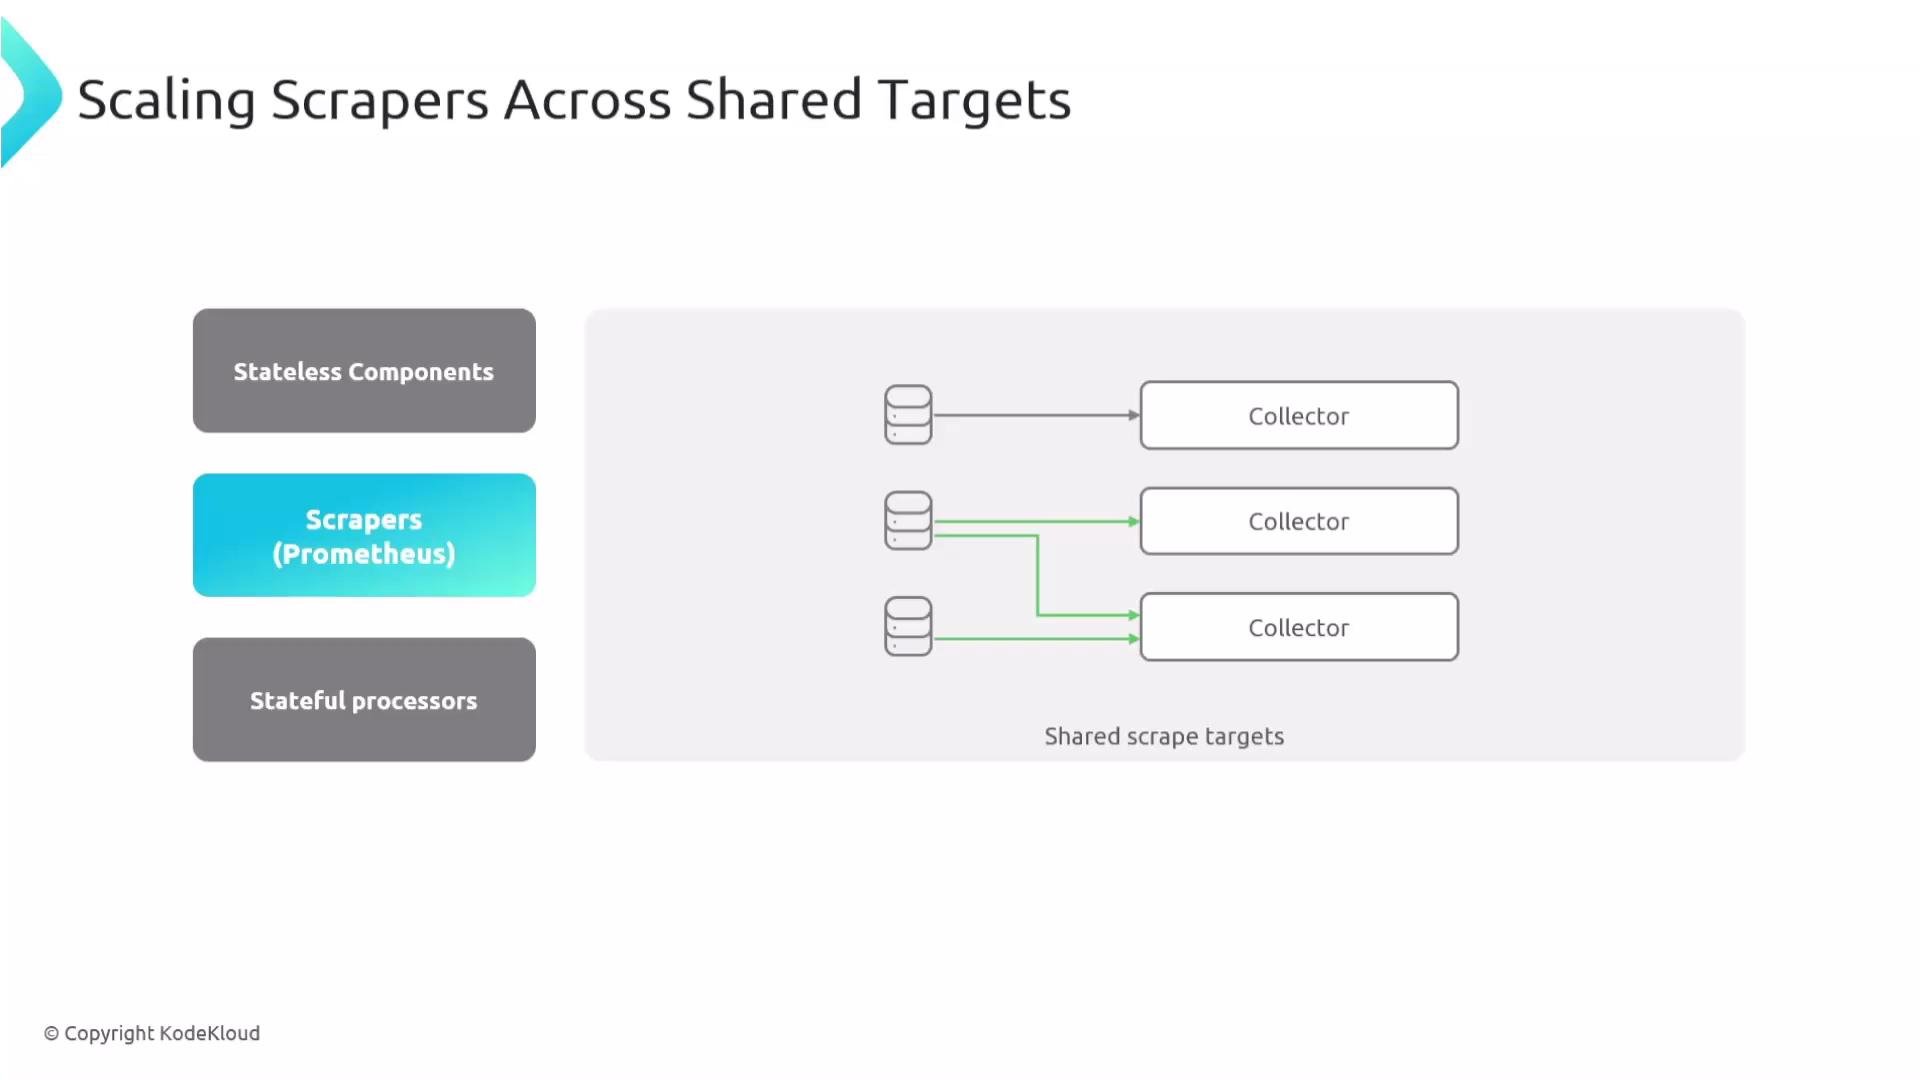
* Multiple collectors scraping the same targets will produce duplicate metrics. To avoid this, assign each collector a unique subset of targets (sharding).
* Implement a target allocator or similar orchestration that:
1. Discovers scrape endpoints,
2. Divides them into non-overlapping sets,
3. Generates per-collector service discovery configurations (for example, a dedicated `http_sd_config`) so each collector scrapes only its assigned targets.
* After scraping, collectors export metrics (e.g., Prometheus Remote Write) to the backend. Sharding guarantees each metric stream is emitted exactly once.
Prometheus-style scrapers
* Multiple collectors scraping the same targets will produce duplicate metrics. To avoid this, assign each collector a unique subset of targets (sharding).
* Implement a target allocator or similar orchestration that:
1. Discovers scrape endpoints,
2. Divides them into non-overlapping sets,
3. Generates per-collector service discovery configurations (for example, a dedicated `http_sd_config`) so each collector scrapes only its assigned targets.
* After scraping, collectors export metrics (e.g., Prometheus Remote Write) to the backend. Sharding guarantees each metric stream is emitted exactly once.
 Target allocator workflow
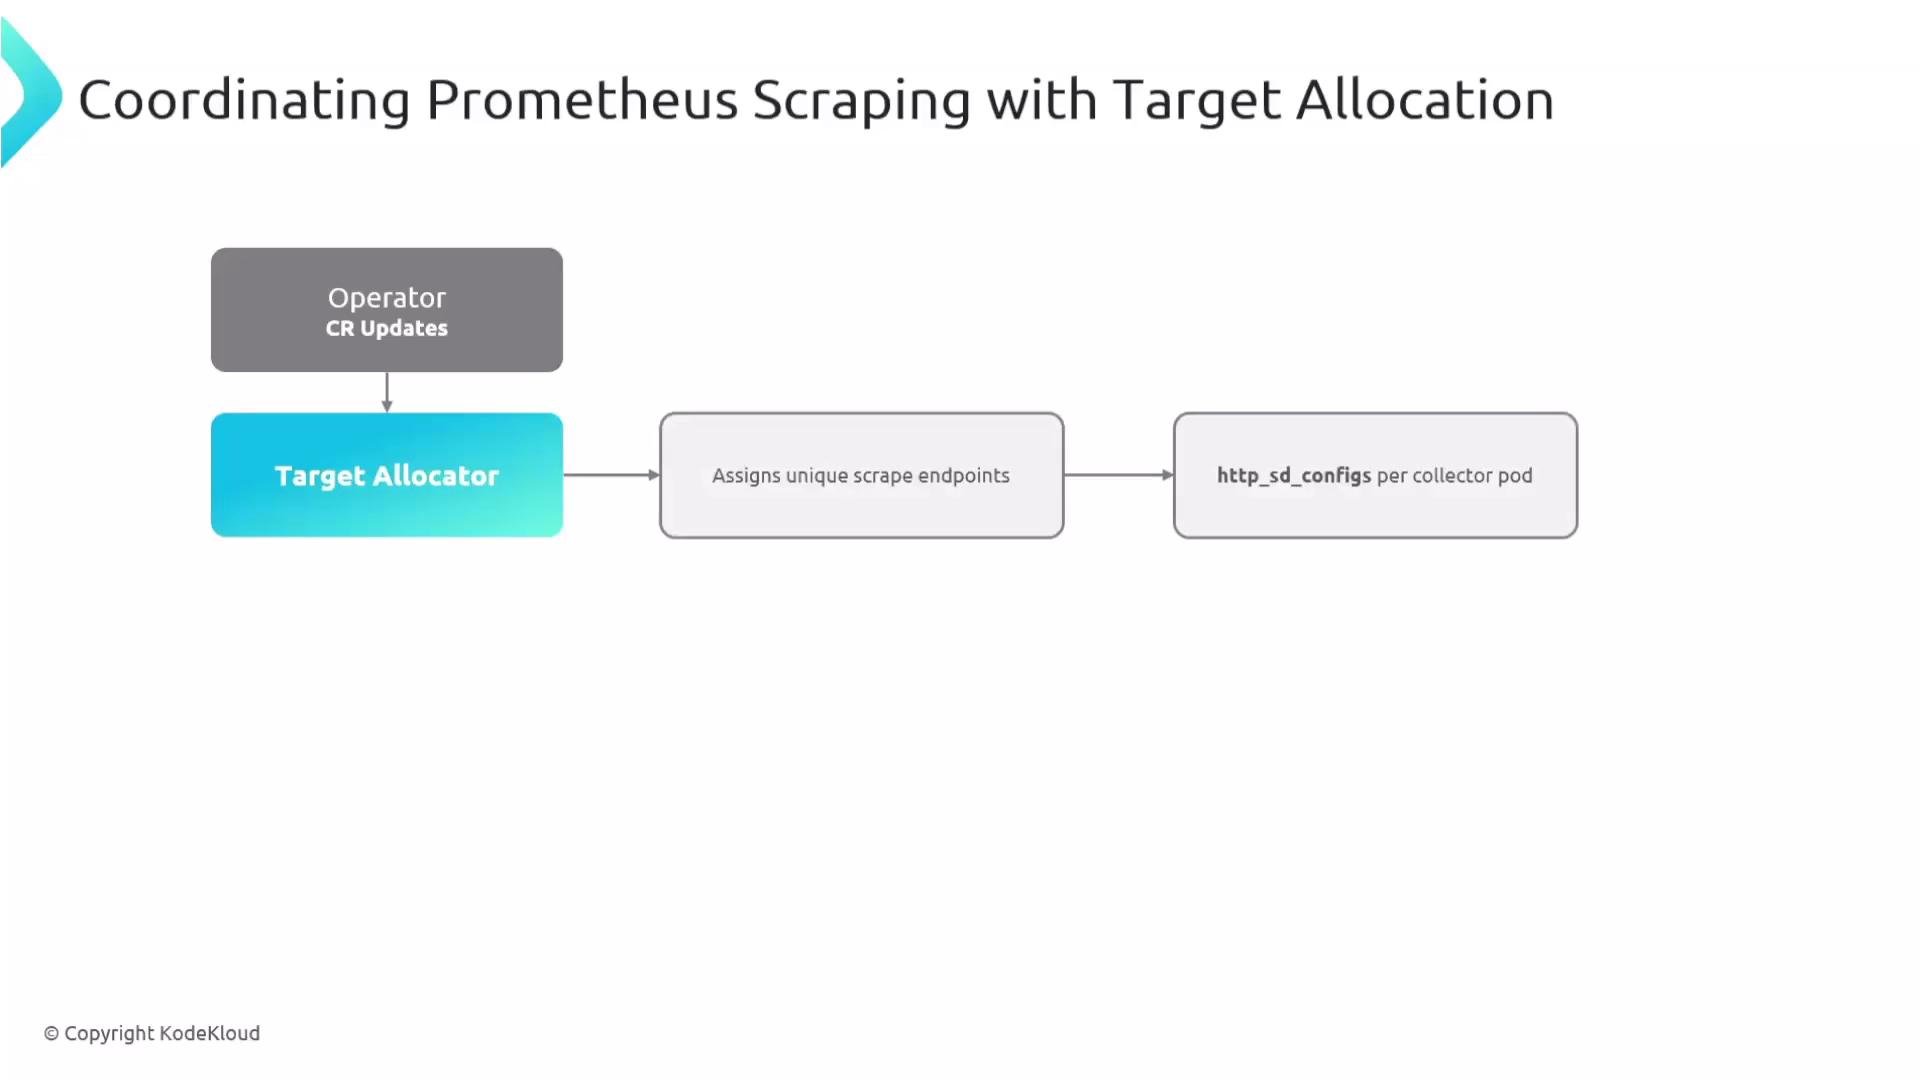
* Operator updates scrape configuration and hands it to the target allocator.
* Target allocator discovers all scrape endpoints and partitions them into unique sets.
* For each Collector pod, the allocator generates an `http_sd_config` so each collector scrapes only its assigned endpoints.
Target allocator workflow
* Operator updates scrape configuration and hands it to the target allocator.
* Target allocator discovers all scrape endpoints and partitions them into unique sets.
* For each Collector pod, the allocator generates an `http_sd_config` so each collector scrapes only its assigned endpoints.
 Stateful processors (e.g., tail-based sampling)
* Stateful processors need complete per-trace context to make correct decisions (for example, in tail-based sampling).
* Ensure all spans for a trace are routed to the same Collector replica. Two common approaches:
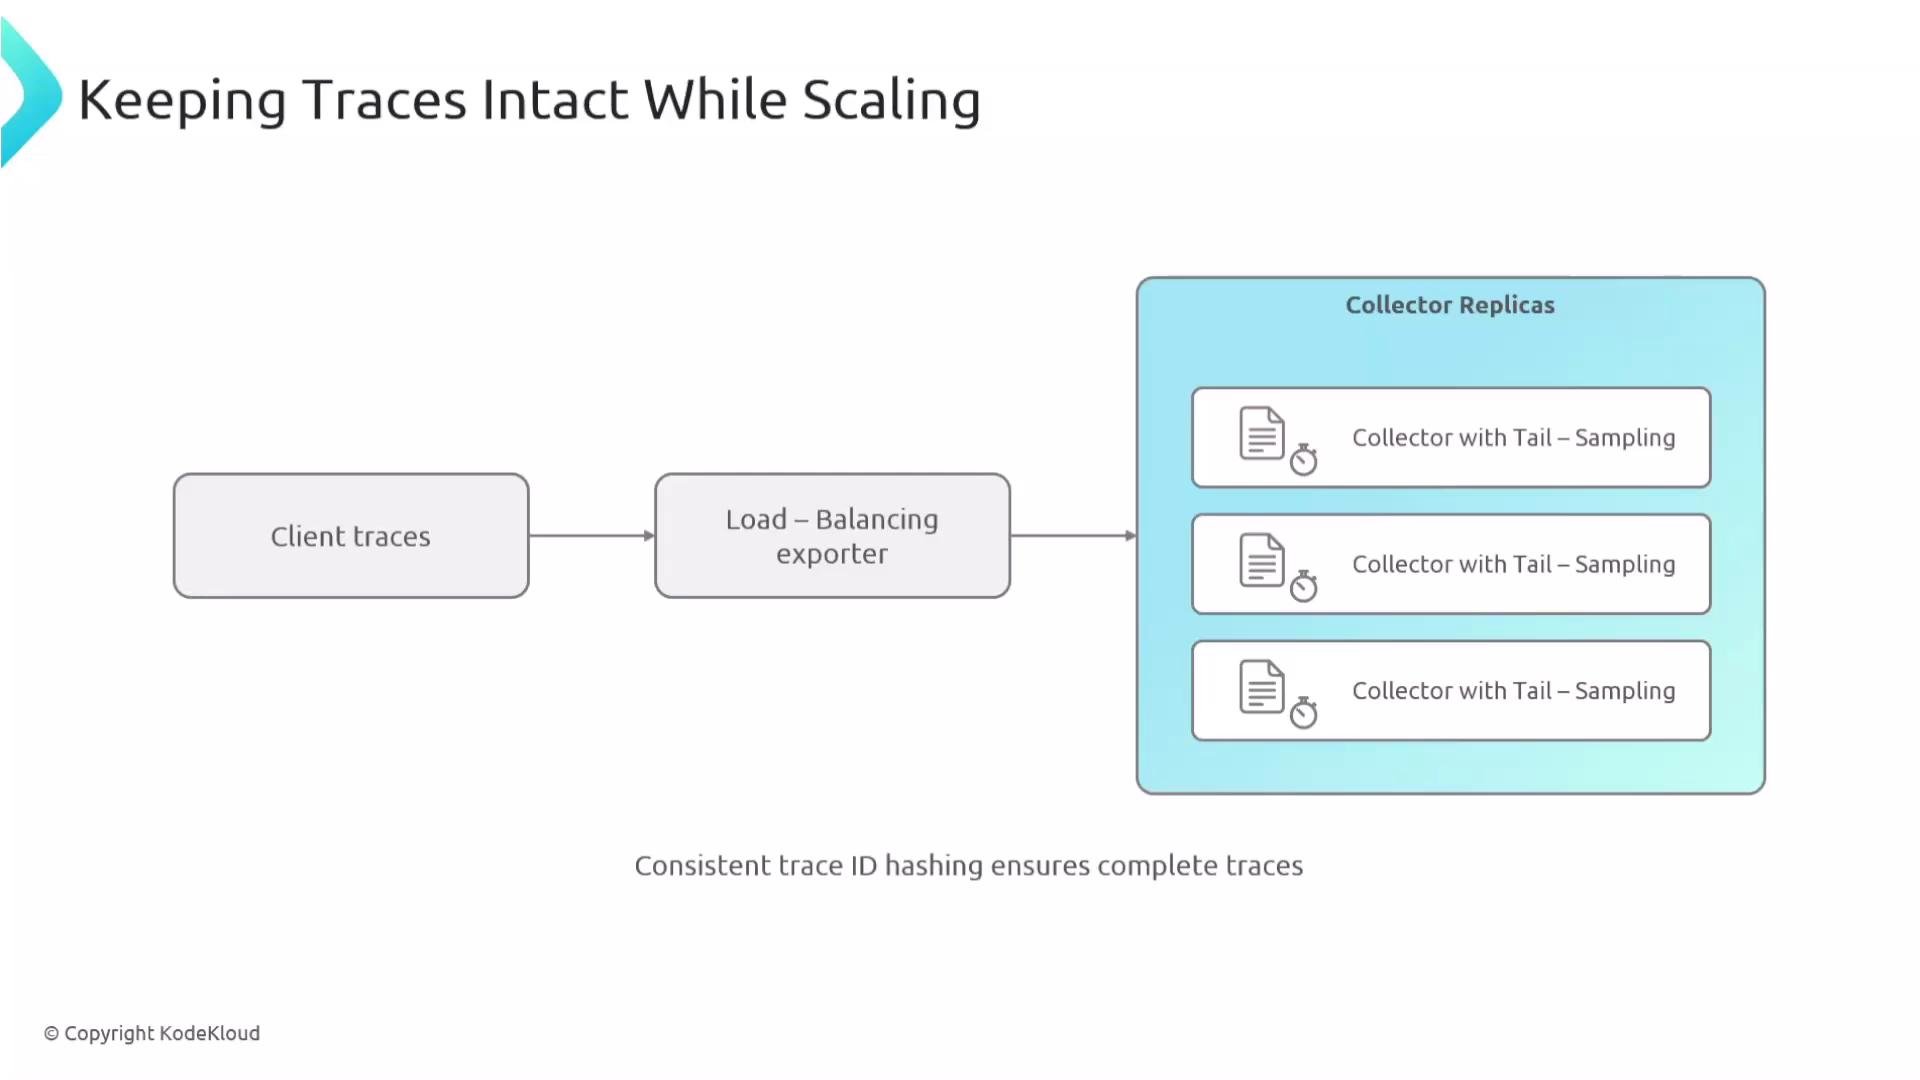
* Client-side / load-balancing exporter with consistent hashing on the trace ID so all spans for a trace land on the same replica.
* A front-end router that performs consistent hashing and forwards trace data to the appropriate Collector.
* Consistent hashing preserves trace-to-replica affinity even as replicas scale up or down, allowing stateful operations (like tail-sampling) to function correctly.
!\[The image is a diagram illustrating "Scaling Stateful Data-Dependent Components," showing a flow from a "Tail-Sampling Processor" to a "Load Balancer." It also categorizes components as "Stateless," "Scrapers (Prometheus)," and "Stateful processors."]\(/images/Prep-Course-OpenTelemetry- Certified-Associate-OTCA-Certification/OpenTelemetry-Collector-Debugging-Operations-and-Scaling/Scaling-the-OpenTelemetry-Collector/scaling-stateful-data-dependent-components-diagram.jpg)
Client traces and consistent routing
* Typical flow: client -> load-balancing exporter -> consistent-hash routing -> Collector replicas -> tail-sampling / stateful processing -> backend.
* With consistent trace ID hashing, every span for a trace is forwarded to the same Collector replica, preserving the required context for stateful processing even when replicas change.
Stateful processors (e.g., tail-based sampling)
* Stateful processors need complete per-trace context to make correct decisions (for example, in tail-based sampling).
* Ensure all spans for a trace are routed to the same Collector replica. Two common approaches:
* Client-side / load-balancing exporter with consistent hashing on the trace ID so all spans for a trace land on the same replica.
* A front-end router that performs consistent hashing and forwards trace data to the appropriate Collector.
* Consistent hashing preserves trace-to-replica affinity even as replicas scale up or down, allowing stateful operations (like tail-sampling) to function correctly.
!\[The image is a diagram illustrating "Scaling Stateful Data-Dependent Components," showing a flow from a "Tail-Sampling Processor" to a "Load Balancer." It also categorizes components as "Stateless," "Scrapers (Prometheus)," and "Stateful processors."]\(/images/Prep-Course-OpenTelemetry- Certified-Associate-OTCA-Certification/OpenTelemetry-Collector-Debugging-Operations-and-Scaling/Scaling-the-OpenTelemetry-Collector/scaling-stateful-data-dependent-components-diagram.jpg)
Client traces and consistent routing
* Typical flow: client -> load-balancing exporter -> consistent-hash routing -> Collector replicas -> tail-sampling / stateful processing -> backend.
* With consistent trace ID hashing, every span for a trace is forwarded to the same Collector replica, preserving the required context for stateful processing even when replicas change.
 Operational checklist for scaling
* Identify the overloaded signal (logs, metrics, traces). If your pipelines are separated by signal, scale only the affected pipeline.
* Monitor these Collector metrics closely:
* CPU and memory usage,
* `processor_refused_*` (e.g., `processor_refused_spans`),
* queue sizes and utilization,
* `exporter_enqueue_failed_*`,
* `exporter_latency`.
* If the Collector is dropping data or refusing spans, scale the Collector or increase resource limits and tune the memory\_limiter.
* If exporter latency / send failures indicate backend or network issues, fix or scale the backend before increasing Collector replicas.
* For scrapers: shard targets (target allocator) so each Collector scrapes a unique set and avoid duplicates.
* For stateful processors: use consistent hashing or pinned routing so all spans from a trace route to the same replica.
Operational checklist for scaling
* Identify the overloaded signal (logs, metrics, traces). If your pipelines are separated by signal, scale only the affected pipeline.
* Monitor these Collector metrics closely:
* CPU and memory usage,
* `processor_refused_*` (e.g., `processor_refused_spans`),
* queue sizes and utilization,
* `exporter_enqueue_failed_*`,
* `exporter_latency`.
* If the Collector is dropping data or refusing spans, scale the Collector or increase resource limits and tune the memory\_limiter.
* If exporter latency / send failures indicate backend or network issues, fix or scale the backend before increasing Collector replicas.
* For scrapers: shard targets (target allocator) so each Collector scrapes a unique set and avoid duplicates.
* For stateful processors: use consistent hashing or pinned routing so all spans from a trace route to the same replica.
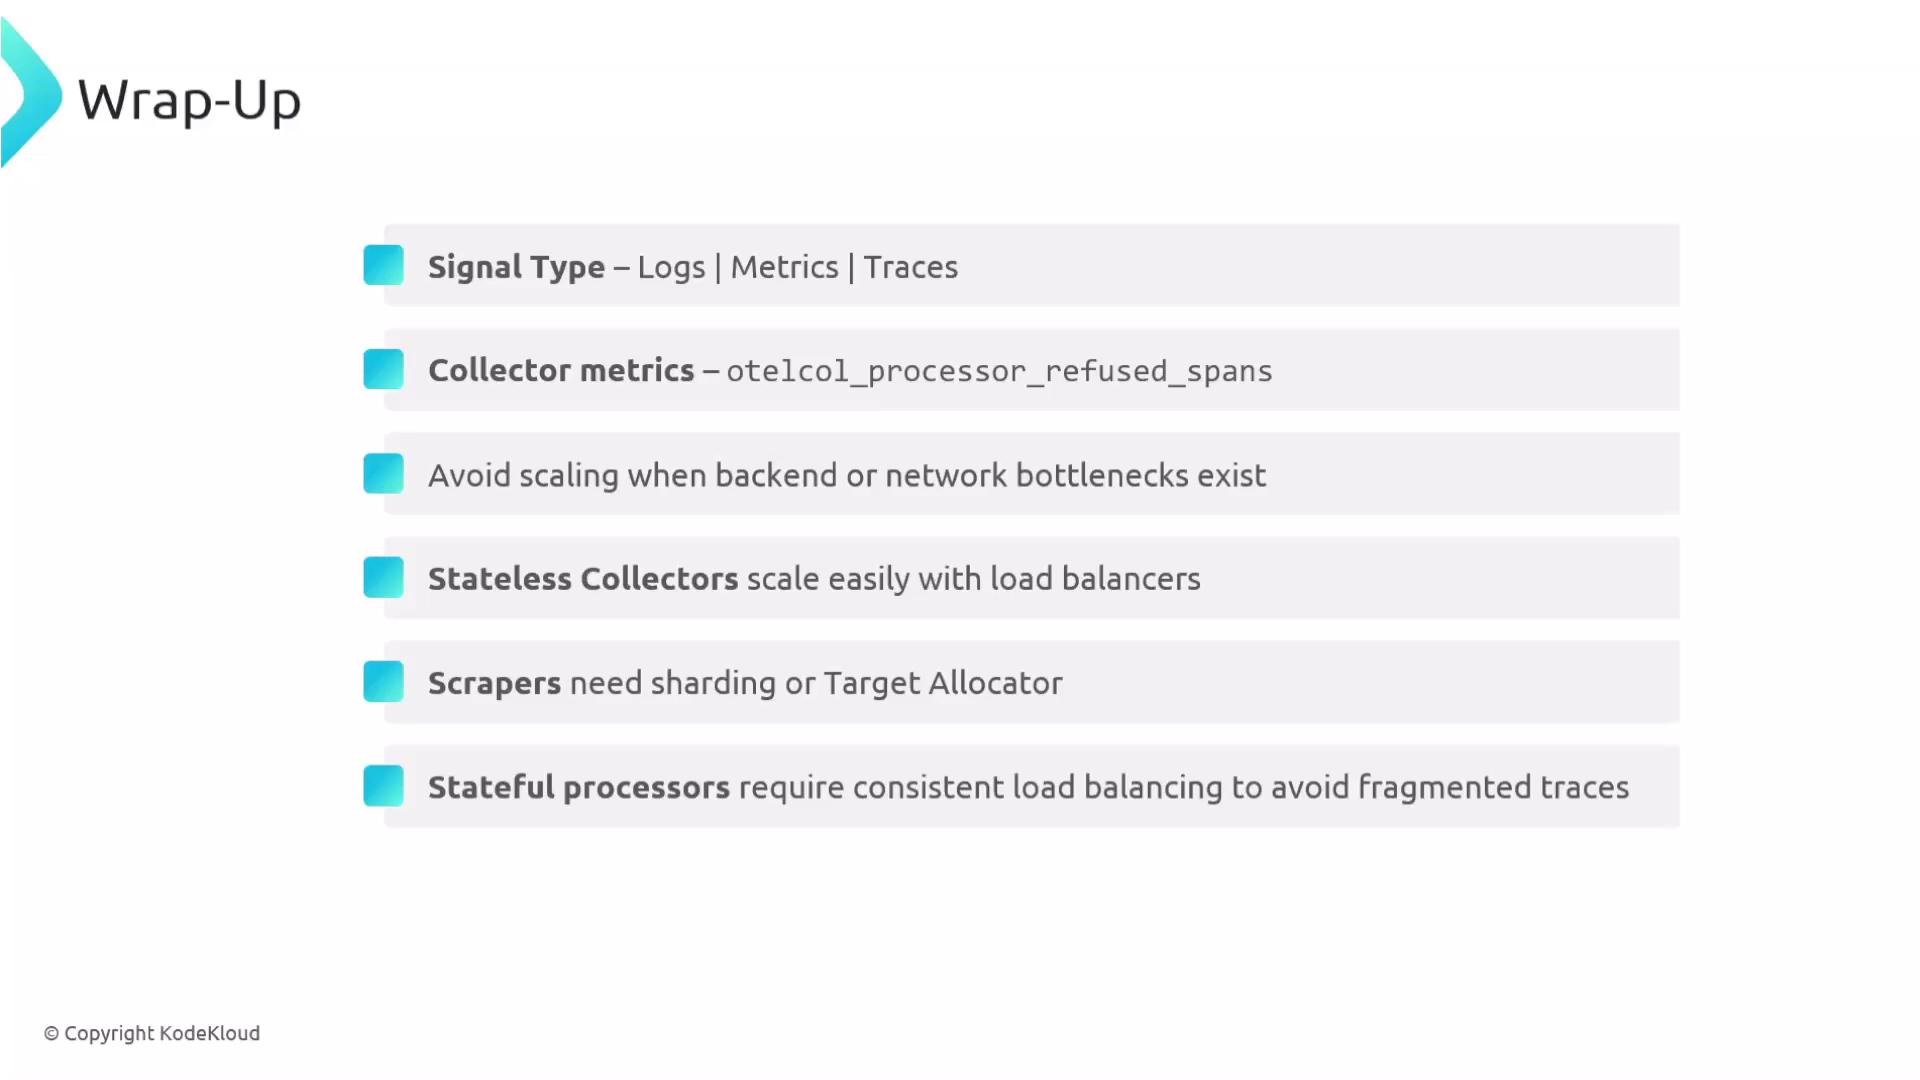 Wrap-up
* Start by identifying the overloaded signal and inspect the corresponding Collector metrics.
* Scale stateless Collectors behind a load balancer for straightforward horizontal scaling.
* Shard Prometheus-style scrapers or use a target allocator to avoid duplicate metrics.
* Use consistent hashing (trace ID-based routing) for stateful components (e.g., tail-based sampling) so all spans in a trace arrive at the same replica.
* Never scale Collectors blindly when the backend or network is the root cause — that only amplifies errors.
References and further reading
* [OpenTelemetry Collector Concepts](https://opentelemetry.io/docs/collector/)
* [Prometheus Sharding and Scraping Patterns](https://prometheus.io/docs/prometheus/latest/configuration/configuration/#scrape_config)
* [Designing for Observability at Scale (patterns)](https://opentelemetry.io)
This concludes the discussion on safe and effective scaling strategies for the OpenTelemetry Collector.
Wrap-up
* Start by identifying the overloaded signal and inspect the corresponding Collector metrics.
* Scale stateless Collectors behind a load balancer for straightforward horizontal scaling.
* Shard Prometheus-style scrapers or use a target allocator to avoid duplicate metrics.
* Use consistent hashing (trace ID-based routing) for stateful components (e.g., tail-based sampling) so all spans in a trace arrive at the same replica.
* Never scale Collectors blindly when the backend or network is the root cause — that only amplifies errors.
References and further reading
* [OpenTelemetry Collector Concepts](https://opentelemetry.io/docs/collector/)
* [Prometheus Sharding and Scraping Patterns](https://prometheus.io/docs/prometheus/latest/configuration/configuration/#scrape_config)
* [Designing for Observability at Scale (patterns)](https://opentelemetry.io)
This concludes the discussion on safe and effective scaling strategies for the OpenTelemetry Collector.