> ## Documentation Index
> Fetch the complete documentation index at: https://notes.kodekloud.com/llms.txt
> Use this file to discover all available pages before exploring further.
# OpenTelemetry Protocol OTLP
> Explains OTLP, the OpenTelemetry Protocol that standardizes traces, metrics, and logs using Protobuf and transports like gRPC or HTTP to enable interoperable telemetry pipelines.
All right, payload packers — it's time to serialize some data. This article explains OTLP (OpenTelemetry Protocol): what it is, why it exists, how telemetry is structured, and how it is transported.
OTLP is the standard OpenTelemetry uses to send telemetry data. It provides a common language so services, agents, collectors, and backends can interoperate without vendor-specific exporters or formats.
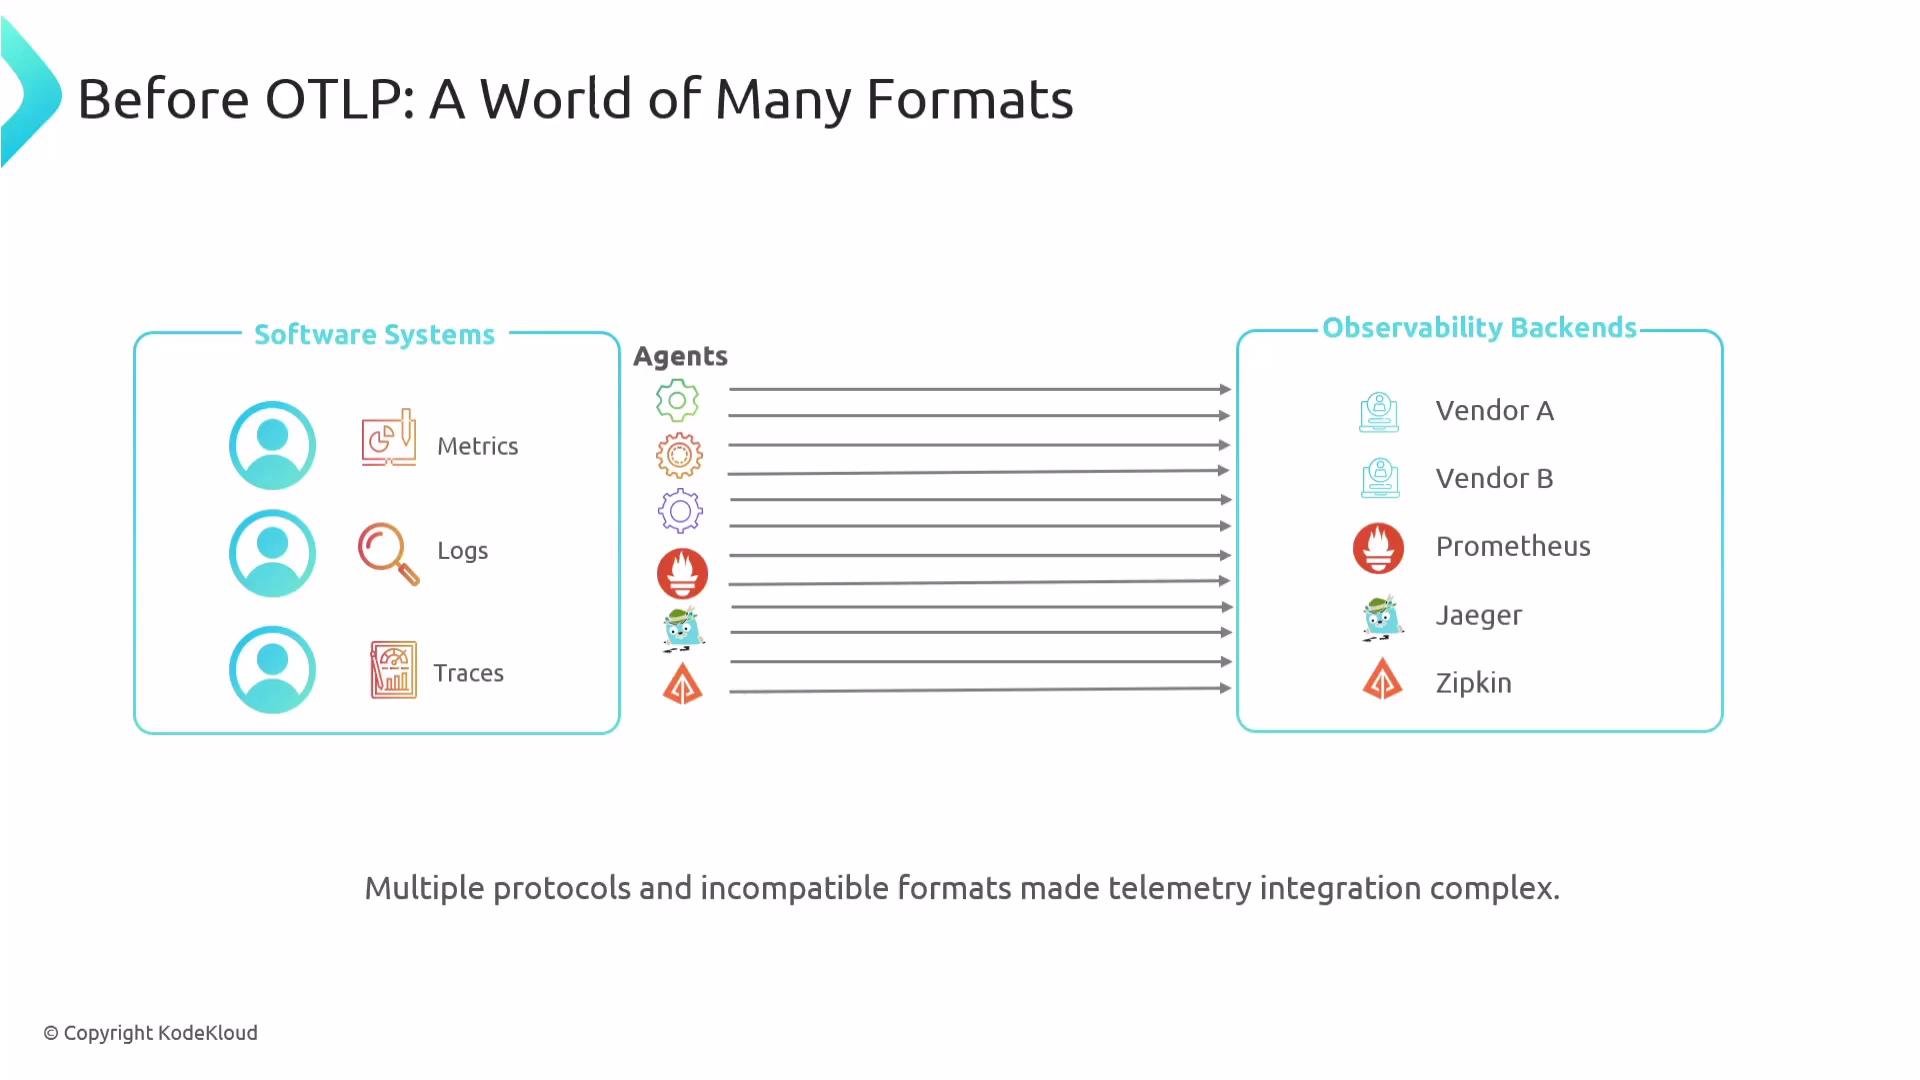
Historically, telemetry instrumentation was fragmented. Each backend shipped its own agent and used its own data format. Teams needed different exporters and libraries to send traces, metrics, and logs to Prometheus, Jaeger, Zipkin, or commercial platforms — creating vendor lock-in, inconsistent instrumentation, and extra operational burden.
 Why OTLP matters
* Reduces duplicate exporters and agents.
* Standardizes telemetry signals (traces, metrics, logs).
* Decouples instrumentation from destination choices using a neutral wire format.
* Enables the OpenTelemetry Collector to receive, process, and forward telemetry to any backend.
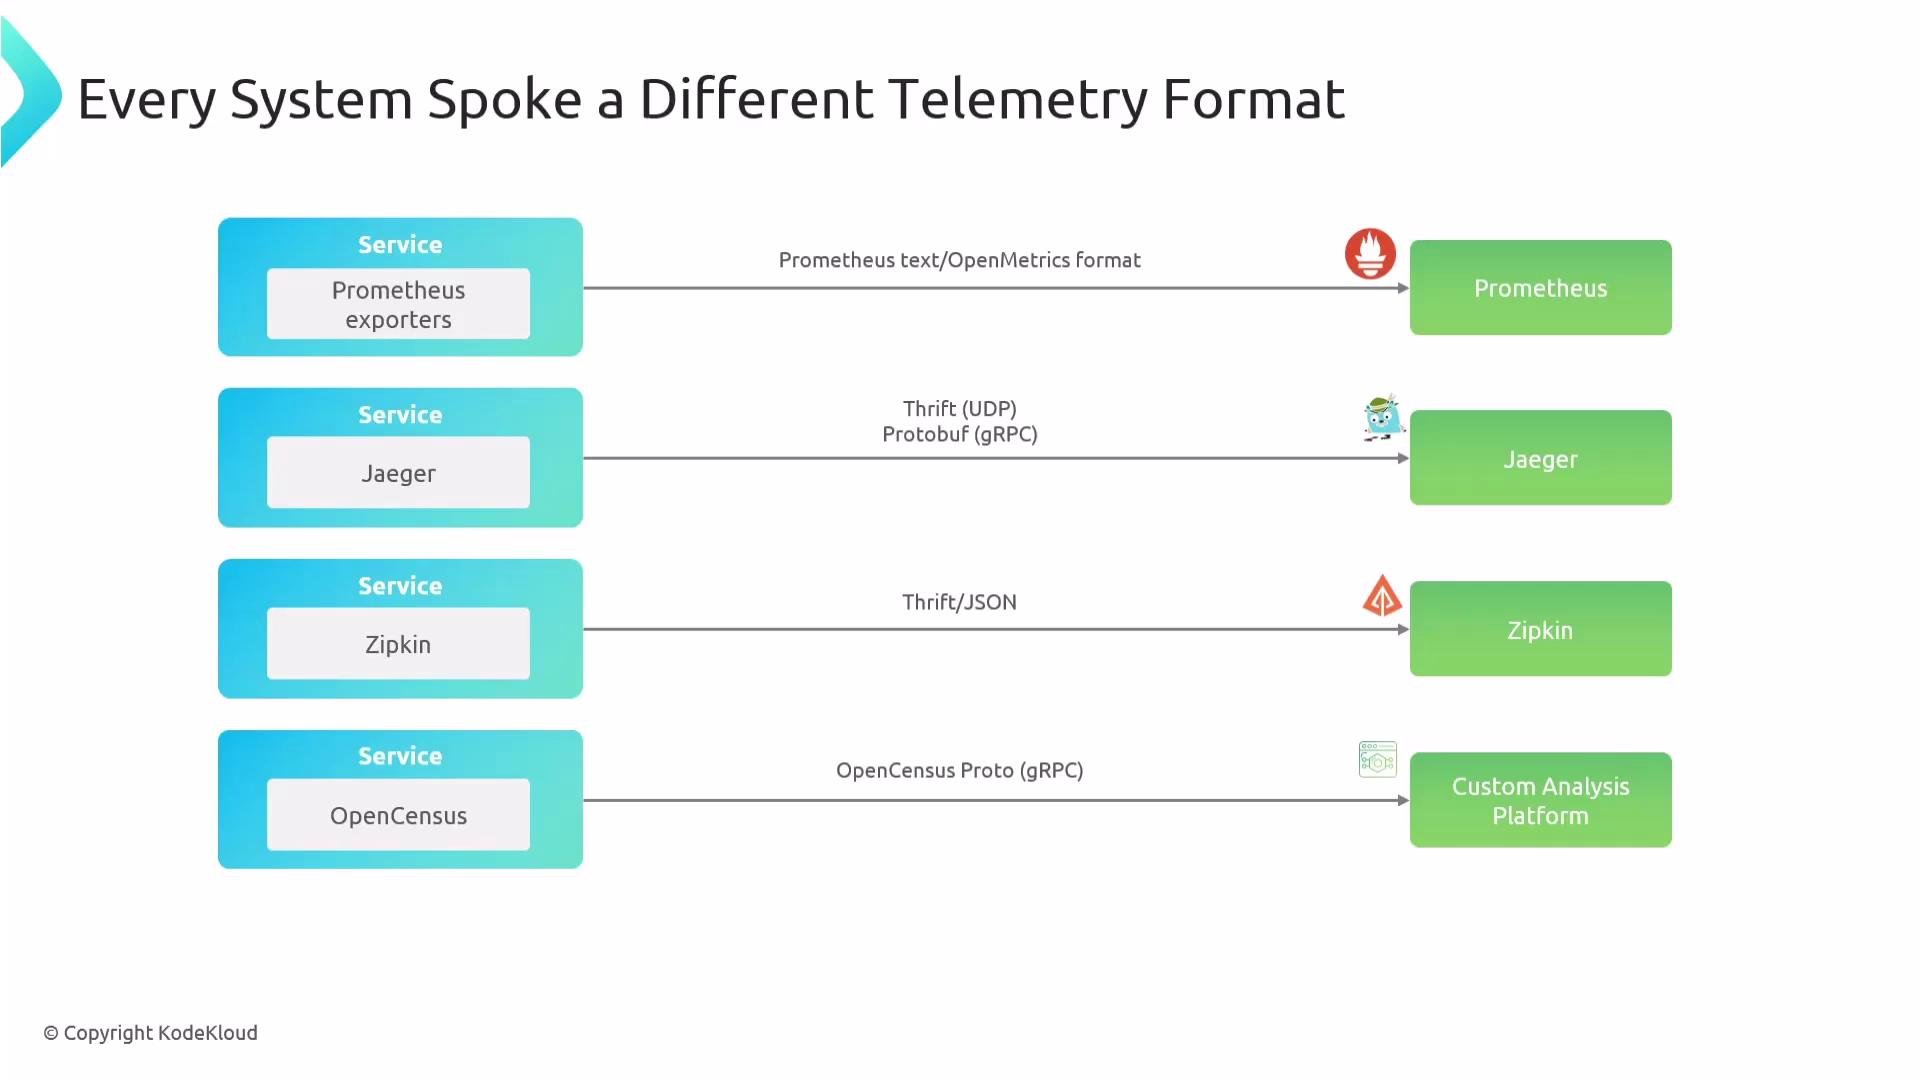
Before OTLP, different systems used different formats and transports:
* Prometheus: text-based exposition format (moving toward OpenMetrics).
* Jaeger: originally Apache Thrift (UDP), later gRPC + Protobuf.
* Zipkin: Thrift and JSON.
* OpenCensus: Protobuf-based wire format.
Collecting telemetry from multiple sources meant maintaining multiple exporters.
Why OTLP matters
* Reduces duplicate exporters and agents.
* Standardizes telemetry signals (traces, metrics, logs).
* Decouples instrumentation from destination choices using a neutral wire format.
* Enables the OpenTelemetry Collector to receive, process, and forward telemetry to any backend.
Before OTLP, different systems used different formats and transports:
* Prometheus: text-based exposition format (moving toward OpenMetrics).
* Jaeger: originally Apache Thrift (UDP), later gRPC + Protobuf.
* Zipkin: Thrift and JSON.
* OpenCensus: Protobuf-based wire format.
Collecting telemetry from multiple sources meant maintaining multiple exporters.
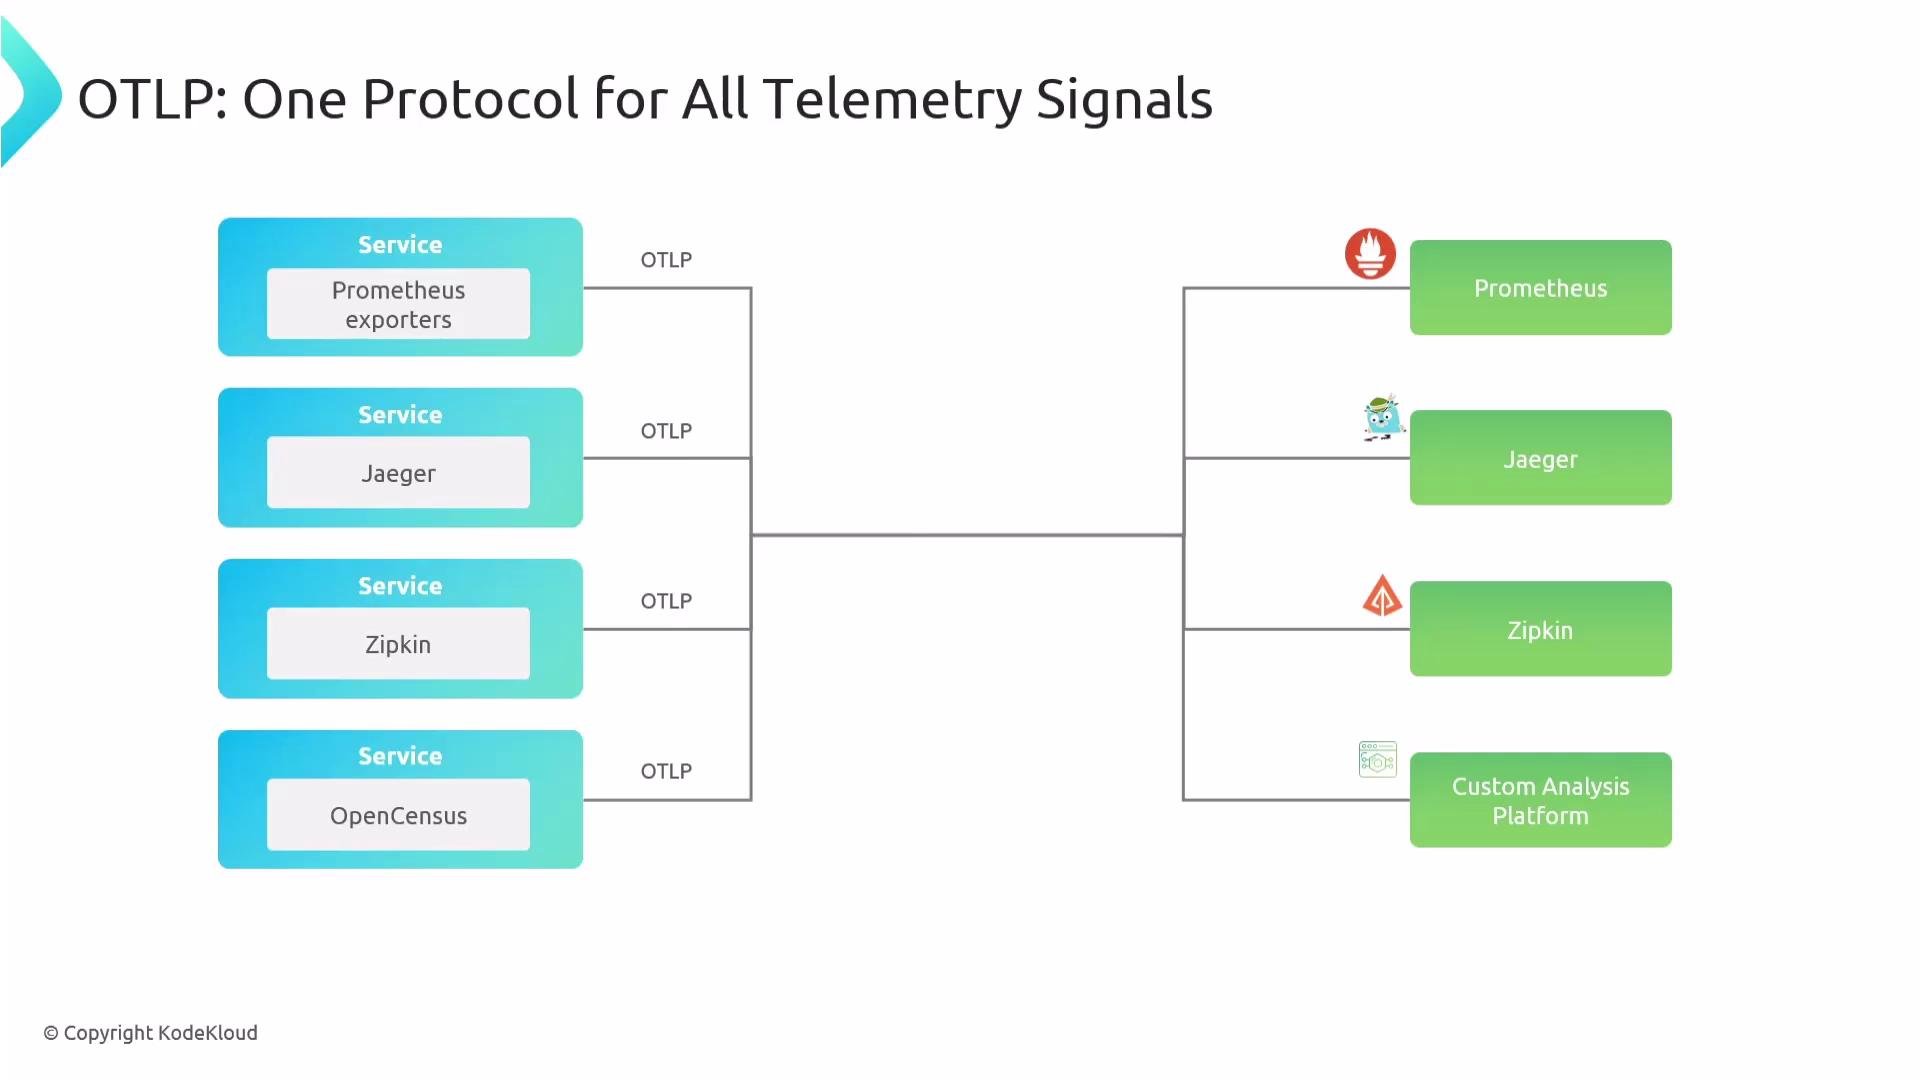
 OTLP provides a vendor-neutral, signal-agnostic layer. SDKs and agents standardize telemetry into traces, metrics, and logs. The OpenTelemetry Collector can receive OTLP, process data (batching, filtering, enrichment), and export it to any backend, data lake, or custom platform.
 What OTLP is
* A wire protocol: defines how telemetry is structured and transmitted over the network (application-layer protocol).
* A data model: trace, metric, and log message schemas encoded with Protocol Buffers (Protobuf).
* A transport specification: commonly uses gRPC or HTTP, with defined compression, batching, and error-handling semantics.
What OTLP is
* A wire protocol: defines how telemetry is structured and transmitted over the network (application-layer protocol).
* A data model: trace, metric, and log message schemas encoded with Protocol Buffers (Protobuf).
* A transport specification: commonly uses gRPC or HTTP, with defined compression, batching, and error-handling semantics.
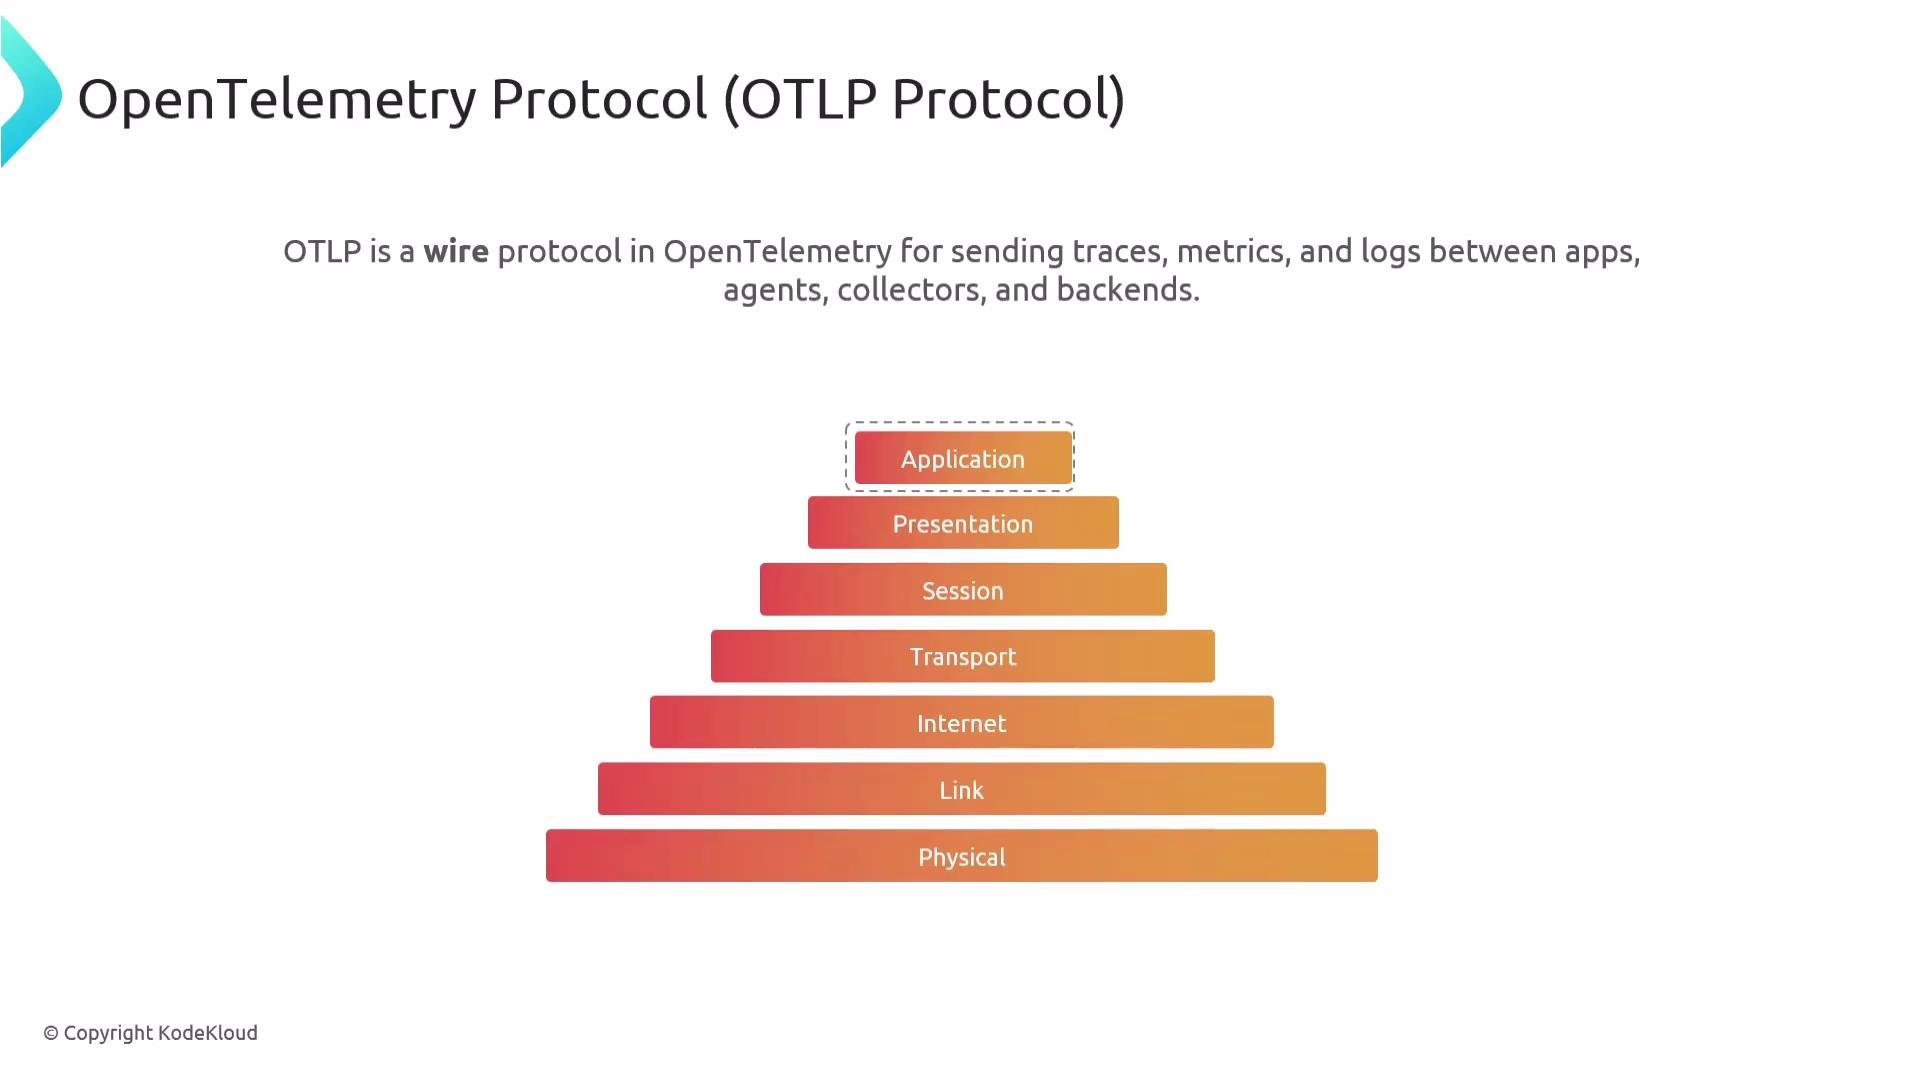 OTLP is signal-agnostic: the same structural approach applies to traces, metrics, and logs. Typical transports are gRPC (preferred) and HTTP (Protobuf over HTTP; some mappings support JSON).
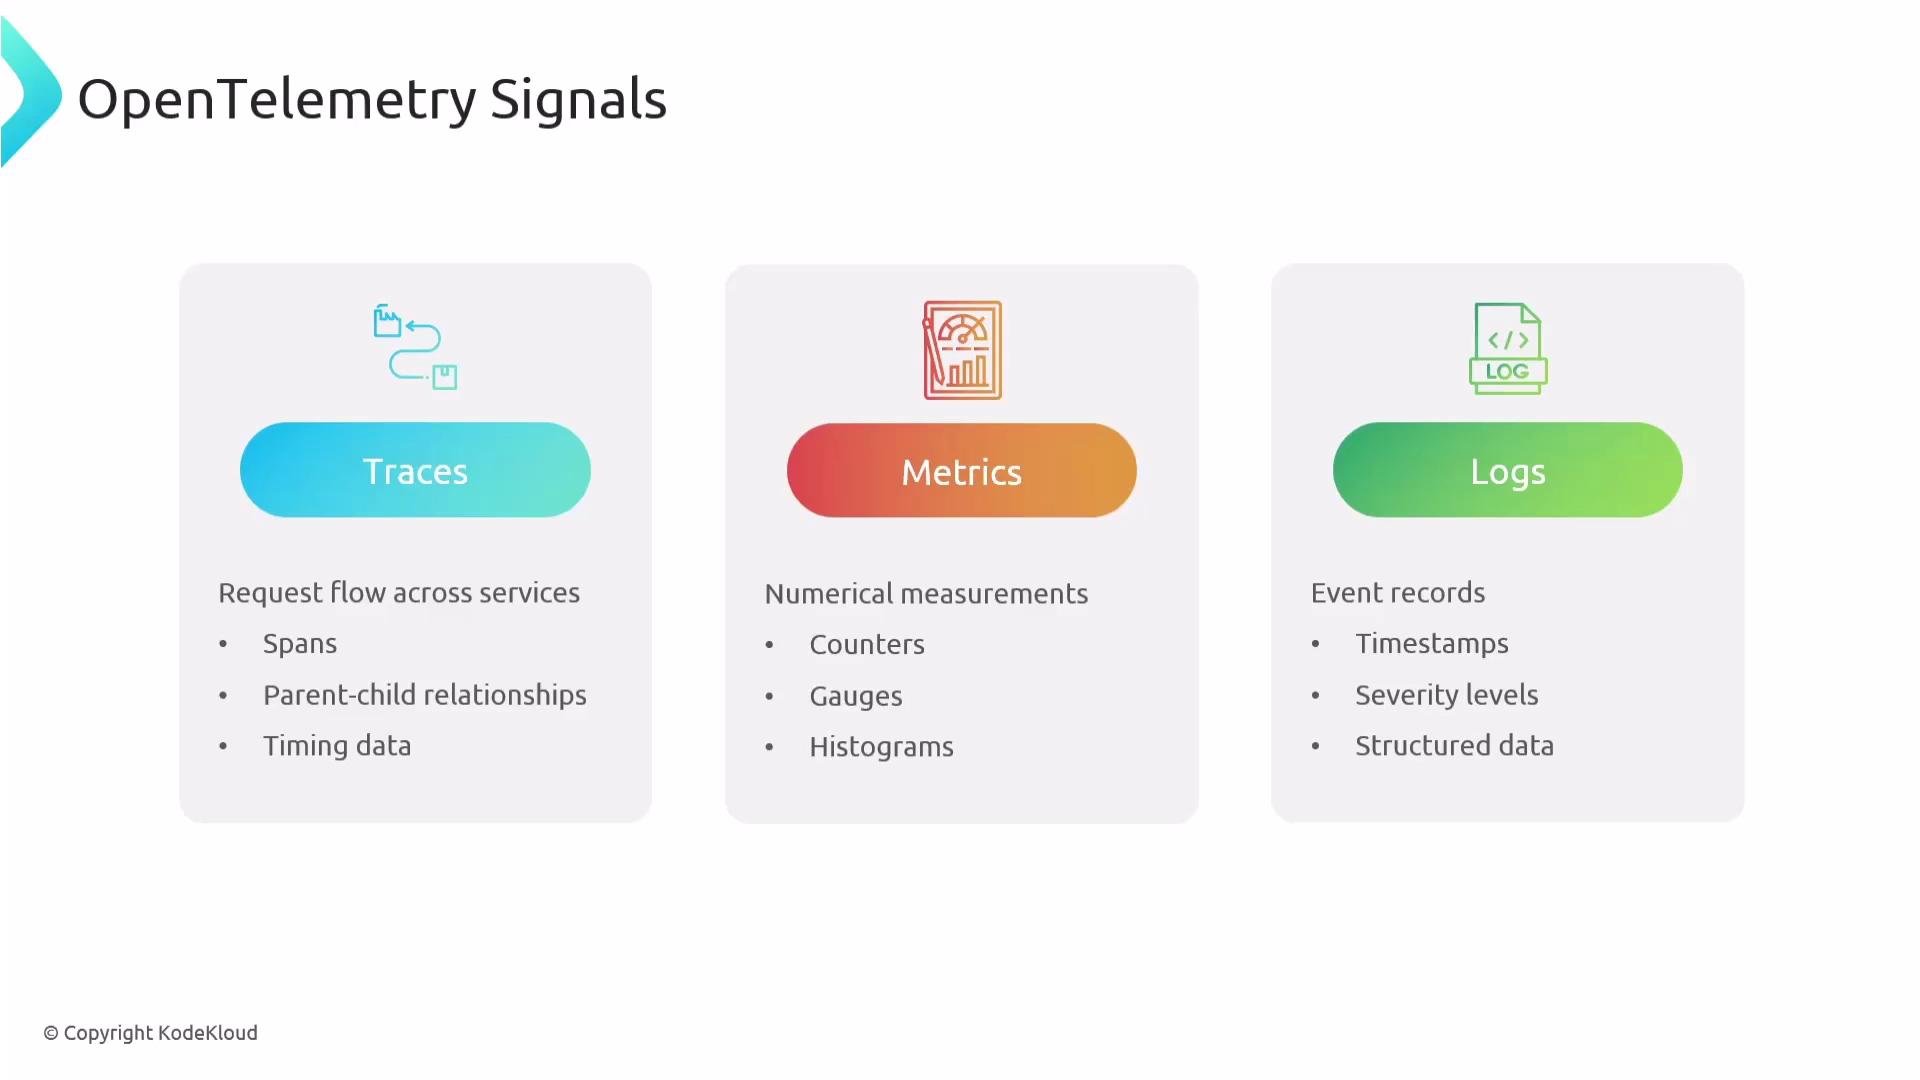
Primary OpenTelemetry signals
* Traces: spans representing operations and distributed request flows.
* Metrics: numerical measurements like counters, gauges, and histograms.
* Logs: timestamped event records with severity and structured fields.
OTLP is signal-agnostic: the same structural approach applies to traces, metrics, and logs. Typical transports are gRPC (preferred) and HTTP (Protobuf over HTTP; some mappings support JSON).
Primary OpenTelemetry signals
* Traces: spans representing operations and distributed request flows.
* Metrics: numerical measurements like counters, gauges, and histograms.
* Logs: timestamped event records with severity and structured fields.
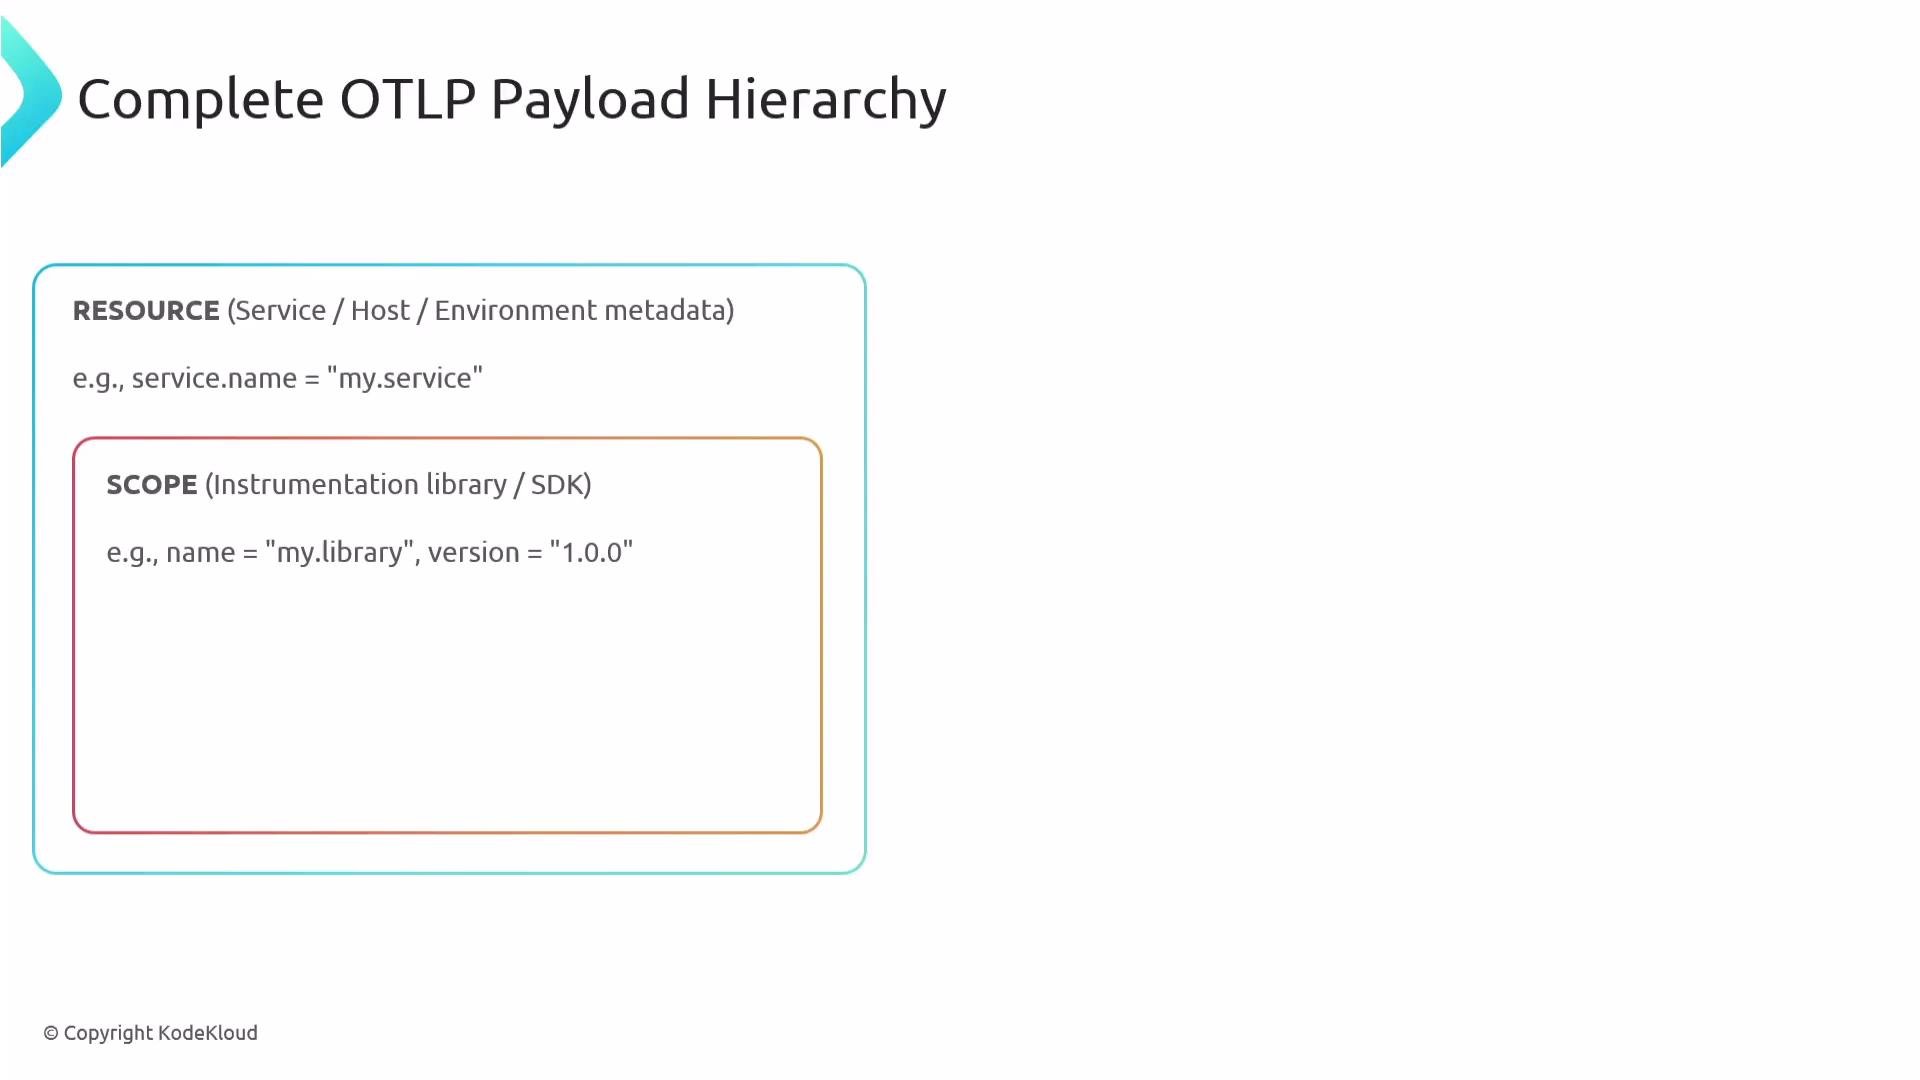
 OTLP payload hierarchy
Before transport, telemetry is organized into a consistent hierarchy so every record carries both the data and the context that produced it. The hierarchy is:
1. Resource — describes the entity producing telemetry (service name, host, deployment, etc.).
2. Instrumentation Scope — identifies the library or instrumentation (name + version) that generated the signal.
3. Signal Data — the actual spans, metric points, or log records.
All OTLP payloads follow this structure so telemetry is self-describing and portable across backends.
Resource attributes
* Set at initialization (TracerProvider, MeterProvider) and treated as immutable for emitted telemetry.
* Typical attributes: `service.name`, `service.version`, `host.name`, `k8s.namespace.name`, cloud metadata, etc.
Example resource attributes (YAML):
```yaml theme={null}
k8s.namespace.name: "production"
k8s.deployment.name: "checkout-service"
k8s.pod.name: "checkout-service-7d9f8"
container.name: "checkout-api"
container.image.name: "checkout-service"
process.pid: 1234
process.executable.name: "java"
process.command_line: "java -jar app.jar"
```
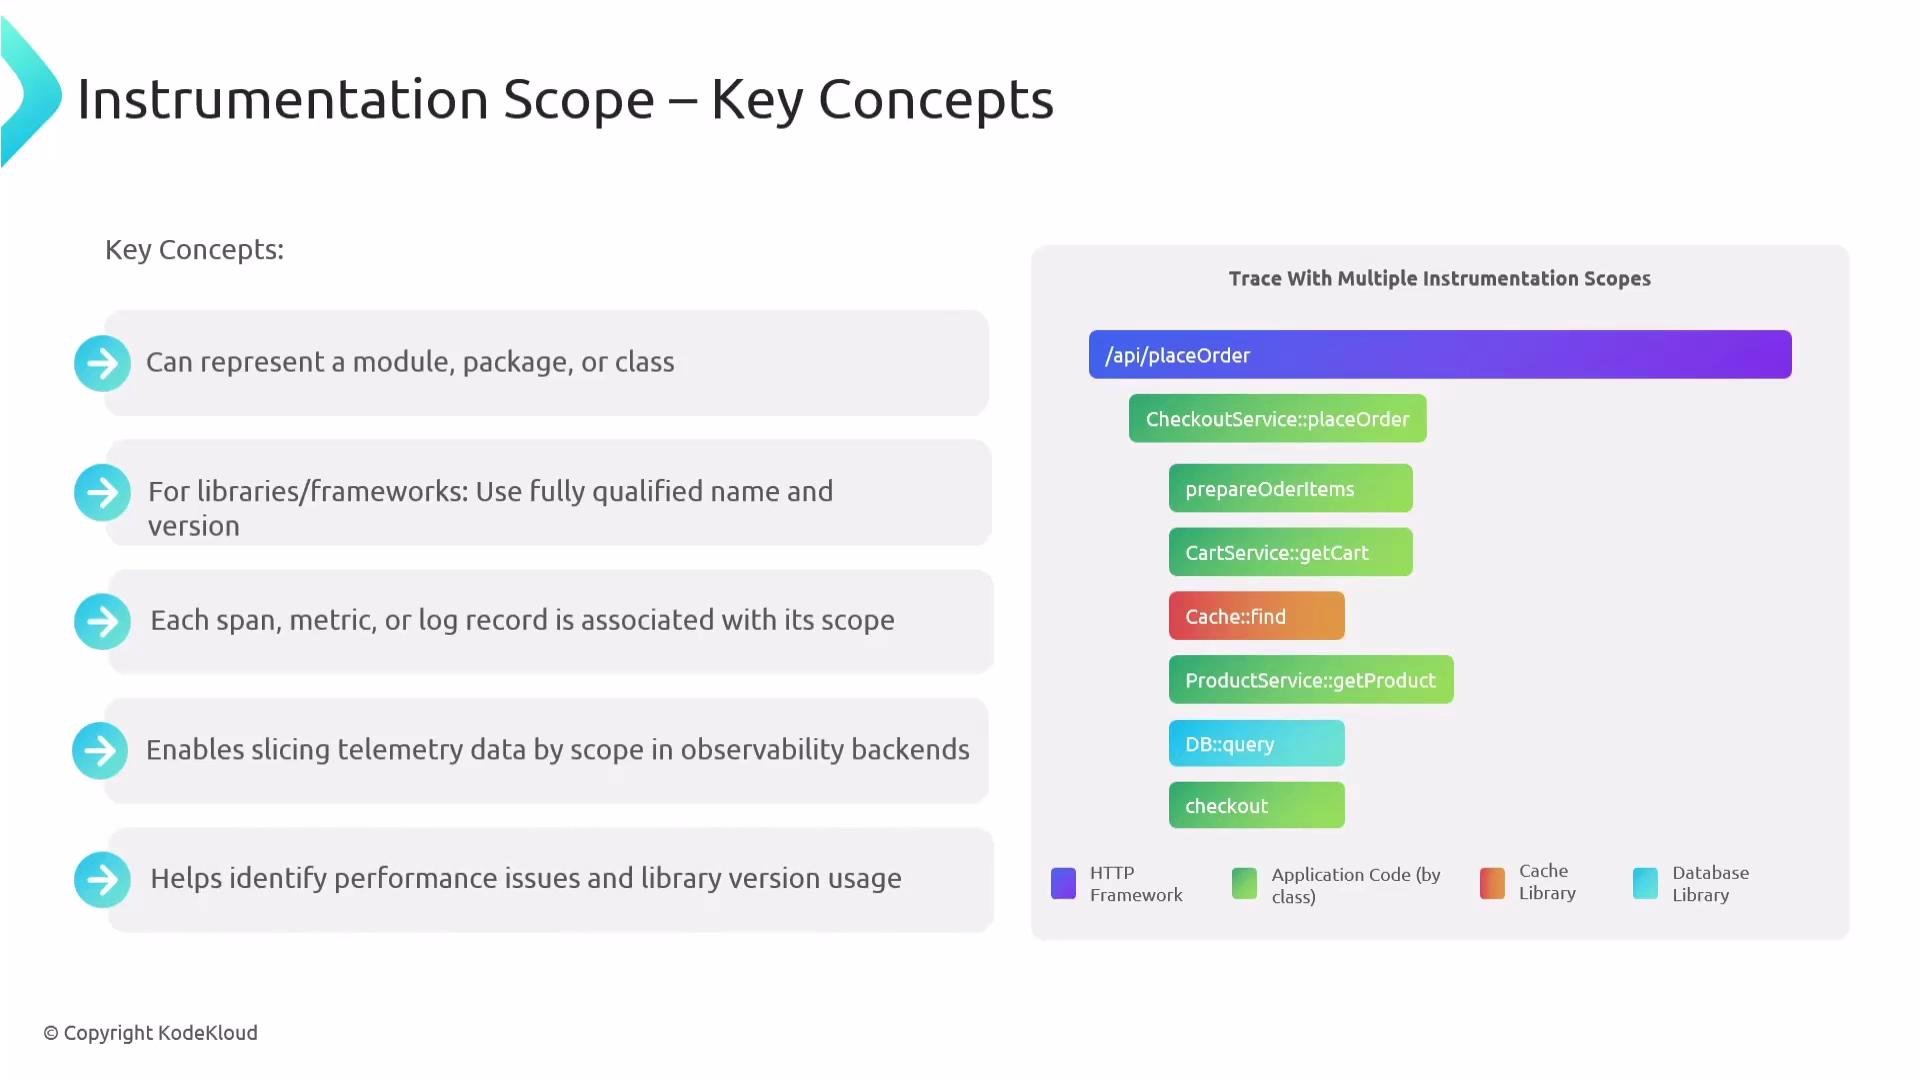
Instrumentation scope
* Ties telemetry to the library or module that produced it (`name` + `version`).
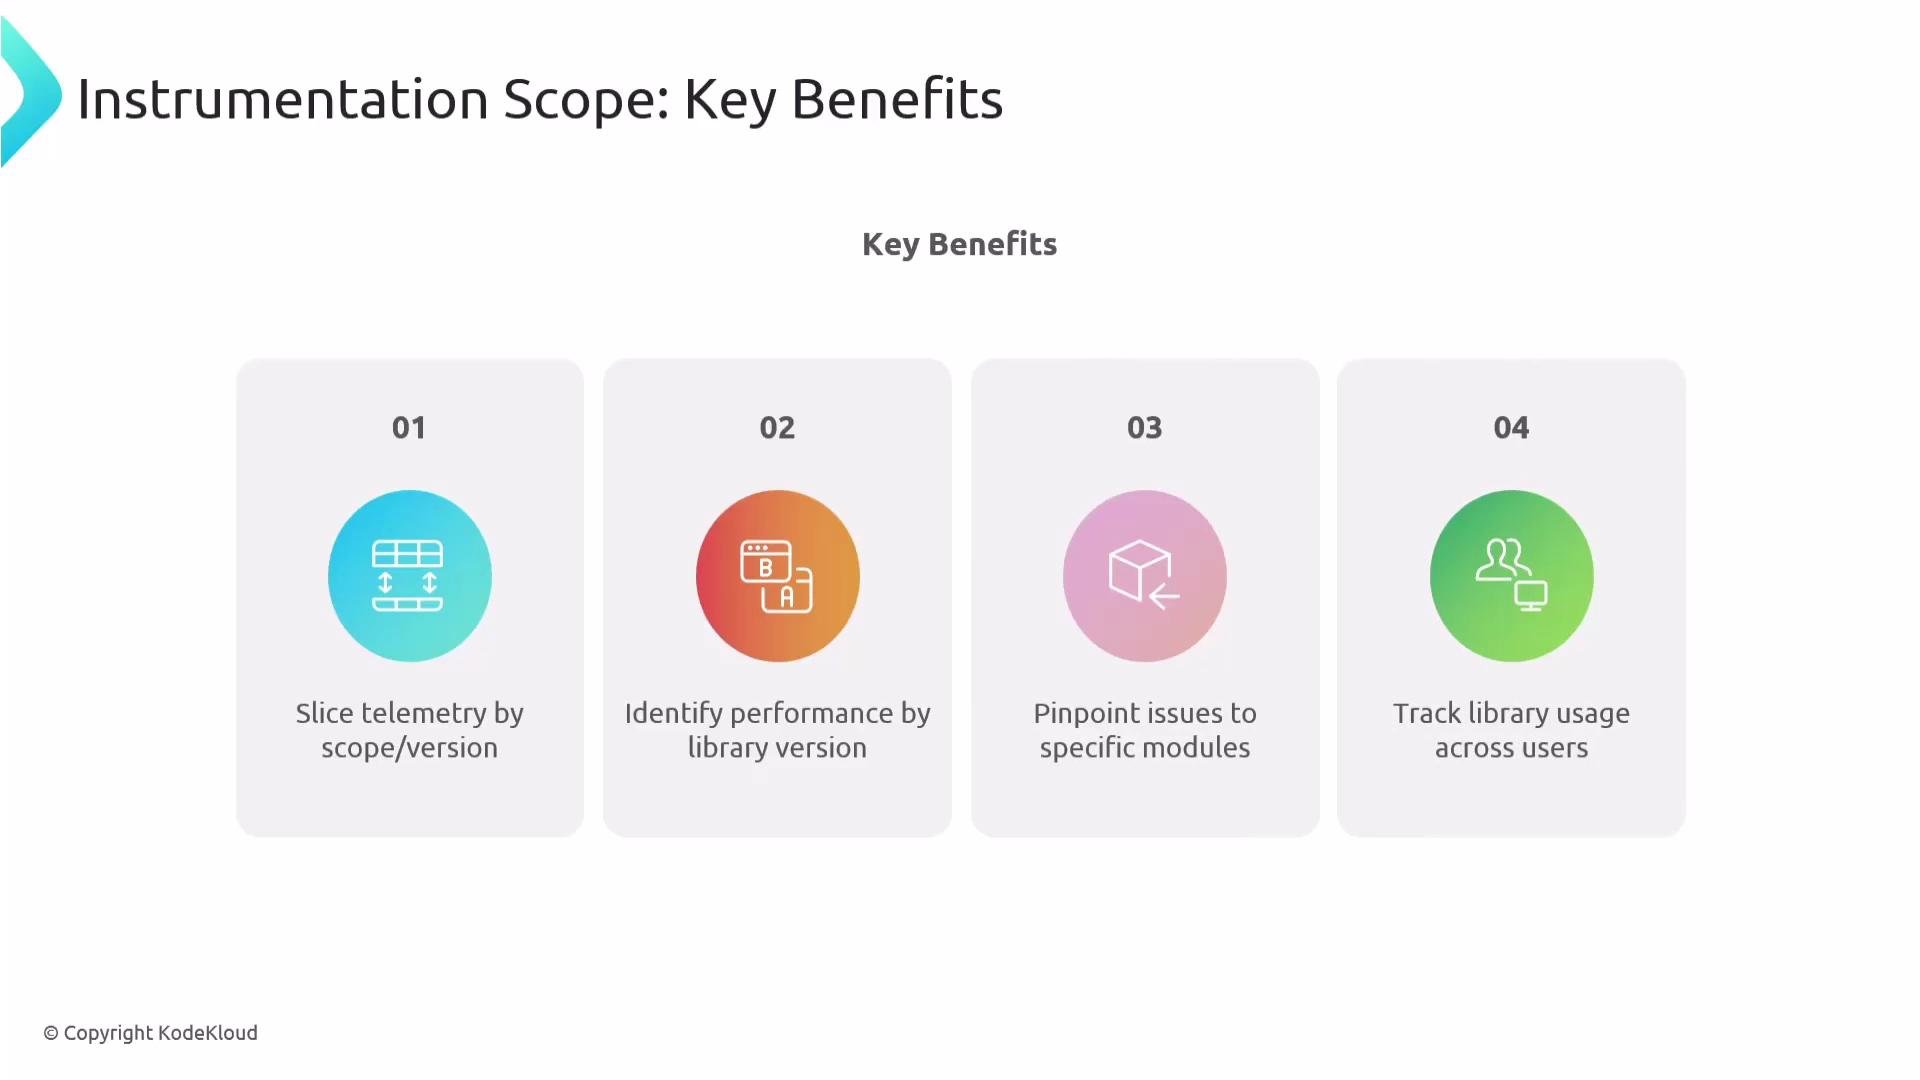
* Useful for slicing by library usage, finding regressions, or tracking adoption.
OTLP payload hierarchy
Before transport, telemetry is organized into a consistent hierarchy so every record carries both the data and the context that produced it. The hierarchy is:
1. Resource — describes the entity producing telemetry (service name, host, deployment, etc.).
2. Instrumentation Scope — identifies the library or instrumentation (name + version) that generated the signal.
3. Signal Data — the actual spans, metric points, or log records.
All OTLP payloads follow this structure so telemetry is self-describing and portable across backends.
Resource attributes
* Set at initialization (TracerProvider, MeterProvider) and treated as immutable for emitted telemetry.
* Typical attributes: `service.name`, `service.version`, `host.name`, `k8s.namespace.name`, cloud metadata, etc.
Example resource attributes (YAML):
```yaml theme={null}
k8s.namespace.name: "production"
k8s.deployment.name: "checkout-service"
k8s.pod.name: "checkout-service-7d9f8"
container.name: "checkout-api"
container.image.name: "checkout-service"
process.pid: 1234
process.executable.name: "java"
process.command_line: "java -jar app.jar"
```
Instrumentation scope
* Ties telemetry to the library or module that produced it (`name` + `version`).
* Useful for slicing by library usage, finding regressions, or tracking adoption.
 Instrumentation scope example (JSON):
```json theme={null}
{
"scope": {
"name": "redis-lib",
"version": "5.3.0"
},
"spans": [
{
"name": "Cache::find",
"scope": {
"name": "redis-lib",
"version": "5.3.0"
}
}
]
}
```
Benefits of instrumentation scopes include easier attribution of telemetry to specific libraries, quicker root-cause analysis, and version-aware performance tracking.
Instrumentation scope example (JSON):
```json theme={null}
{
"scope": {
"name": "redis-lib",
"version": "5.3.0"
},
"spans": [
{
"name": "Cache::find",
"scope": {
"name": "redis-lib",
"version": "5.3.0"
}
}
]
}
```
Benefits of instrumentation scopes include easier attribution of telemetry to specific libraries, quicker root-cause analysis, and version-aware performance tracking.
 Signal data examples
* Traces: collections of spans (traceId, spanId, timestamps, kind, attributes, events).
* Metrics: data points with timestamps, values, and aggregation metadata.
* Logs: structured log records with severity, timestamp, and attributes.
Example span (JSON):
```json theme={null}
{
"spans": [
{
"traceId": "58BEFFF79803810D269B633813FC60DC",
"spanId": "EEE197BEC3C1B174",
"name": "I'm a server span",
"kind": 2,
"attributes": [
{
"key": "my.span.attr",
"value": { "stringValue": "some value" }
}
]
}
]
}
```
Complete OTLP payloads combine resource, scope, and signal data in nested structures so each emitted record carries both who produced it and what was produced.
Signal data examples
* Traces: collections of spans (traceId, spanId, timestamps, kind, attributes, events).
* Metrics: data points with timestamps, values, and aggregation metadata.
* Logs: structured log records with severity, timestamp, and attributes.
Example span (JSON):
```json theme={null}
{
"spans": [
{
"traceId": "58BEFFF79803810D269B633813FC60DC",
"spanId": "EEE197BEC3C1B174",
"name": "I'm a server span",
"kind": 2,
"attributes": [
{
"key": "my.span.attr",
"value": { "stringValue": "some value" }
}
]
}
]
}
```
Complete OTLP payloads combine resource, scope, and signal data in nested structures so each emitted record carries both who produced it and what was produced.
 Example OTLP payload rendered in JSON (simplified):
```json theme={null}
{
"resourceSpans": [
{
"resource": {
"attributes": [
{
"key": "service.name",
"value": { "stringValue": "my.service" }
}
]
},
"scopeSpans": [
{
"scope": { "name": "my.library", "version": "1.0.0" },
"spans": [
{
"name": "I'm a server span",
"kind": 2,
"traceId": "58BEFFF79803810D269B633813FC60DC",
"spanId": "EEE197BEC3C1B174"
}
]
}
]
}
]
}
```
Serialization and transport
* OTLP structures are compiled to Protobuf messages and serialized into compact binary form.
* Protobuf yields smaller payloads and faster parsing than text formats.
* Protobuf supports schema evolution: new optional fields can be added without breaking older clients (unknown fields are ignored).
Example (hex view of a small Protobuf-serialized payload fragment):
```text theme={null}
0x0A 0x12 0x08 0x74 0x72 0x61 0x63 0x65
0x73 0x12 0x3F 0x0A 0x1D 0x0A 0x0C 0x73
```
Comparison: common OTLP transports
| Transport | Typical Encoding | Use Cases |
| --------- | --------------------------------------------- | --------------------------------------------------------------------------------------------------------------- |
| gRPC | Protobuf (binary) | Preferred for high-throughput, low-latency telemetry (supports streaming, deadlines, and built-in compression). |
| HTTP | Protobuf over HTTP (or JSON in some mappings) | Simpler setups, easier to route through HTTP infrastructure or when gRPC is not available. |
Best practices
* Prefer gRPC for production telemetry if your stack supports it.
* Attach stable resource attributes (`service.name`, `service.version`) at startup to ensure consistent attribution.
* Use the OpenTelemetry Collector to centralize processing (batching, sampling, enrichment) and flexible export to backends.
* Instrumentation scopes help identify problematic libraries and track upgrades or regressions.
When designing telemetry pipelines, avoid embedding volatile identifiers (like pod names) as the only way to identify a service — rely on stable resource attributes (e.g., `service.name`) and add volatile metadata separately if needed.
Summary
OTLP is a signal-agnostic, Protobuf-based wire protocol that standardizes how traces, metrics, and logs are represented and transported. By combining resource attributes, instrumentation scope, and signal data into a nested, self-describing payload, OTLP makes telemetry portable and interoperable across instrumentation, collectors, and backends. Use the OpenTelemetry Collector and OTLP to decouple your instrumentation from vendor-specific formats and to build a flexible observability pipeline.
Example OTLP payload rendered in JSON (simplified):
```json theme={null}
{
"resourceSpans": [
{
"resource": {
"attributes": [
{
"key": "service.name",
"value": { "stringValue": "my.service" }
}
]
},
"scopeSpans": [
{
"scope": { "name": "my.library", "version": "1.0.0" },
"spans": [
{
"name": "I'm a server span",
"kind": 2,
"traceId": "58BEFFF79803810D269B633813FC60DC",
"spanId": "EEE197BEC3C1B174"
}
]
}
]
}
]
}
```
Serialization and transport
* OTLP structures are compiled to Protobuf messages and serialized into compact binary form.
* Protobuf yields smaller payloads and faster parsing than text formats.
* Protobuf supports schema evolution: new optional fields can be added without breaking older clients (unknown fields are ignored).
Example (hex view of a small Protobuf-serialized payload fragment):
```text theme={null}
0x0A 0x12 0x08 0x74 0x72 0x61 0x63 0x65
0x73 0x12 0x3F 0x0A 0x1D 0x0A 0x0C 0x73
```
Comparison: common OTLP transports
| Transport | Typical Encoding | Use Cases |
| --------- | --------------------------------------------- | --------------------------------------------------------------------------------------------------------------- |
| gRPC | Protobuf (binary) | Preferred for high-throughput, low-latency telemetry (supports streaming, deadlines, and built-in compression). |
| HTTP | Protobuf over HTTP (or JSON in some mappings) | Simpler setups, easier to route through HTTP infrastructure or when gRPC is not available. |
Best practices
* Prefer gRPC for production telemetry if your stack supports it.
* Attach stable resource attributes (`service.name`, `service.version`) at startup to ensure consistent attribution.
* Use the OpenTelemetry Collector to centralize processing (batching, sampling, enrichment) and flexible export to backends.
* Instrumentation scopes help identify problematic libraries and track upgrades or regressions.
When designing telemetry pipelines, avoid embedding volatile identifiers (like pod names) as the only way to identify a service — rely on stable resource attributes (e.g., `service.name`) and add volatile metadata separately if needed.
Summary
OTLP is a signal-agnostic, Protobuf-based wire protocol that standardizes how traces, metrics, and logs are represented and transported. By combining resource attributes, instrumentation scope, and signal data into a nested, self-describing payload, OTLP makes telemetry portable and interoperable across instrumentation, collectors, and backends. Use the OpenTelemetry Collector and OTLP to decouple your instrumentation from vendor-specific formats and to build a flexible observability pipeline.