> ## Documentation Index
> Fetch the complete documentation index at: https://notes.kodekloud.com/llms.txt
> Use this file to discover all available pages before exploring further.
# Demo OpenTelemetry Operator Auto Instrumentation
> Walkthrough to enable automatic OpenTelemetry instrumentation for a Python Flask app in Kubernetes using the OpenTelemetry Operator, Collector, and Jaeger to capture and verify traces.
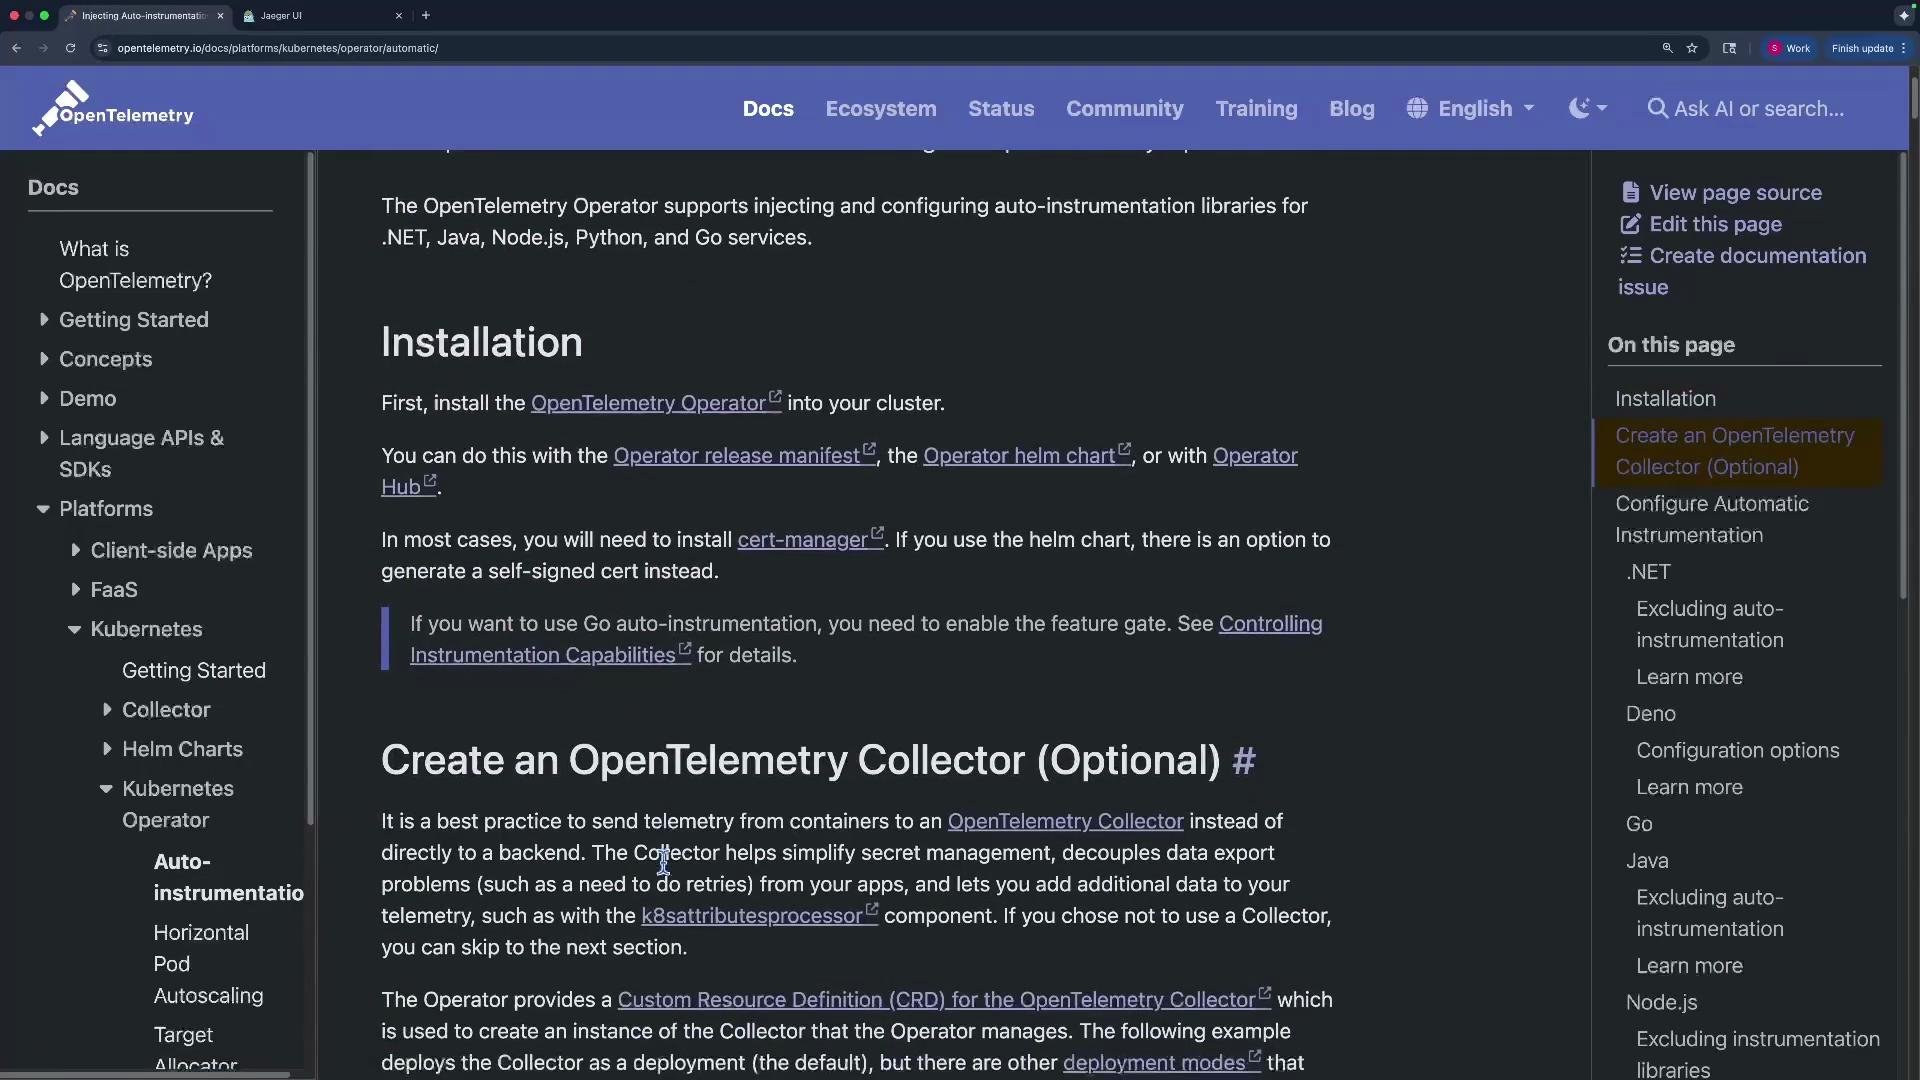
This walkthrough demonstrates how to enable automatic OpenTelemetry instrumentation for a Python Flask application using the OpenTelemetry Operator and Collector in Kubernetes. The operator can inject language-specific auto-instrumentation into pods so you don't need to modify application code.
What you’ll do:
* Deploy an Instrumentation custom resource (CR) to configure auto-instrumentation.
* Annotate a Deployment to opt the pod into Python auto-instrumentation.
* Generate traffic and verify traces in Jaeger.
Prerequisites:
* A Kubernetes cluster (e.g., kind, GKE, EKS).
* OpenTelemetry Operator and an OpenTelemetry Collector deployed in the cluster.
* A tracing backend such as Jaeger.
For operator installation and examples, see the OpenTelemetry operator docs:
[https://opentelemetry.io/docs/operator/](https://opentelemetry.io/docs/operator/)
 ## Sample Flask application (no manual instrumentation)
Save this Flask app as `app.py` (this example contains no OpenTelemetry code):
```python theme={null}
import time
import random
from flask import Flask
app = Flask(__name__)
@app.get("/")
def get_products():
time.sleep(random.uniform(0.02, 0.08))
return "Get All Products"
if __name__ == "__main__":
app.run(host="0.0.0.0", port=5000)
```
Because the app is uninstrumented, the operator will inject auto-instrumentation at pod startup.
## Verify cluster components
Confirm nodes and that the Collector pod and operator are running:
```bash theme={null}
kubectl get node -o wide
# Example output:
# NAME STATUS ROLES AGE VERSION INTERNAL-IP EXTERNAL-IP OS-IMAGE
# kind-control-plane Ready control-plane 56m v1.23.1 192.168.97.3 Debian GNU/Linux 12 (bookworm)
# kind-worker Ready 56m v1.23.1 192.168.97.4 Debian GNU/Linux 12 (bookworm)
# kind-worker2 Ready 56m v1.23.1 192.168.97.2 Debian GNU/Linux 12 (bookworm)
```
## Create the Instrumentation CR
Create an Instrumentation resource to tell the operator:
* which exporter endpoint to use (Collector HTTP OTLP/4318),
* which context propagators to enable,
* the sampling strategy.
Save as `instrumentation.yaml`:
```yaml theme={null}
apiVersion: opentelemetry.io/v1alpha1
kind: Instrumentation
metadata:
name: python-instrumentation
spec:
exporter:
endpoint: http://my-collector-collector:4318
propagators:
- tracecontext
- baggage
sampler:
type: parentbased_traceidratio
argument: "1"
```
Key fields explained:
| Field | Purpose | Example |
| ------------------- | ----------------------------------------------------------------- | --------------------------------------------------------------- |
| `exporter.endpoint` | Collector HTTP endpoint where auto-instrumented telemetry is sent | `http://my-collector-collector:4318` |
| `propagators` | Context propagation formats to support | `tracecontext`, `baggage` |
| `sampler` | Sampling strategy for generated traces | `type: parentbased_traceidratio`, `argument: "1"` (sample 100%) |
Apply the Instrumentation CR:
```bash theme={null}
kubectl apply -f instrumentation.yaml
# Expected:
# instrumentation.opentelemetry.io/python-instrumentation created
```
Confirm pods (operator, Collector, Jaeger, app):
```bash theme={null}
kubectl get pod
# Example output:
# NAME READY STATUS RESTARTS AGE
# jaeger-75f7bdcc4-srv6 1/1 Running 0 58m
# my-collector-collector-dd46d98c-kpg4n 1/1 Running 0 5m7s
# my-opentelemetry-operator-77fcd668d-54258 2/2 Running 0 12m
# myapp-5d474bfa96-nz8c2 1/1 Running 0 3m11s
```
## Opt your Deployment into auto-instrumentation
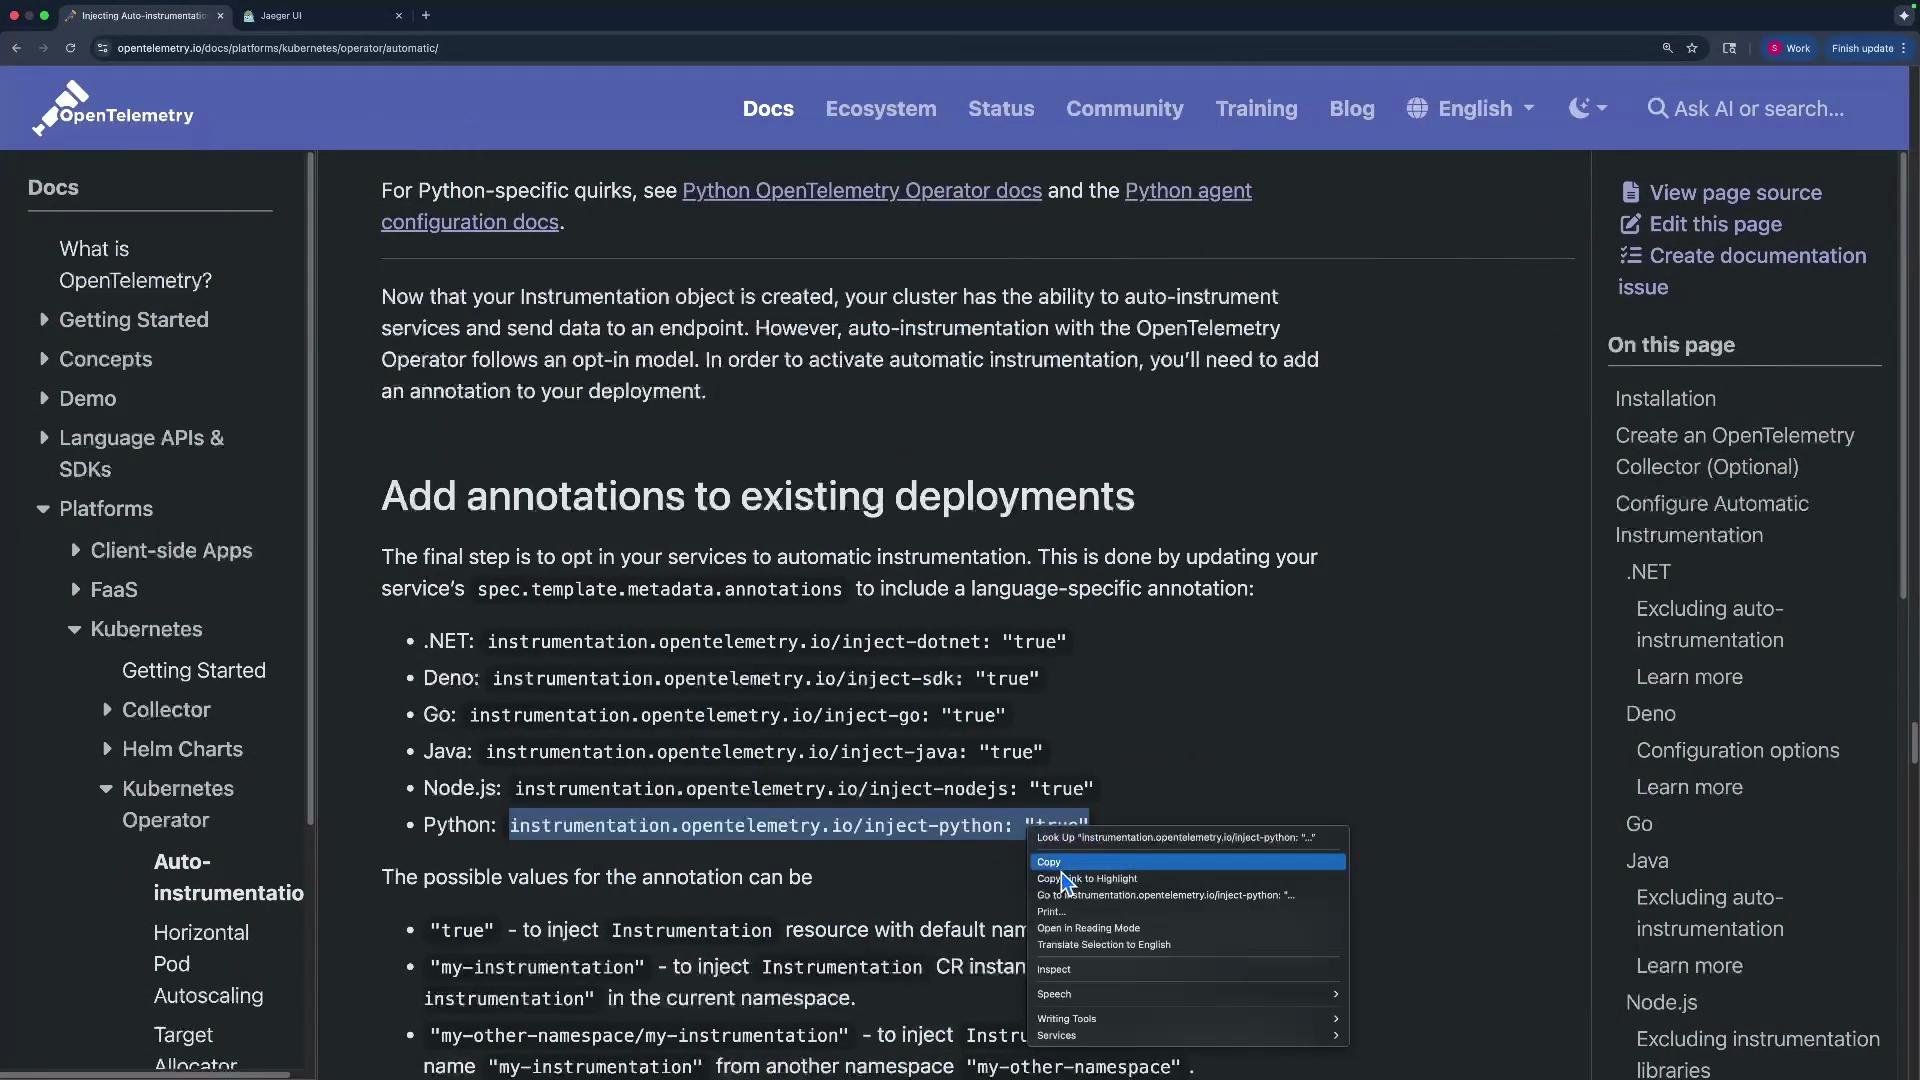
To enable Python auto-instrumentation for a Deployment, add the annotation `instrumentation.opentelemetry.io/inject-python: "true"` to the pod template. You can also reference a specific Instrumentation CR by name (e.g., `"python-instrumentation"`) or use cross-namespace format (`"other-namespace/my-instrumentation"`).
Add `instrumentation.opentelemetry.io/inject-python: "true"` to your Deployment pod template to enable Python auto-instrumentation. You may also set the annotation value to the Instrumentation CR name to bind to a specific configuration.
The operator documentation lists language-specific annotation options for other runtimes as well.
## Sample Flask application (no manual instrumentation)
Save this Flask app as `app.py` (this example contains no OpenTelemetry code):
```python theme={null}
import time
import random
from flask import Flask
app = Flask(__name__)
@app.get("/")
def get_products():
time.sleep(random.uniform(0.02, 0.08))
return "Get All Products"
if __name__ == "__main__":
app.run(host="0.0.0.0", port=5000)
```
Because the app is uninstrumented, the operator will inject auto-instrumentation at pod startup.
## Verify cluster components
Confirm nodes and that the Collector pod and operator are running:
```bash theme={null}
kubectl get node -o wide
# Example output:
# NAME STATUS ROLES AGE VERSION INTERNAL-IP EXTERNAL-IP OS-IMAGE
# kind-control-plane Ready control-plane 56m v1.23.1 192.168.97.3 Debian GNU/Linux 12 (bookworm)
# kind-worker Ready 56m v1.23.1 192.168.97.4 Debian GNU/Linux 12 (bookworm)
# kind-worker2 Ready 56m v1.23.1 192.168.97.2 Debian GNU/Linux 12 (bookworm)
```
## Create the Instrumentation CR
Create an Instrumentation resource to tell the operator:
* which exporter endpoint to use (Collector HTTP OTLP/4318),
* which context propagators to enable,
* the sampling strategy.
Save as `instrumentation.yaml`:
```yaml theme={null}
apiVersion: opentelemetry.io/v1alpha1
kind: Instrumentation
metadata:
name: python-instrumentation
spec:
exporter:
endpoint: http://my-collector-collector:4318
propagators:
- tracecontext
- baggage
sampler:
type: parentbased_traceidratio
argument: "1"
```
Key fields explained:
| Field | Purpose | Example |
| ------------------- | ----------------------------------------------------------------- | --------------------------------------------------------------- |
| `exporter.endpoint` | Collector HTTP endpoint where auto-instrumented telemetry is sent | `http://my-collector-collector:4318` |
| `propagators` | Context propagation formats to support | `tracecontext`, `baggage` |
| `sampler` | Sampling strategy for generated traces | `type: parentbased_traceidratio`, `argument: "1"` (sample 100%) |
Apply the Instrumentation CR:
```bash theme={null}
kubectl apply -f instrumentation.yaml
# Expected:
# instrumentation.opentelemetry.io/python-instrumentation created
```
Confirm pods (operator, Collector, Jaeger, app):
```bash theme={null}
kubectl get pod
# Example output:
# NAME READY STATUS RESTARTS AGE
# jaeger-75f7bdcc4-srv6 1/1 Running 0 58m
# my-collector-collector-dd46d98c-kpg4n 1/1 Running 0 5m7s
# my-opentelemetry-operator-77fcd668d-54258 2/2 Running 0 12m
# myapp-5d474bfa96-nz8c2 1/1 Running 0 3m11s
```
## Opt your Deployment into auto-instrumentation
To enable Python auto-instrumentation for a Deployment, add the annotation `instrumentation.opentelemetry.io/inject-python: "true"` to the pod template. You can also reference a specific Instrumentation CR by name (e.g., `"python-instrumentation"`) or use cross-namespace format (`"other-namespace/my-instrumentation"`).
Add `instrumentation.opentelemetry.io/inject-python: "true"` to your Deployment pod template to enable Python auto-instrumentation. You may also set the annotation value to the Instrumentation CR name to bind to a specific configuration.
The operator documentation lists language-specific annotation options for other runtimes as well.
 ## Deployment and Service (example)
Save this Deployment + Service as `flask_deployment.yaml`. It includes the Python injection annotation and exposes the app via a NodePort.
```yaml theme={null}
apiVersion: apps/v1
kind: Deployment
metadata:
name: myapp-api
spec:
selector:
matchLabels:
app: myapp-api
template:
metadata:
annotations:
instrumentation.opentelemetry.io/inject-python: "true"
labels:
app: myapp-api
spec:
containers:
- name: myapp
image: sloppynetworks/traces-auto-py
imagePullPolicy: Always
ports:
- containerPort: 5000
---
apiVersion: v1
kind: Service
metadata:
name: myapp-api-service
labels:
app: myapp-api
spec:
selector:
app: myapp-api
ports:
- port: 5000
targetPort: 5000
nodePort: 30008
type: NodePort
```
Apply the Deployment and Service:
```bash theme={null}
kubectl apply -f flask_deployment.yaml
# Expected:
# deployment.apps/myapp-api created
# service/myapp-api-service created
```
Confirm the new pods are running:
```bash theme={null}
kubectl get pod
# Example:
# NAME READY STATUS RESTARTS AGE
# jaeger-757fbdcc4-sr2v6 1/1 Running 0 62m
# my-collector-collector-dd46d98c6-kpg4n 1/1 Running 0 9m38s
# my-opentelemetry-operator-77fcd686bd-54258 2/2 Running 0 17m
# myapp-5d474bf946-nz8c2 1/1 Running 0 7m42s
# myapp-api-5ff7979564-vmhfl 1/1 Running 0 15s
```
Verify nodes:
```bash theme={null}
kubectl get node -o wide
# Example:
# NAME STATUS ROLES AGE VERSION CONTAINER-RUNTIME
# kind-control-plane Ready control-plane 63m v1.23.1 containerd://2.1.1
# kind-worker Ready 63m v1.23.1 containerd://2.1.1
# kind-worker2 Ready 63m v1.23.1 containerd://2.1.1
```
## Generate traffic and verify traces
Send a request to the service using a node IP and the NodePort (replace with your node IP):
```bash theme={null}
curl 192.168.97.2:30008
# Expected:
# Get All Products
```
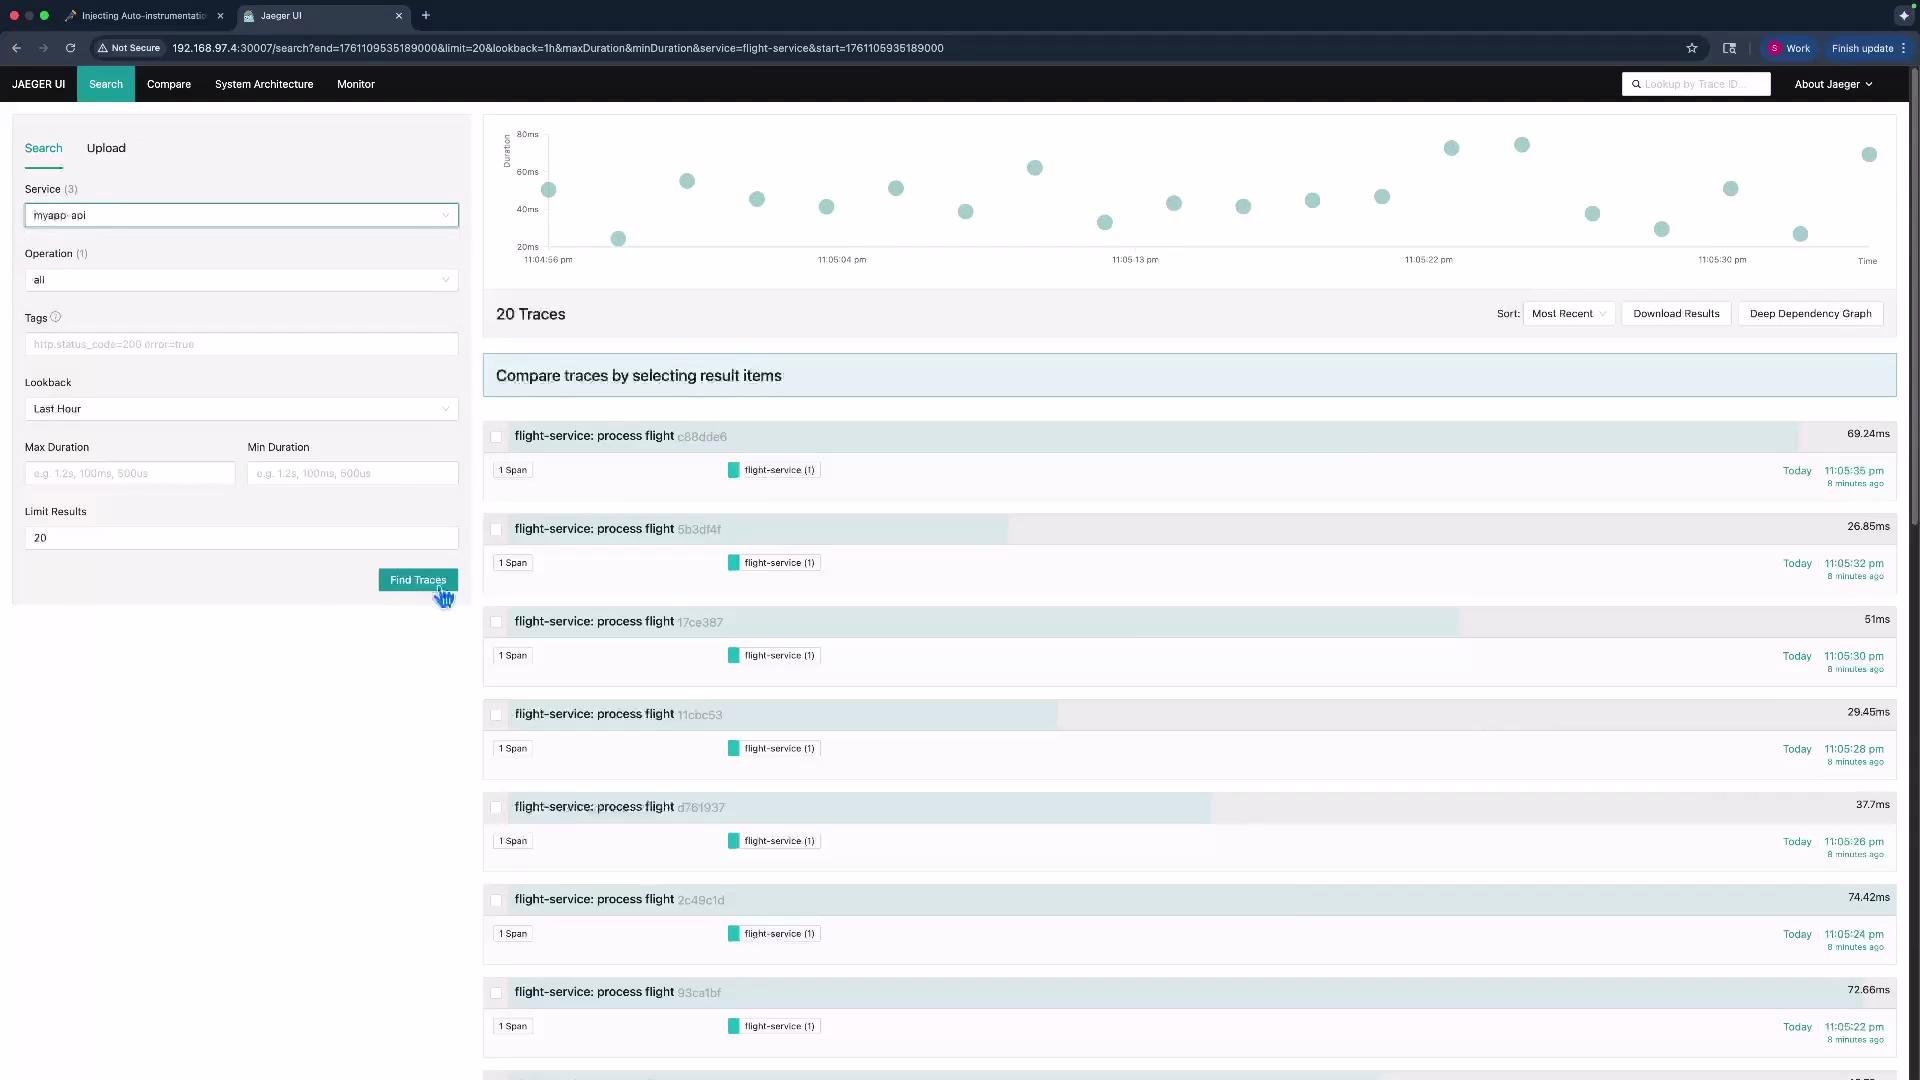
Because the operator injected the Python instrumentation and exported telemetry to the Collector, you should see traces for `myapp-api` in Jaeger. Open the Jaeger UI and refresh the traces list to locate recent traces for the service.
## Deployment and Service (example)
Save this Deployment + Service as `flask_deployment.yaml`. It includes the Python injection annotation and exposes the app via a NodePort.
```yaml theme={null}
apiVersion: apps/v1
kind: Deployment
metadata:
name: myapp-api
spec:
selector:
matchLabels:
app: myapp-api
template:
metadata:
annotations:
instrumentation.opentelemetry.io/inject-python: "true"
labels:
app: myapp-api
spec:
containers:
- name: myapp
image: sloppynetworks/traces-auto-py
imagePullPolicy: Always
ports:
- containerPort: 5000
---
apiVersion: v1
kind: Service
metadata:
name: myapp-api-service
labels:
app: myapp-api
spec:
selector:
app: myapp-api
ports:
- port: 5000
targetPort: 5000
nodePort: 30008
type: NodePort
```
Apply the Deployment and Service:
```bash theme={null}
kubectl apply -f flask_deployment.yaml
# Expected:
# deployment.apps/myapp-api created
# service/myapp-api-service created
```
Confirm the new pods are running:
```bash theme={null}
kubectl get pod
# Example:
# NAME READY STATUS RESTARTS AGE
# jaeger-757fbdcc4-sr2v6 1/1 Running 0 62m
# my-collector-collector-dd46d98c6-kpg4n 1/1 Running 0 9m38s
# my-opentelemetry-operator-77fcd686bd-54258 2/2 Running 0 17m
# myapp-5d474bf946-nz8c2 1/1 Running 0 7m42s
# myapp-api-5ff7979564-vmhfl 1/1 Running 0 15s
```
Verify nodes:
```bash theme={null}
kubectl get node -o wide
# Example:
# NAME STATUS ROLES AGE VERSION CONTAINER-RUNTIME
# kind-control-plane Ready control-plane 63m v1.23.1 containerd://2.1.1
# kind-worker Ready 63m v1.23.1 containerd://2.1.1
# kind-worker2 Ready 63m v1.23.1 containerd://2.1.1
```
## Generate traffic and verify traces
Send a request to the service using a node IP and the NodePort (replace with your node IP):
```bash theme={null}
curl 192.168.97.2:30008
# Expected:
# Get All Products
```
Because the operator injected the Python instrumentation and exported telemetry to the Collector, you should see traces for `myapp-api` in Jaeger. Open the Jaeger UI and refresh the traces list to locate recent traces for the service.
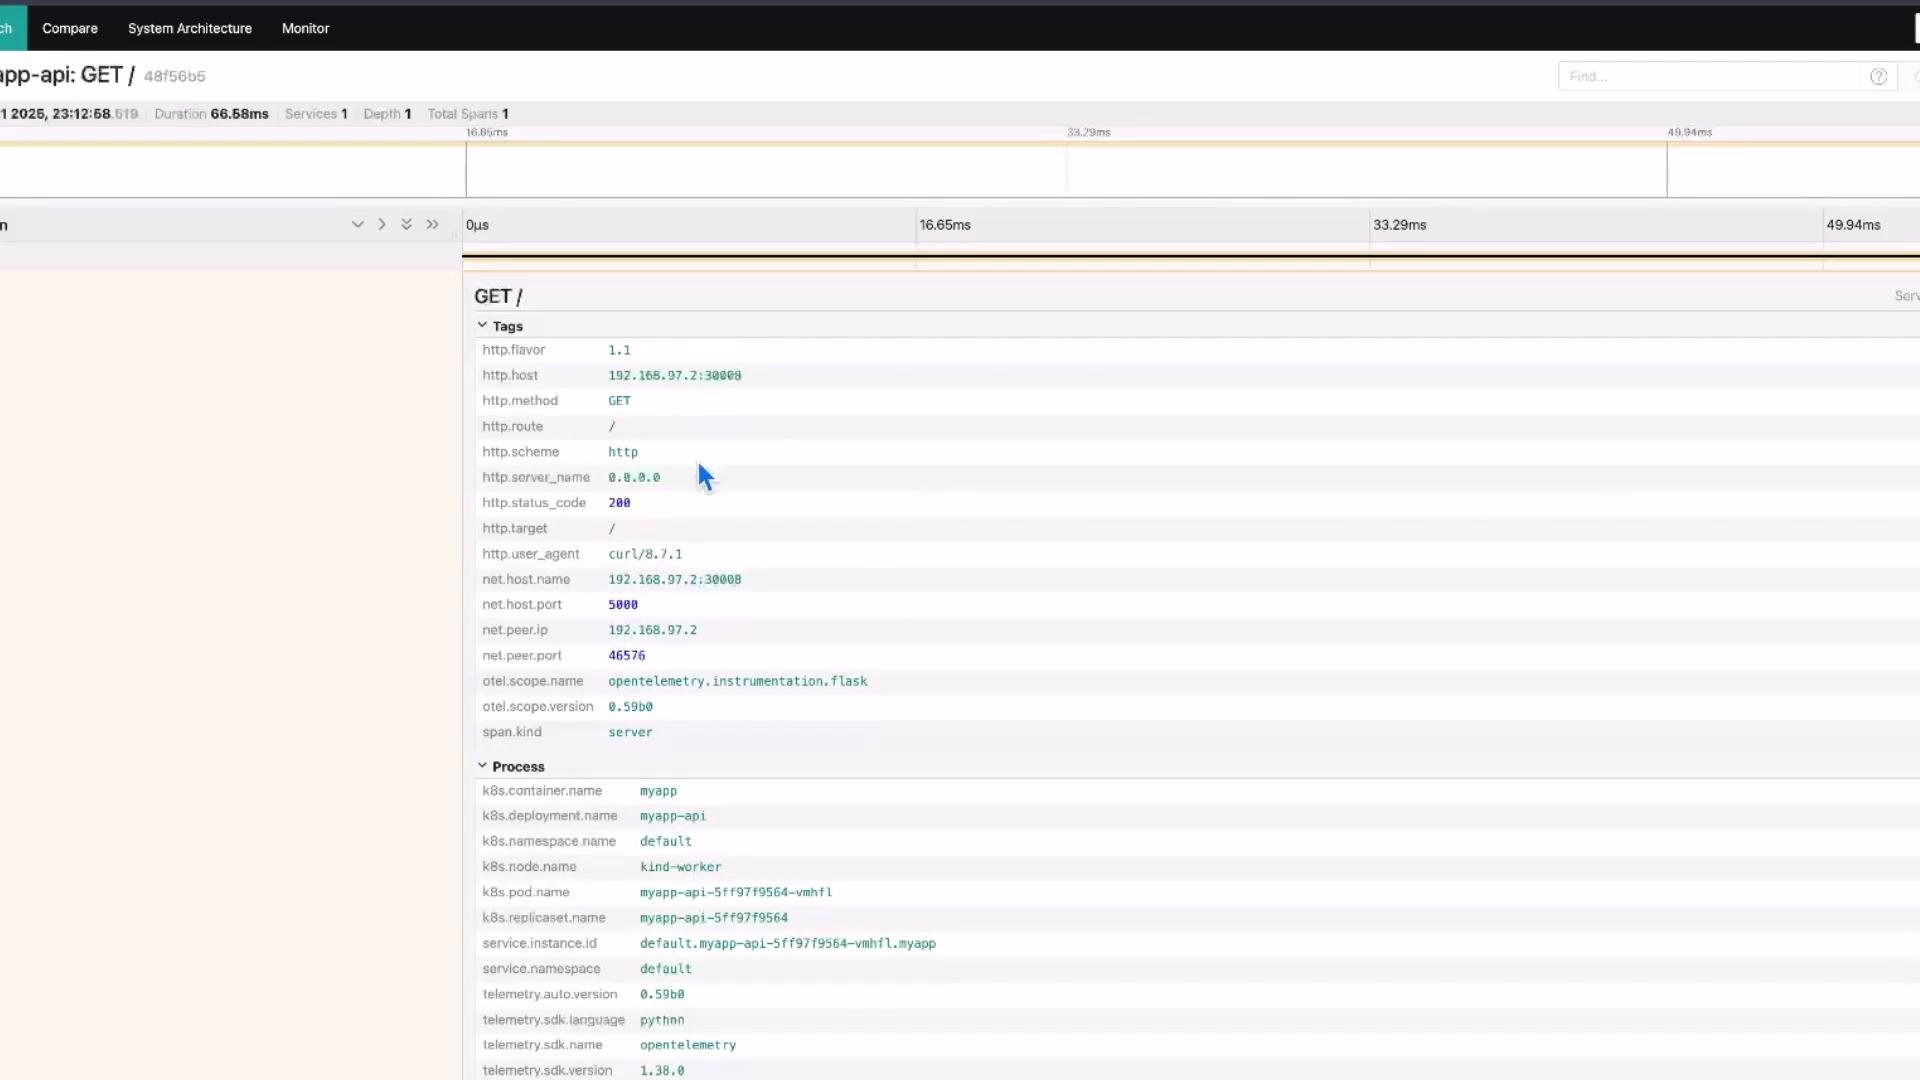
 Click a trace to inspect attributes automatically added by the instrumentation—pod name, node name, replica set, service instance, HTTP attributes, and more.
 ## Summary
Steps recap:
1. Deploy the OpenTelemetry Operator and a Collector.
2. Create an Instrumentation CR that configures exporter, propagators, and sampler.
3. Annotate your Deployment pod template to enable language-specific auto-instrumentation.
4. Generate traffic and verify traces in your tracing backend (Jaeger/Zipkin).
## Links and references
* OpenTelemetry Operator docs: [https://opentelemetry.io/docs/operator/](https://opentelemetry.io/docs/operator/)
* OpenTelemetry Python auto-instrumentation: [https://opentelemetry.io/docs/instrumentation/python/](https://opentelemetry.io/docs/instrumentation/python/)
* Jaeger UI: [https://www.jaegertracing.io/](https://www.jaegertracing.io/)
If you need help adapting this to another runtime (Java, Node.js, .NET), the operator supports language-specific annotations — see the Operator docs for details.
## Summary
Steps recap:
1. Deploy the OpenTelemetry Operator and a Collector.
2. Create an Instrumentation CR that configures exporter, propagators, and sampler.
3. Annotate your Deployment pod template to enable language-specific auto-instrumentation.
4. Generate traffic and verify traces in your tracing backend (Jaeger/Zipkin).
## Links and references
* OpenTelemetry Operator docs: [https://opentelemetry.io/docs/operator/](https://opentelemetry.io/docs/operator/)
* OpenTelemetry Python auto-instrumentation: [https://opentelemetry.io/docs/instrumentation/python/](https://opentelemetry.io/docs/instrumentation/python/)
* Jaeger UI: [https://www.jaegertracing.io/](https://www.jaegertracing.io/)
If you need help adapting this to another runtime (Java, Node.js, .NET), the operator supports language-specific annotations — see the Operator docs for details.