> ## Documentation Index
> Fetch the complete documentation index at: https://notes.kodekloud.com/llms.txt
> Use this file to discover all available pages before exploring further.
# Metrics Pipeline
> Explains OpenTelemetry metrics pipeline components and lifecycle, including MeterProvider, Meters, Instruments, Views, Readers, Exporters, exemplars, configuration and export examples for collecting and exporting telemetry.
Great work exploring the Metrics API and SDK. This lesson explains how metric data points flow through the OpenTelemetry (OTel) metrics pipeline used by APIs and SDKs.
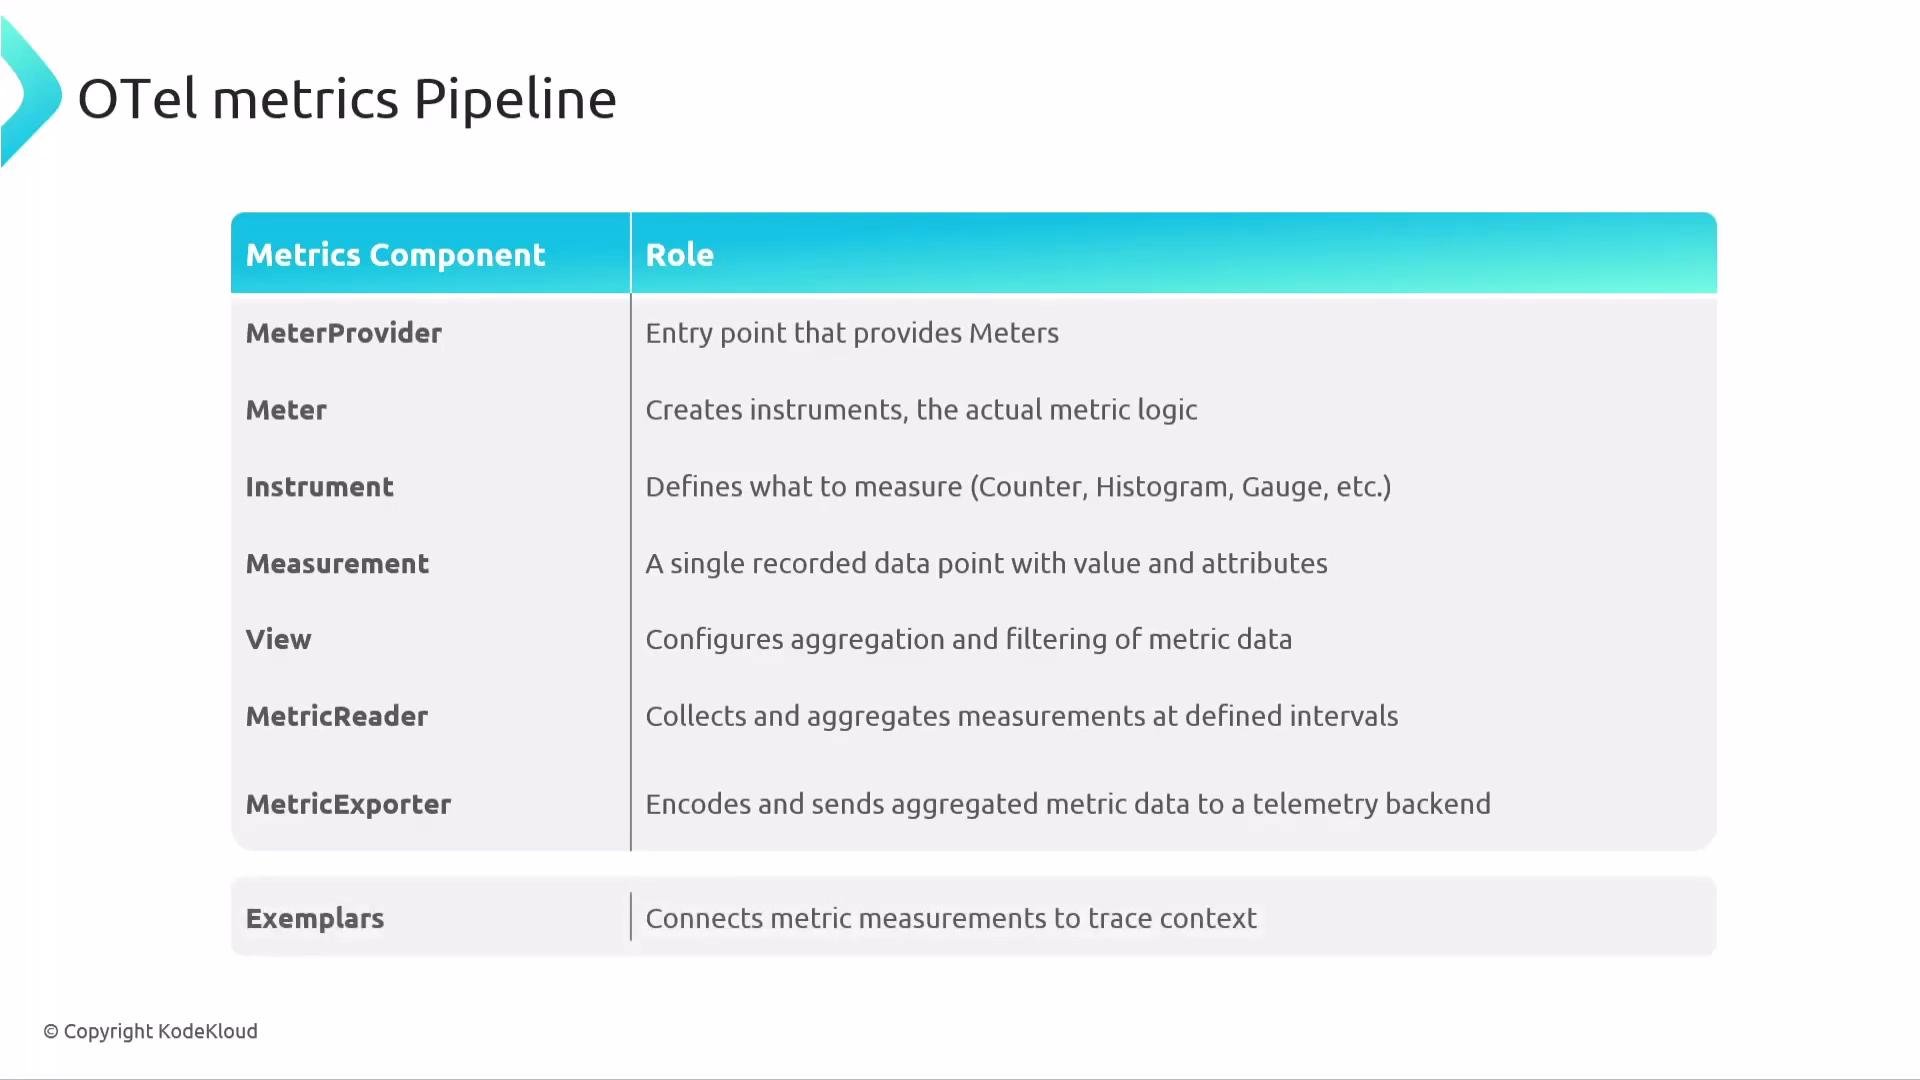
Core components in the OpenTelemetry metrics pipeline:
* MeterProvider: the entry point that provisions meters and configures the pipeline.
* Meter: represents an instrumentation scope (a library or component) and creates instruments.
* Instrument: counters, histograms, and up-down counters that record measurements.
* Measurement: a single recorded data point emitted by an instrument.
* View: an optional transformation layer to configure aggregation, filtering, renaming, or attribute changes without changing application code.
* MetricReader: controls collection and aggregation intervals and triggers exports.
* MetricExporter: encodes aggregated metric data (e.g., in OTLP) and sends it to a backend.
* Exemplars: sampled metric measurements that include trace/context information linking the metric to the exact trace/span that produced it.
 Exemplars are sampled measurement points that include trace/span identifiers or other context. They let you jump from an interesting metric value to the trace(s) that generated it—great for root-cause analysis and drill-down.
## MeterProvider and how it ties the pipeline together
The MeterProvider is the root of the Metrics SDK pipeline. It:
* Owns one or more Meters (each represents an instrumentation scope such as a library or component).
* Configures pipeline behavior (views, readers, exporters, and resource attribution).
* Applies any meter configurator logic that can enable/disable meters by scope.
Meters create Instruments (counters, histograms, up-down counters) which produce Measurements. Views can transform measurements at collection time—renaming metrics, changing aggregation, filtering attributes, or remapping labels—without touching instrumentation code. MetricReaders schedule collection and trigger exports. MetricExporters serialize aggregated metric data (often OTLP) and send it to a backend or collector.
Best practice: use descriptive meter names (for example, library name + version) so metrics are properly attributed and easier to query in backends.
Avoid empty or vague meter names. The SDK may return a functional meter for an empty name (sometimes with a warning), but you'll lose important attribution metadata.
Example: creating meters with clear names
```python theme={null}
from opentelemetry.sdk.metrics import MeterProvider
provider = MeterProvider()
# Good: descriptive name + version
meter = provider.get_meter("http-client", version="1.2.0")
# Bad: empty name (SDK may fallback but attribution is lost)
bad_meter = provider.get_meter("", version="0.1")
```
## A full lifecycle example
The example below illustrates a typical end-to-end setup: initialize a MeterProvider with a Resource and meter configurator, attach a periodic MetricReader with a Console exporter, create a Meter and instrument, record measurements, and register a runtime View to filter attributes.
```python theme={null}
from opentelemetry.sdk.resources import Resource
from opentelemetry.sdk.metrics import MeterProvider, MeterConfig
from opentelemetry.sdk.metrics.export import ConsoleMetricExporter, PeriodicExportingMetricReader
# 1) Initialize provider with resource and a meter configurator
resource = Resource({"service.name": "cart", "env": "staging"})
def disable_beta(scope):
# Disable meters whose scope name ends with ".beta"
return MeterConfig(enabled=not scope.name.endswith(".beta"))
provider = MeterProvider(
resource=resource,
meter_configurator=disable_beta
)
# 2) Attach a periodic reader and exporter (export every 5 seconds)
exporter = ConsoleMetricExporter()
reader = PeriodicExportingMetricReader(
exporter,
export_interval_millis=5000
)
provider.register_metric_reader(reader)
# 3) Create a Meter & Counter and record a measurement
meter = provider.get_meter("cart.checkout", version="0.9")
counter = meter.create_counter("items.checked_out")
counter.add(3, {"currency": "USD"})
# 4) Register a View at runtime to filter attributes (drop "currency")
provider.register_view(
instrument_name="items.checked_out",
attribute_filter=lambda kv: kv[0] != "currency"
)
```
Sequence explained
* Initialize MeterProvider with a `Resource` (for example, `service.name` and `env`) and optionally supply a `meter_configurator` to enable/disable meters by scope.
* Attach a `PeriodicExportingMetricReader` and a `MetricExporter` (Console in this demo) to control export timing and serialization.
* Create a `Meter` with a descriptive name and version, then create Instruments and record Measurements with attributes.
* Register an optional `View` at runtime to transform or filter attributes before export (this keeps instrumentation code untouched while applying policy).
## Pipeline summary
Think of the MeterProvider as your metrics factory and central configurator. The main pipeline stages are:
| Stage | Role |
| ------------------------- | ---------------------------------------------------------------- |
| Provider (MeterProvider) | Orchestrates Meters, resources, Views, Readers, and Exporters |
| Meter | Instrumentation scope that creates Instruments |
| Instrument | Counters, Histograms, UpDownCounters used to emit Measurements |
| View (optional) | Transformation layer: aggregation, attribute filtering, renaming |
| Reader (MetricReader) | Controls collection timing and triggers aggregation/export |
| Exporter (MetricExporter) | Serializes and sends aggregated metrics to a backend |
Mnemonic: "Please Make Insight Via Reliable Exports"\
(P = Provider, M = Meter, I = Instrument, V = View, R = Reader, E = Exporter)
Links and references
* OpenTelemetry Metrics specification and SDKs: [https://opentelemetry.io/docs/](https://opentelemetry.io/docs/)
* OTLP (OpenTelemetry Protocol) details: [https://github.com/open-telemetry/opentelemetry-specification](https://github.com/open-telemetry/opentelemetry-specification)
## Summary
This should give you a clear understanding of how metric data moves from your application to a collector or backend, the role of each component in the pipeline, and practical tips for configuring MeterProvider, Meter names, Views, Readers, and Exporters. That's it for the Metrics pipeline section.
Exemplars are sampled measurement points that include trace/span identifiers or other context. They let you jump from an interesting metric value to the trace(s) that generated it—great for root-cause analysis and drill-down.
## MeterProvider and how it ties the pipeline together
The MeterProvider is the root of the Metrics SDK pipeline. It:
* Owns one or more Meters (each represents an instrumentation scope such as a library or component).
* Configures pipeline behavior (views, readers, exporters, and resource attribution).
* Applies any meter configurator logic that can enable/disable meters by scope.
Meters create Instruments (counters, histograms, up-down counters) which produce Measurements. Views can transform measurements at collection time—renaming metrics, changing aggregation, filtering attributes, or remapping labels—without touching instrumentation code. MetricReaders schedule collection and trigger exports. MetricExporters serialize aggregated metric data (often OTLP) and send it to a backend or collector.
Best practice: use descriptive meter names (for example, library name + version) so metrics are properly attributed and easier to query in backends.
Avoid empty or vague meter names. The SDK may return a functional meter for an empty name (sometimes with a warning), but you'll lose important attribution metadata.
Example: creating meters with clear names
```python theme={null}
from opentelemetry.sdk.metrics import MeterProvider
provider = MeterProvider()
# Good: descriptive name + version
meter = provider.get_meter("http-client", version="1.2.0")
# Bad: empty name (SDK may fallback but attribution is lost)
bad_meter = provider.get_meter("", version="0.1")
```
## A full lifecycle example
The example below illustrates a typical end-to-end setup: initialize a MeterProvider with a Resource and meter configurator, attach a periodic MetricReader with a Console exporter, create a Meter and instrument, record measurements, and register a runtime View to filter attributes.
```python theme={null}
from opentelemetry.sdk.resources import Resource
from opentelemetry.sdk.metrics import MeterProvider, MeterConfig
from opentelemetry.sdk.metrics.export import ConsoleMetricExporter, PeriodicExportingMetricReader
# 1) Initialize provider with resource and a meter configurator
resource = Resource({"service.name": "cart", "env": "staging"})
def disable_beta(scope):
# Disable meters whose scope name ends with ".beta"
return MeterConfig(enabled=not scope.name.endswith(".beta"))
provider = MeterProvider(
resource=resource,
meter_configurator=disable_beta
)
# 2) Attach a periodic reader and exporter (export every 5 seconds)
exporter = ConsoleMetricExporter()
reader = PeriodicExportingMetricReader(
exporter,
export_interval_millis=5000
)
provider.register_metric_reader(reader)
# 3) Create a Meter & Counter and record a measurement
meter = provider.get_meter("cart.checkout", version="0.9")
counter = meter.create_counter("items.checked_out")
counter.add(3, {"currency": "USD"})
# 4) Register a View at runtime to filter attributes (drop "currency")
provider.register_view(
instrument_name="items.checked_out",
attribute_filter=lambda kv: kv[0] != "currency"
)
```
Sequence explained
* Initialize MeterProvider with a `Resource` (for example, `service.name` and `env`) and optionally supply a `meter_configurator` to enable/disable meters by scope.
* Attach a `PeriodicExportingMetricReader` and a `MetricExporter` (Console in this demo) to control export timing and serialization.
* Create a `Meter` with a descriptive name and version, then create Instruments and record Measurements with attributes.
* Register an optional `View` at runtime to transform or filter attributes before export (this keeps instrumentation code untouched while applying policy).
## Pipeline summary
Think of the MeterProvider as your metrics factory and central configurator. The main pipeline stages are:
| Stage | Role |
| ------------------------- | ---------------------------------------------------------------- |
| Provider (MeterProvider) | Orchestrates Meters, resources, Views, Readers, and Exporters |
| Meter | Instrumentation scope that creates Instruments |
| Instrument | Counters, Histograms, UpDownCounters used to emit Measurements |
| View (optional) | Transformation layer: aggregation, attribute filtering, renaming |
| Reader (MetricReader) | Controls collection timing and triggers aggregation/export |
| Exporter (MetricExporter) | Serializes and sends aggregated metrics to a backend |
Mnemonic: "Please Make Insight Via Reliable Exports"\
(P = Provider, M = Meter, I = Instrument, V = View, R = Reader, E = Exporter)
Links and references
* OpenTelemetry Metrics specification and SDKs: [https://opentelemetry.io/docs/](https://opentelemetry.io/docs/)
* OTLP (OpenTelemetry Protocol) details: [https://github.com/open-telemetry/opentelemetry-specification](https://github.com/open-telemetry/opentelemetry-specification)
## Summary
This should give you a clear understanding of how metric data moves from your application to a collector or backend, the role of each component in the pipeline, and practical tips for configuring MeterProvider, Meter names, Views, Readers, and Exporters. That's it for the Metrics pipeline section.