> ## Documentation Index
> Fetch the complete documentation index at: https://notes.kodekloud.com/llms.txt
> Use this file to discover all available pages before exploring further.
# Demo Tracing Overview
> Walkthrough of using OpenTelemetry, Jaeger, and Grafana to inspect distributed traces, read spans, and troubleshoot performance and errors across services.
In this lesson we'll walk through real distributed traces so you can quickly see what trace data looks like, how to read spans, and how to use traces to troubleshoot production issues. The demo uses an application instrumented with OpenTelemetry that exports traces to Jaeger. Grafana is connected to the Jaeger datasource so we can search and inspect traces inside Grafana’s Explore view.
This guide assumes you have traces being exported to a Jaeger-compatible backend and Grafana configured with a Jaeger datasource. If you need setup guidance, see the OpenTelemetry, Jaeger, and Grafana docs linked in References.
How to query traces in Grafana
* Open Grafana → Explore.
* Select the Jaeger datasource.
* Enter filters such as `service` or `operation` (span name), and optional attribute matches or min/max duration.
* Limit the time range (e.g., last 5 minutes) before running the query.
Below I start from the frontend service because user-initiated flows originate there.
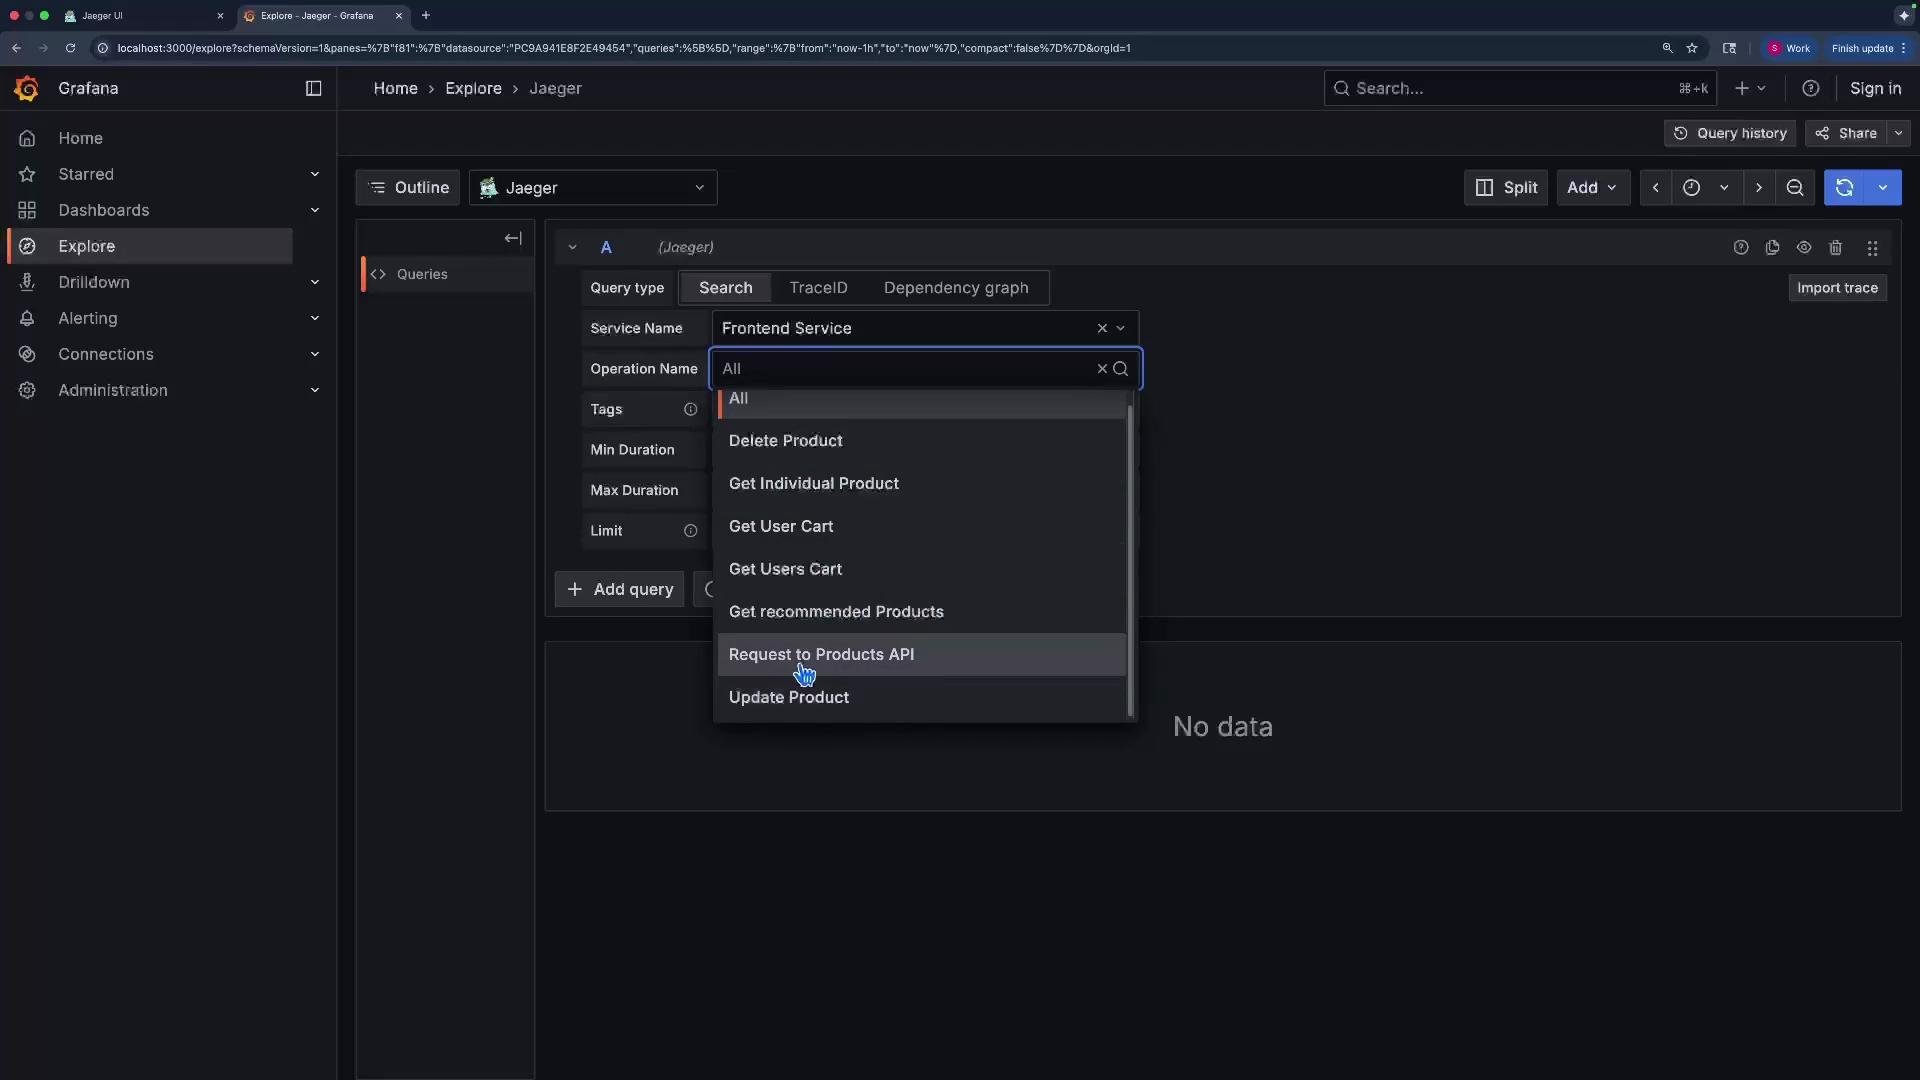
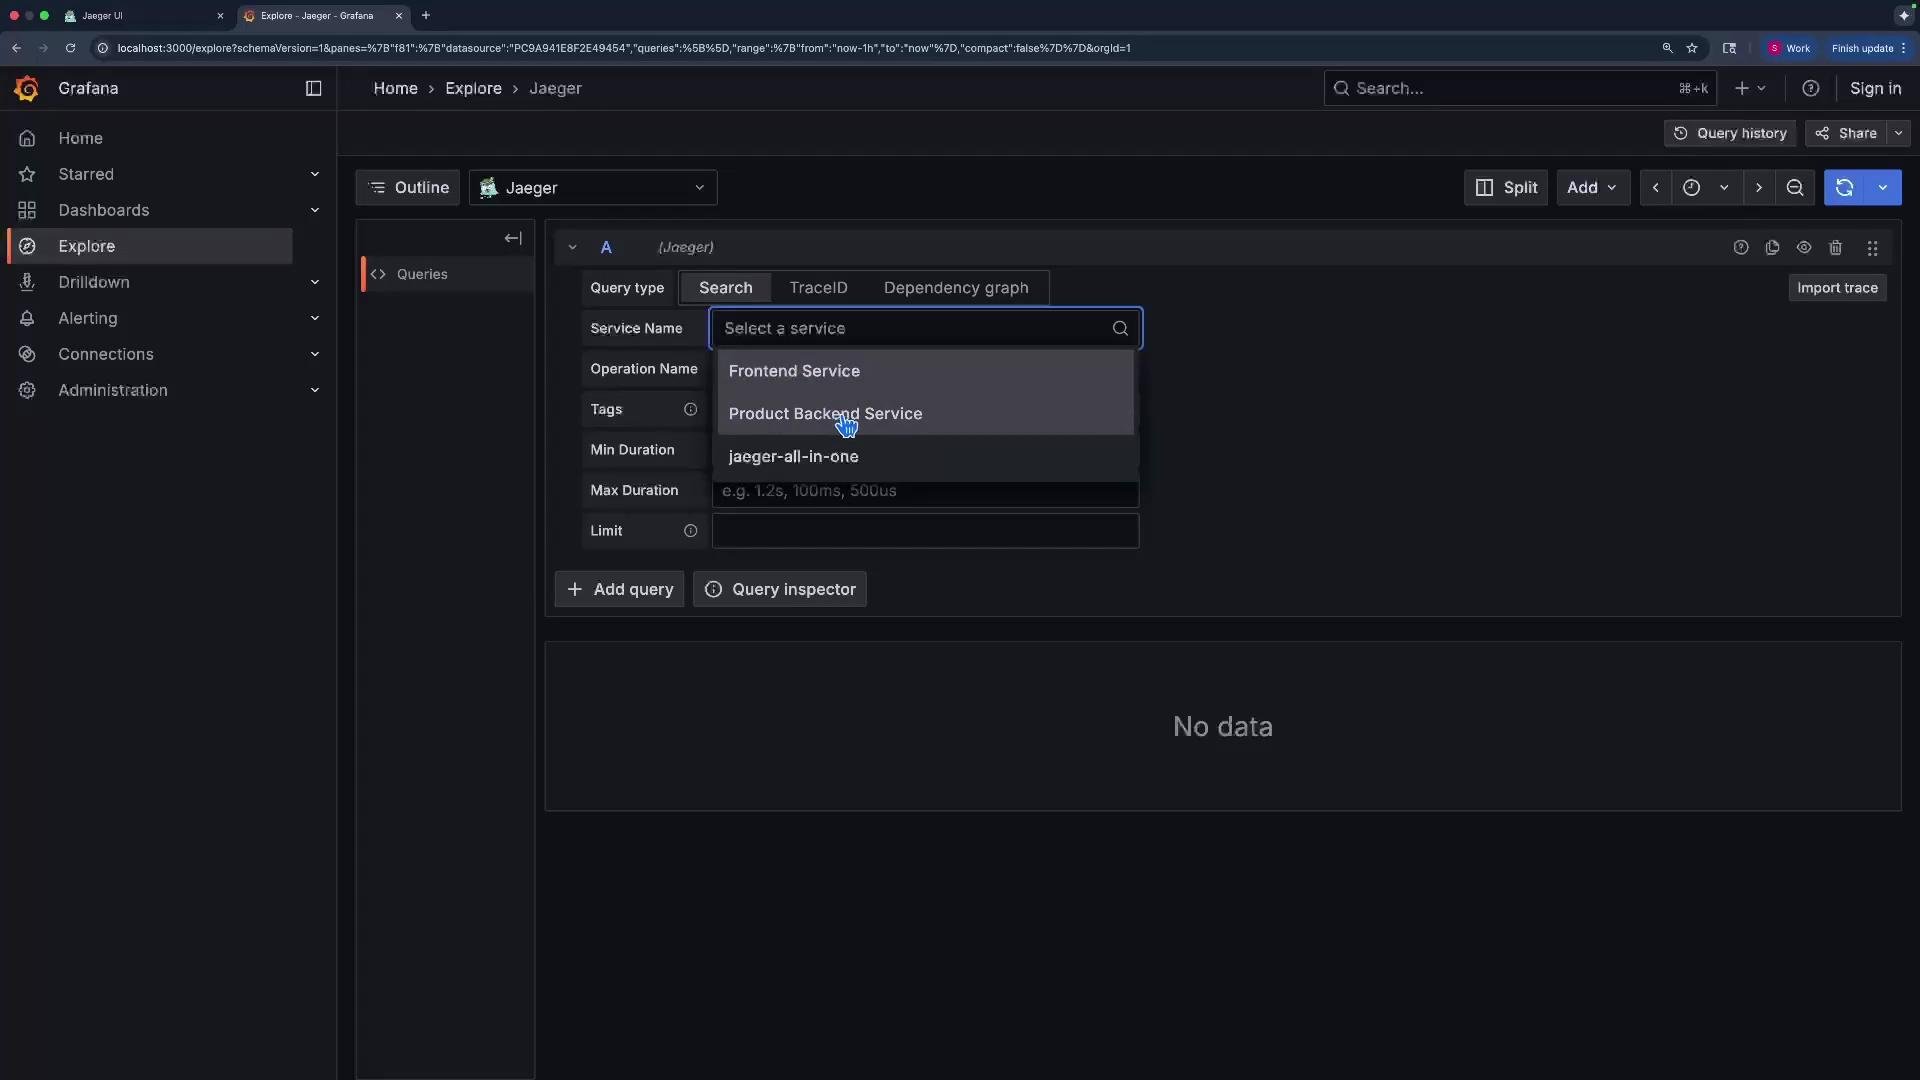 After selecting the service you can inspect available operation names (span names) such as `getUserCart`, `getIndividualProduct`, `getRecommendedProduct`, `requestToTheProductsAPI`, `updateProduct`. For this walkthrough I select all operations to capture a representative trace.
 Run the query with a narrow time window (last 5 minutes). Grafana lists traces with metadata such as trace name, start time, and total duration. Open an interesting trace and undock the details panel for more room.
This selected trace shows:
* Trace ID and start timestamp.
* Total duration (\~80 ms).
* Involved services: frontend and backend.
* Total spans: four.\
Expand each span to view service-level or span-level details. The first span is the frontend root span representing the initial update product action.
Run the query with a narrow time window (last 5 minutes). Grafana lists traces with metadata such as trace name, start time, and total duration. Open an interesting trace and undock the details panel for more room.
This selected trace shows:
* Trace ID and start timestamp.
* Total duration (\~80 ms).
* Involved services: frontend and backend.
* Total spans: four.\
Expand each span to view service-level or span-level details. The first span is the frontend root span representing the initial update product action.
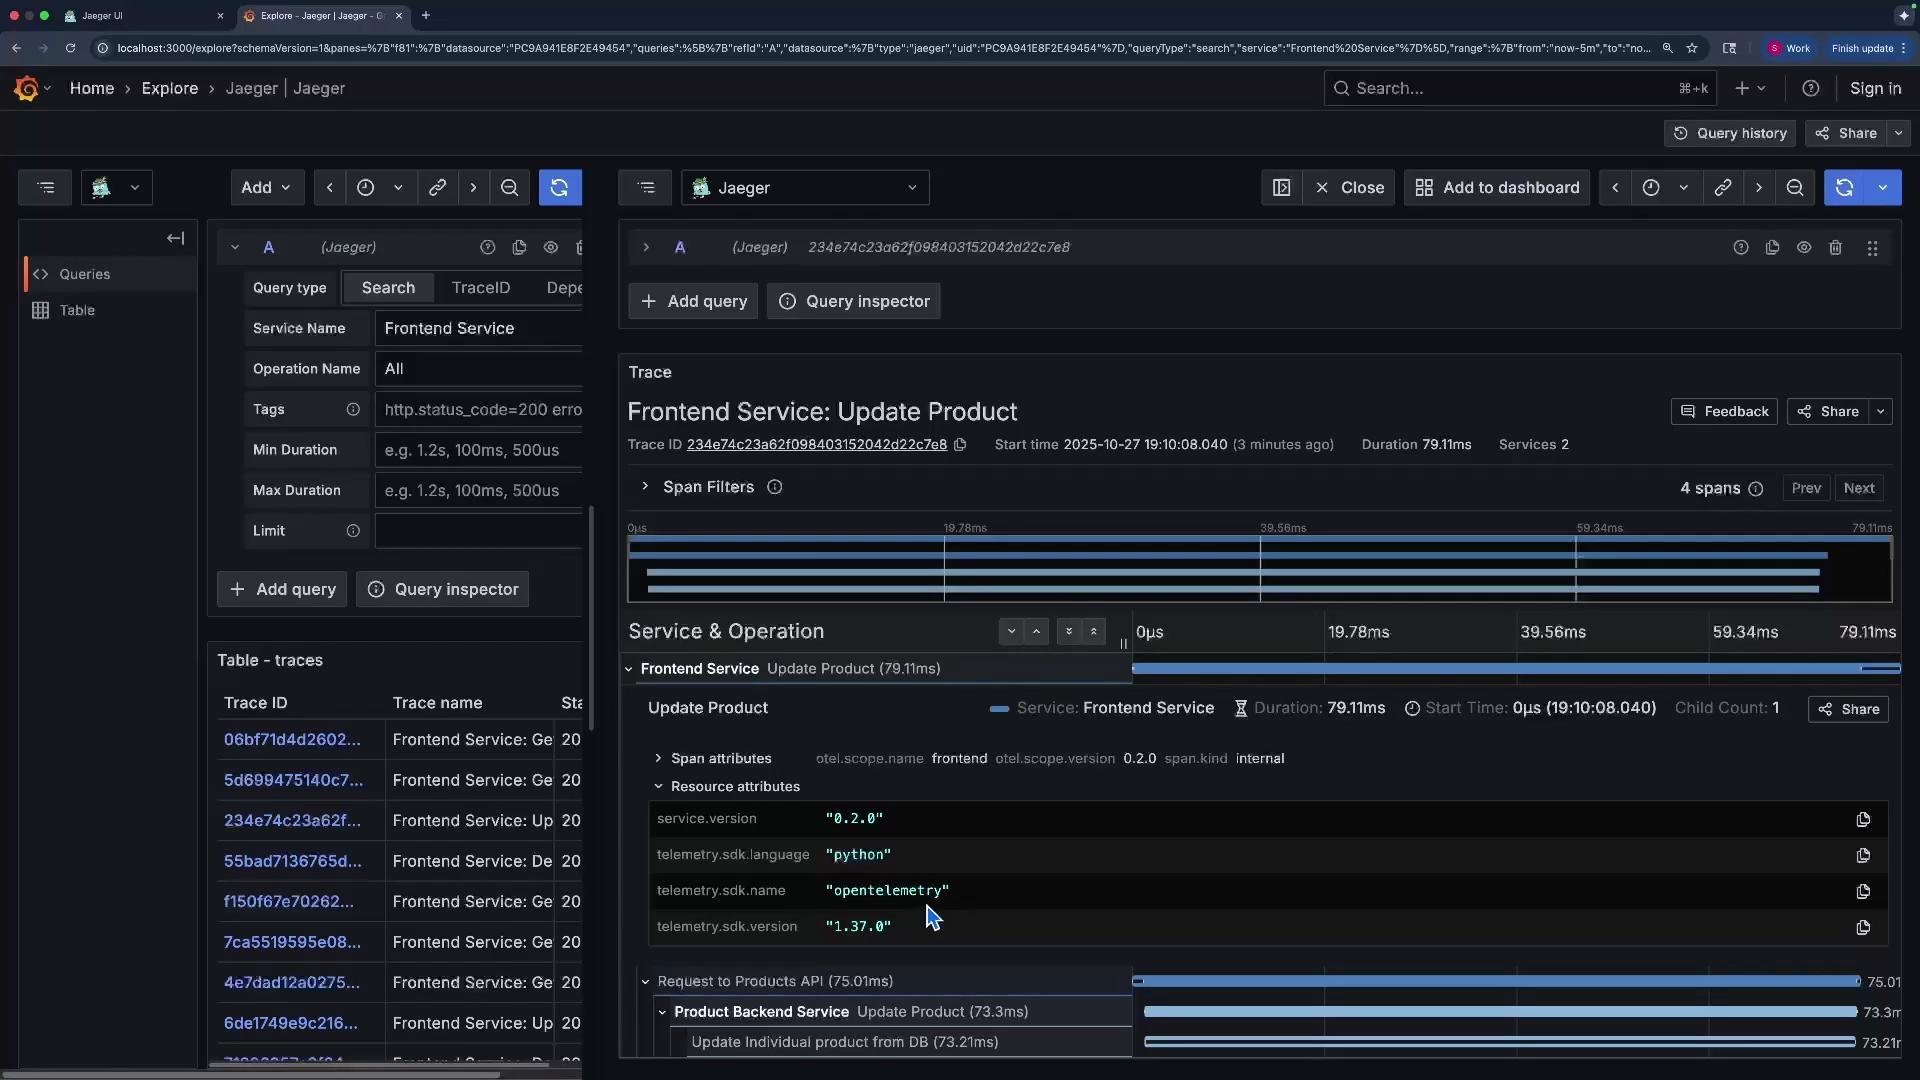 Reading the frontend root span
* Root span: starts at 0 relative to the trace.
* Duration: \~79 ms (matches trace total because the root waits for children).
* Resource attributes: host, pod, region, etc. (this demo instruments a minimal set).
* Span attributes: in-application metadata such as service name and version.
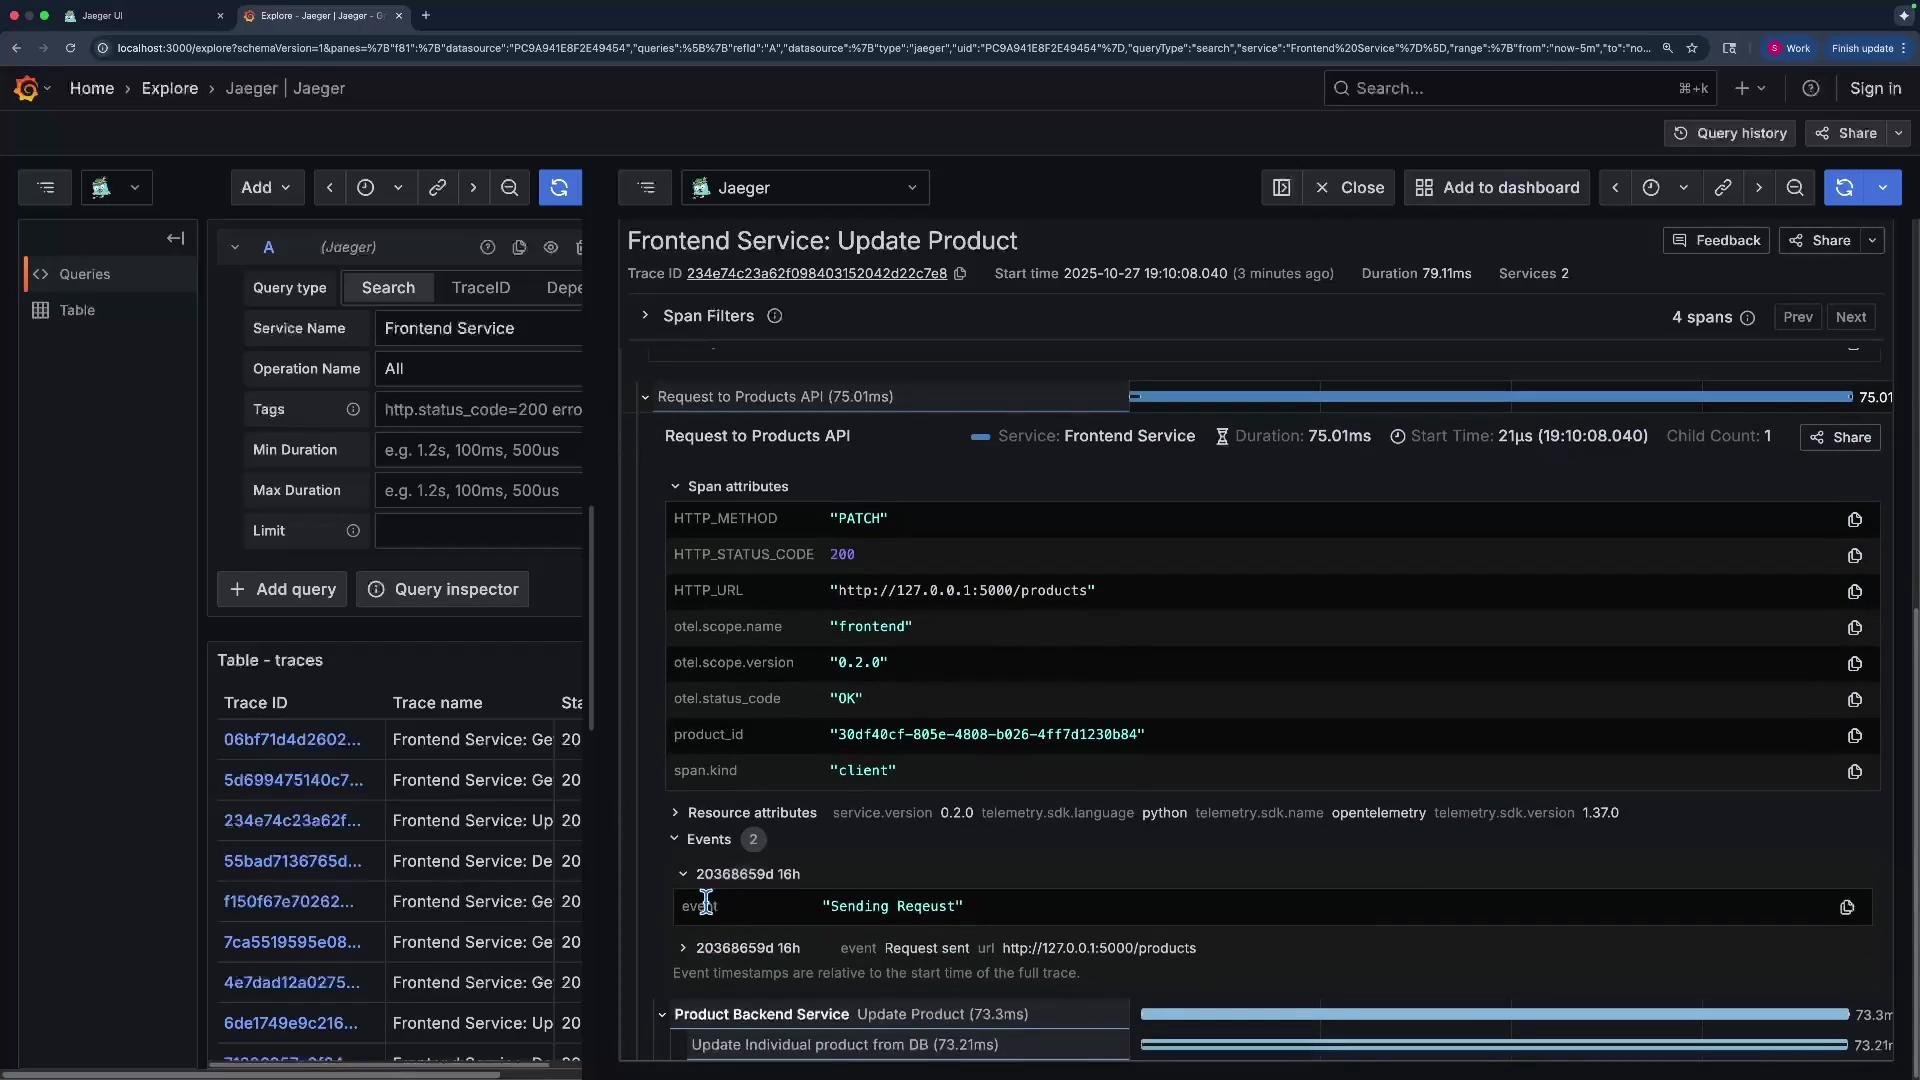
The frontend span has a child that issues an HTTP request to the product backend. That child span includes richer HTTP attributes.
Reading the frontend root span
* Root span: starts at 0 relative to the trace.
* Duration: \~79 ms (matches trace total because the root waits for children).
* Resource attributes: host, pod, region, etc. (this demo instruments a minimal set).
* Span attributes: in-application metadata such as service name and version.
The frontend span has a child that issues an HTTP request to the product backend. That child span includes richer HTTP attributes.
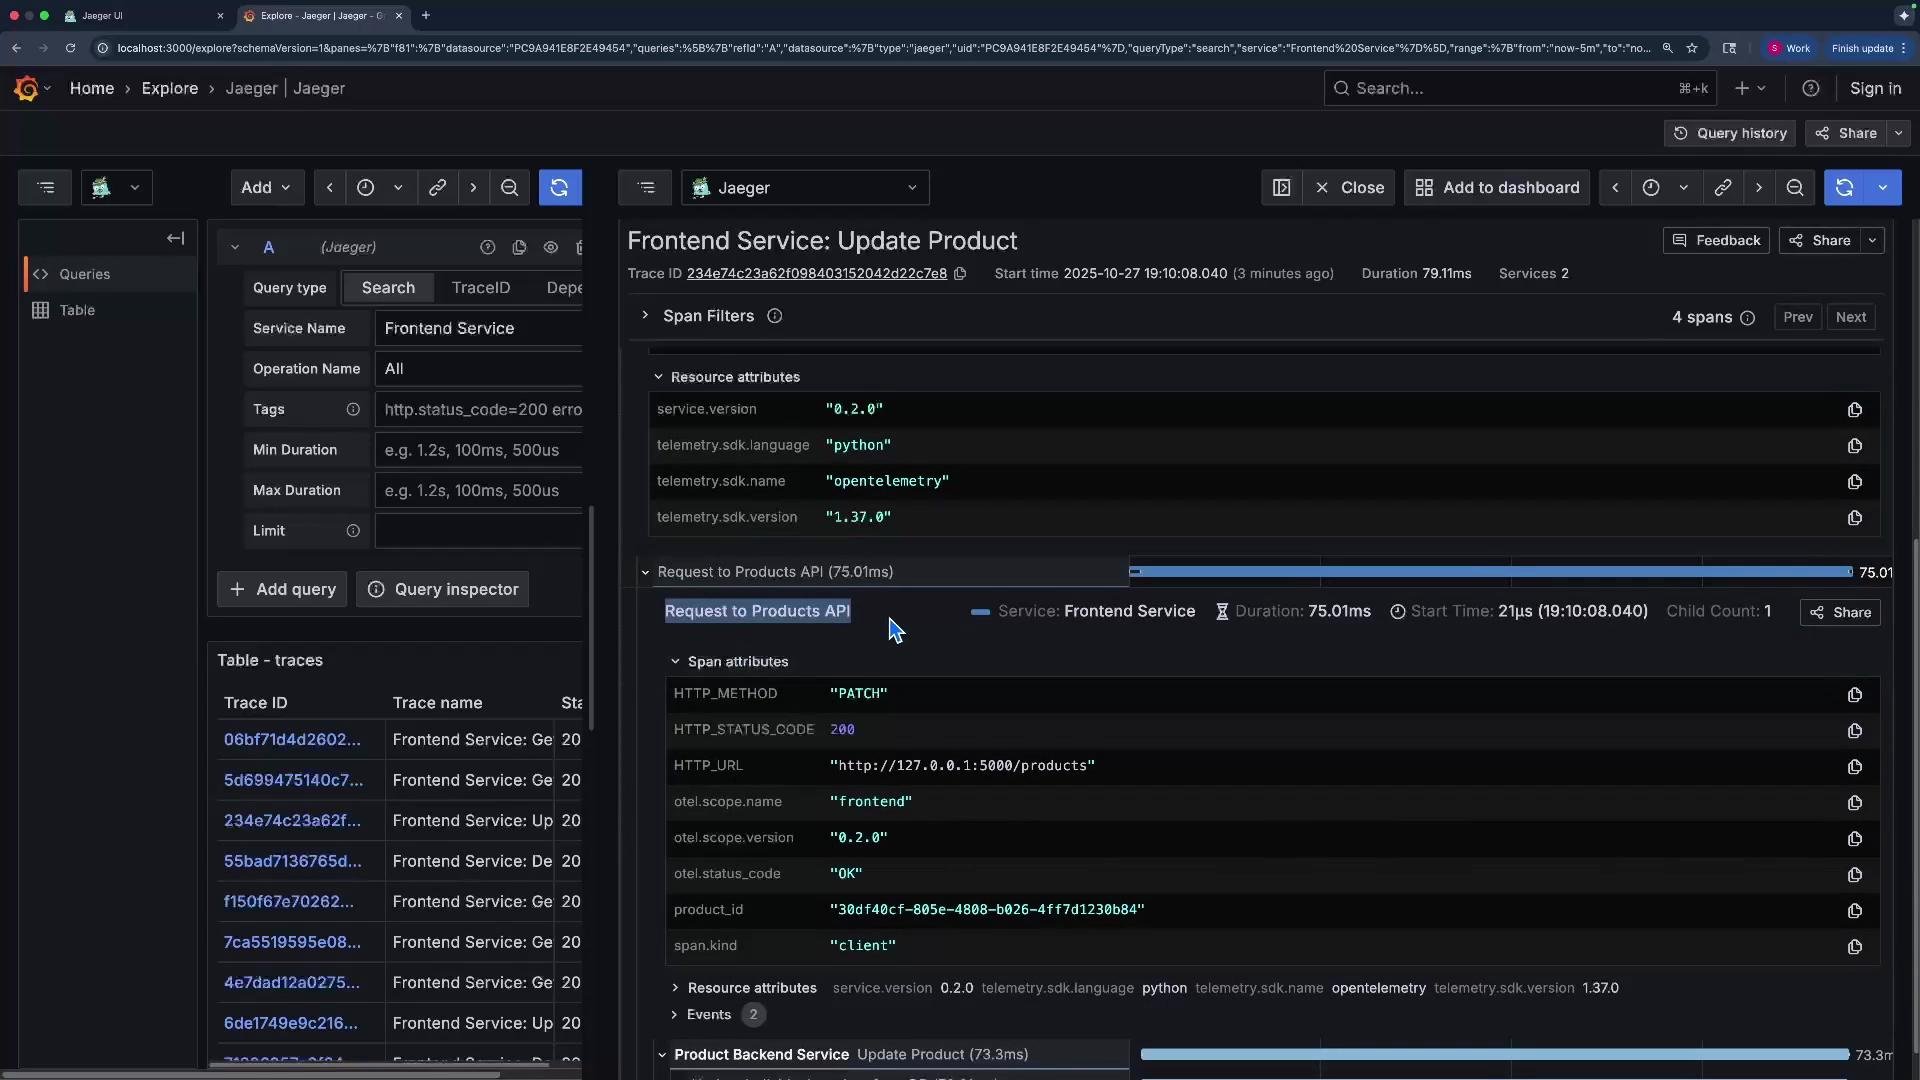 Typical HTTP client span details
* Request URL and path (backend endpoint).
* HTTP method (`PATCH`) and status code (`200`).
* Span kind: `client`.
* Events: timestamped logs such as `request.sent`. Events are ideal for attaching exceptions or custom logs to spans.
Typical HTTP client span details
* Request URL and path (backend endpoint).
* HTTP method (`PATCH`) and status code (`200`).
* Span kind: `client`.
* Events: timestamped logs such as `request.sent`. Events are ideal for attaching exceptions or custom logs to spans.
 The backend receives the request and performs the `update-product` operation.
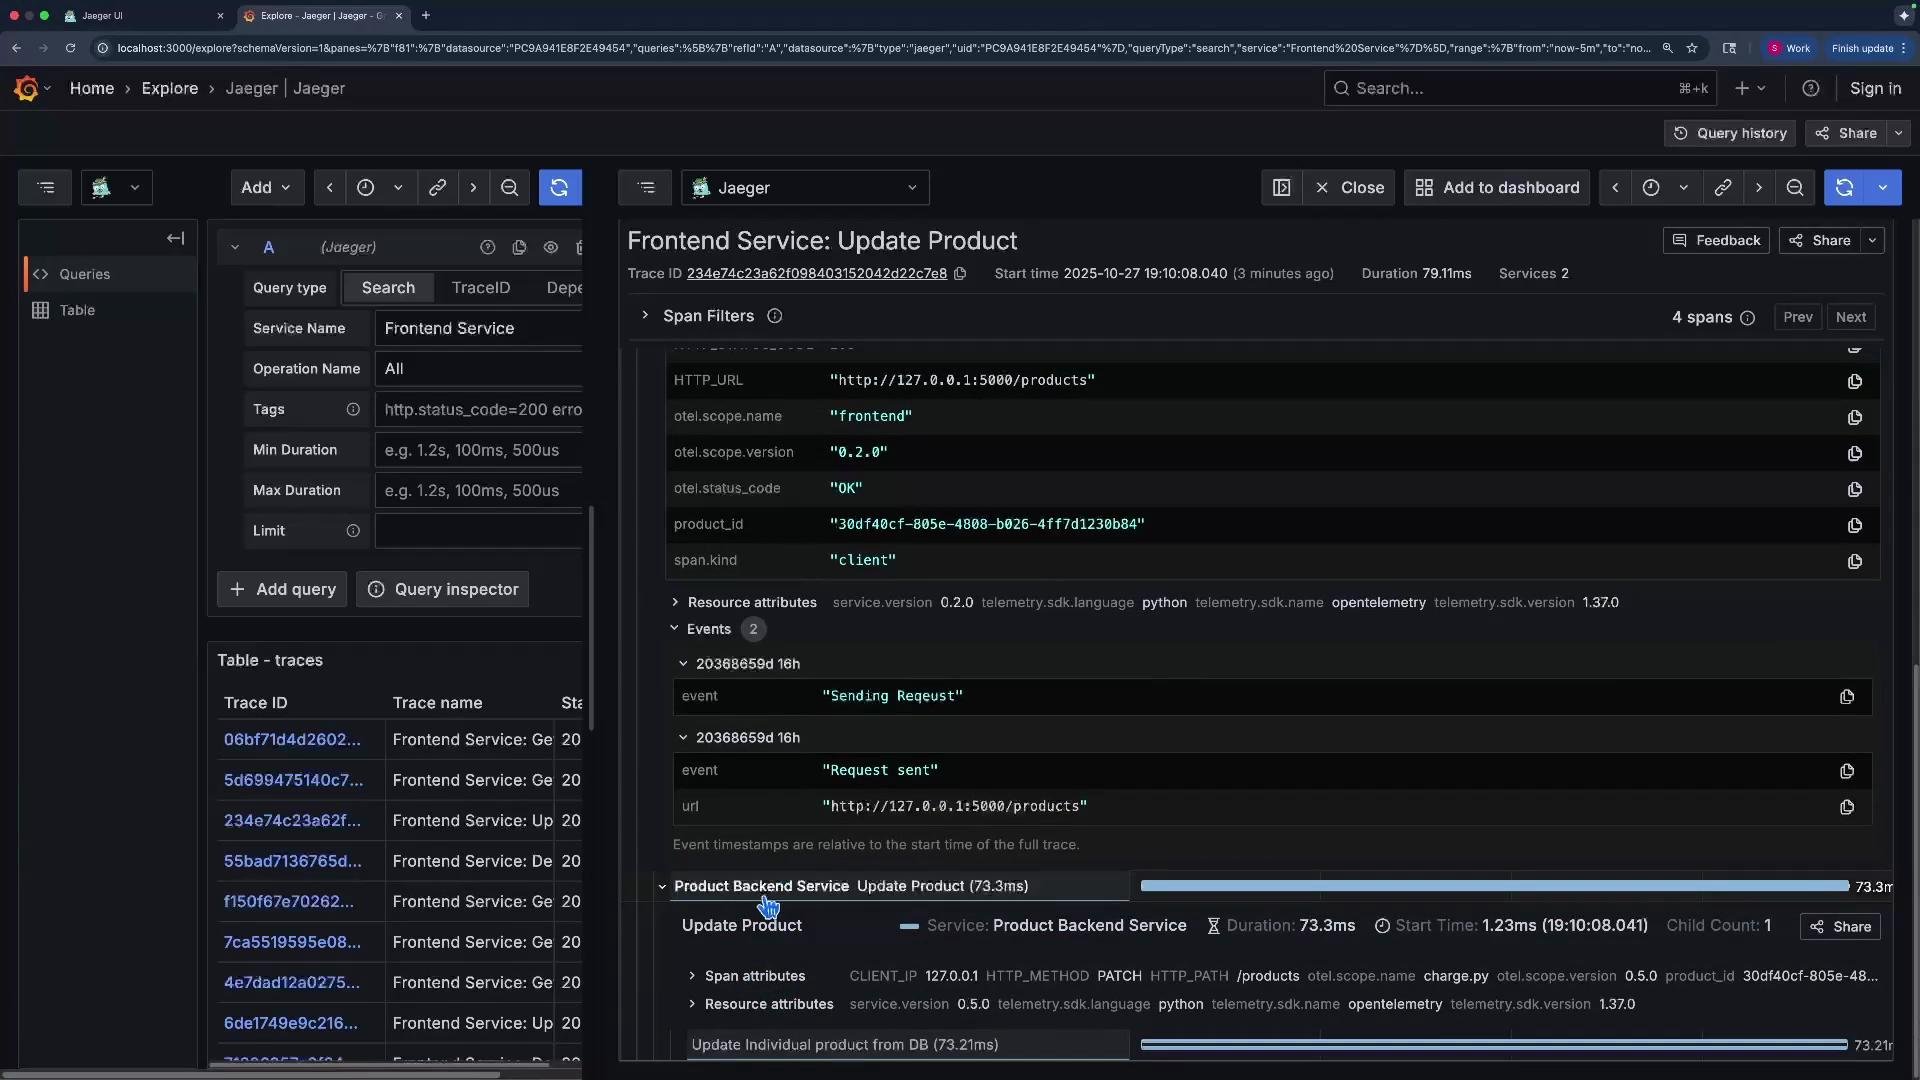 Backend span highlights
* Service name: `product-backend-service`.
* Backend span total: \~73 ms.
* A DB child span: \~1.23 ms.
* Start times are relative to the trace root; e.g., frontend root = 0 µs, backend starts at \~21 µs, DB child at \~1.23 ms — these offsets show timing relationships between steps.
Common backend span and resource attributes
| Attribute | Meaning / Example |
| ---------------------------- | ----------------------------------------------- |
| `span.kind` | Role of span: `server` for incoming HTTP |
| `net.peer.ip` / `client.ip` | Client address (may be loopback in local demos) |
| `http.method` | HTTP verb (e.g., `PATCH`, `GET`) |
| `http.target` / `http.url` | Path/URL called (e.g., `/products`) |
| `db.statement` / `SQL_QUERY` | SQL query text or signature (if instrumented) |
| `service.version` | App version for troubleshooting regressions |
Backend span highlights
* Service name: `product-backend-service`.
* Backend span total: \~73 ms.
* A DB child span: \~1.23 ms.
* Start times are relative to the trace root; e.g., frontend root = 0 µs, backend starts at \~21 µs, DB child at \~1.23 ms — these offsets show timing relationships between steps.
Common backend span and resource attributes
| Attribute | Meaning / Example |
| ---------------------------- | ----------------------------------------------- |
| `span.kind` | Role of span: `server` for incoming HTTP |
| `net.peer.ip` / `client.ip` | Client address (may be loopback in local demos) |
| `http.method` | HTTP verb (e.g., `PATCH`, `GET`) |
| `http.target` / `http.url` | Path/URL called (e.g., `/products`) |
| `db.statement` / `SQL_QUERY` | SQL query text or signature (if instrumented) |
| `service.version` | App version for troubleshooting regressions |
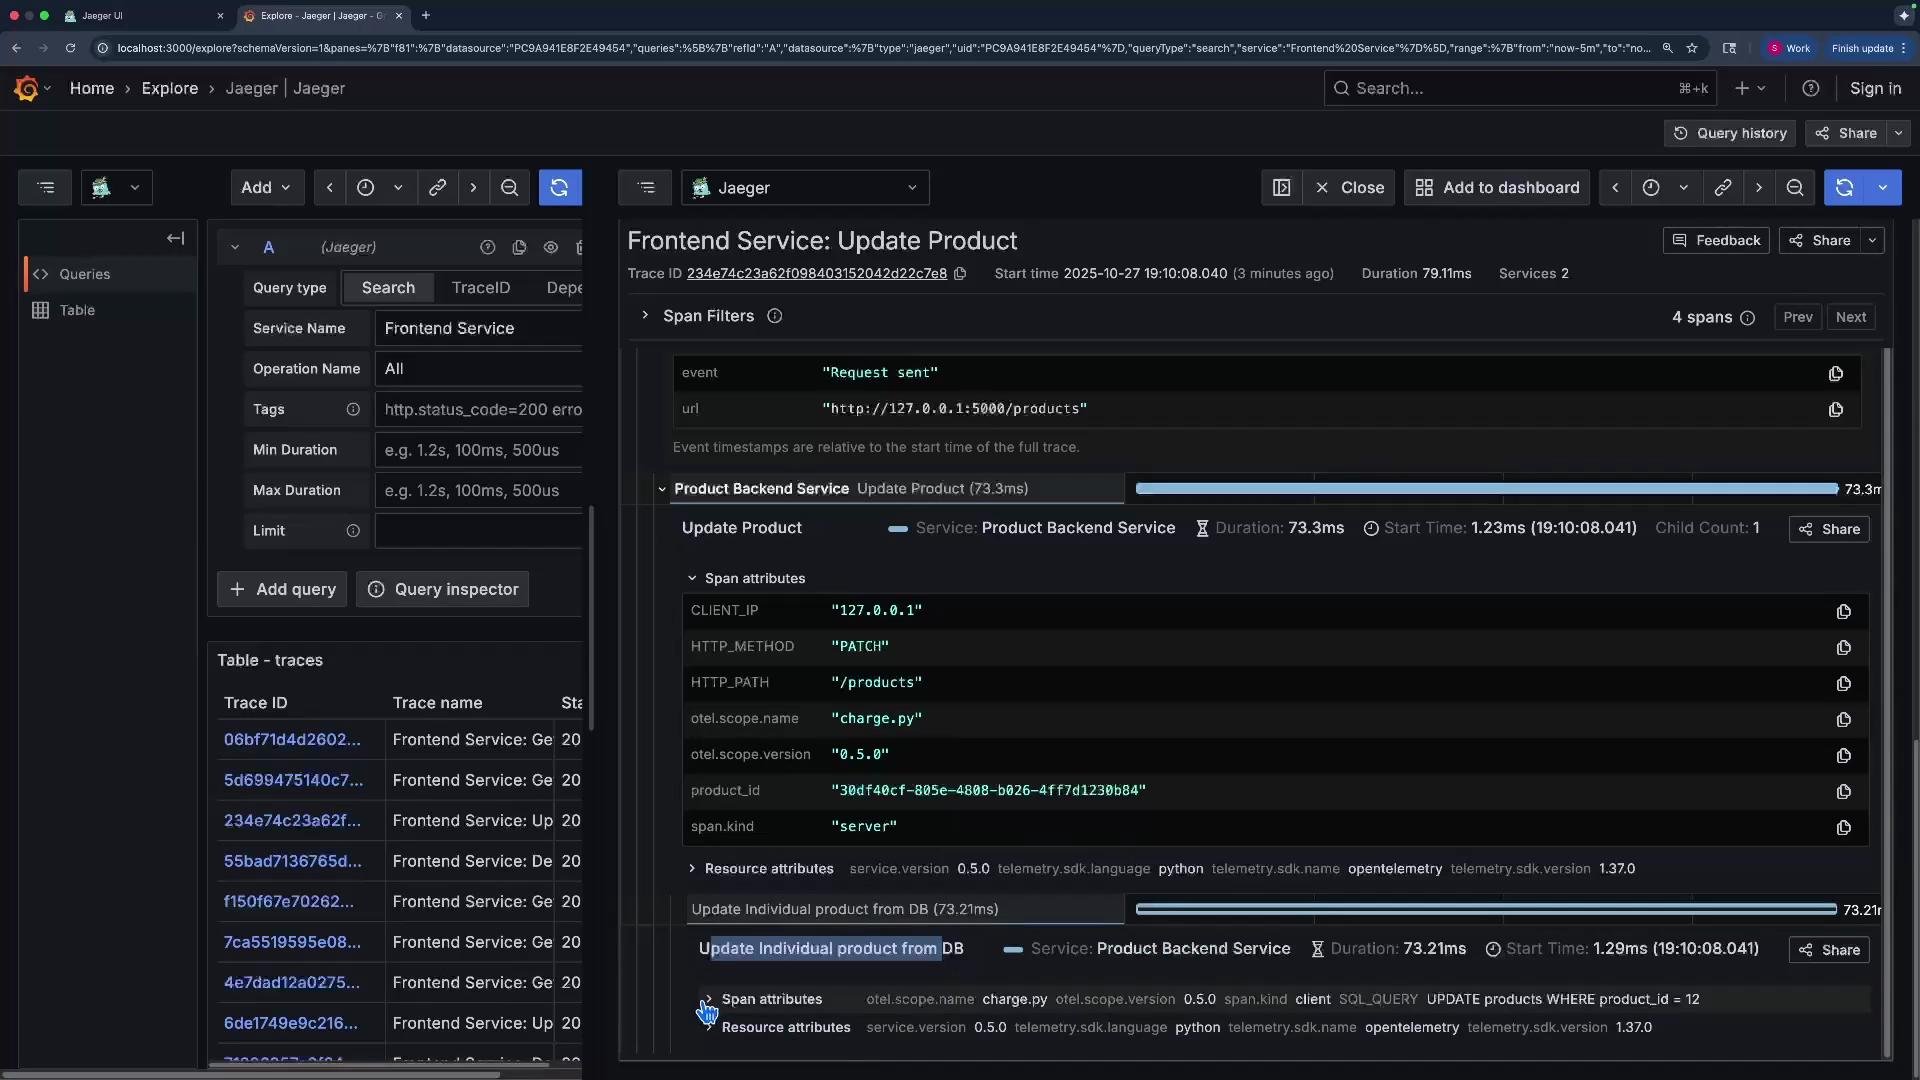 Instrumenting database calls
I instrumented the SQL executed by the backend so the DB query appears as its own span. Including either the full SQL or a query signature in a span attribute makes it far easier to find slow or incorrect queries.
```sql theme={null}
UPDATE products SET /* column = value */ WHERE product_id = 12;
```
Recording the SQL in a span attribute speeds escalation to DB or query-optimization teams with exact text and timing.
Why traces matter for performance troubleshooting
Traces provide a step-by-step timeline across services. Use duration filters to find slow requests (e.g., search for traces with min duration > 1s). In the next example I filter for traces longer than 1 second and open a trace that took 1.61 s. The initial spans are microseconds–milliseconds, but a final DB call to fetch recommended products consumed the full 1.61 s — isolating the query as the latency source.
Instrumenting database calls
I instrumented the SQL executed by the backend so the DB query appears as its own span. Including either the full SQL or a query signature in a span attribute makes it far easier to find slow or incorrect queries.
```sql theme={null}
UPDATE products SET /* column = value */ WHERE product_id = 12;
```
Recording the SQL in a span attribute speeds escalation to DB or query-optimization teams with exact text and timing.
Why traces matter for performance troubleshooting
Traces provide a step-by-step timeline across services. Use duration filters to find slow requests (e.g., search for traces with min duration > 1s). In the next example I filter for traces longer than 1 second and open a trace that took 1.61 s. The initial spans are microseconds–milliseconds, but a final DB call to fetch recommended products consumed the full 1.61 s — isolating the query as the latency source.
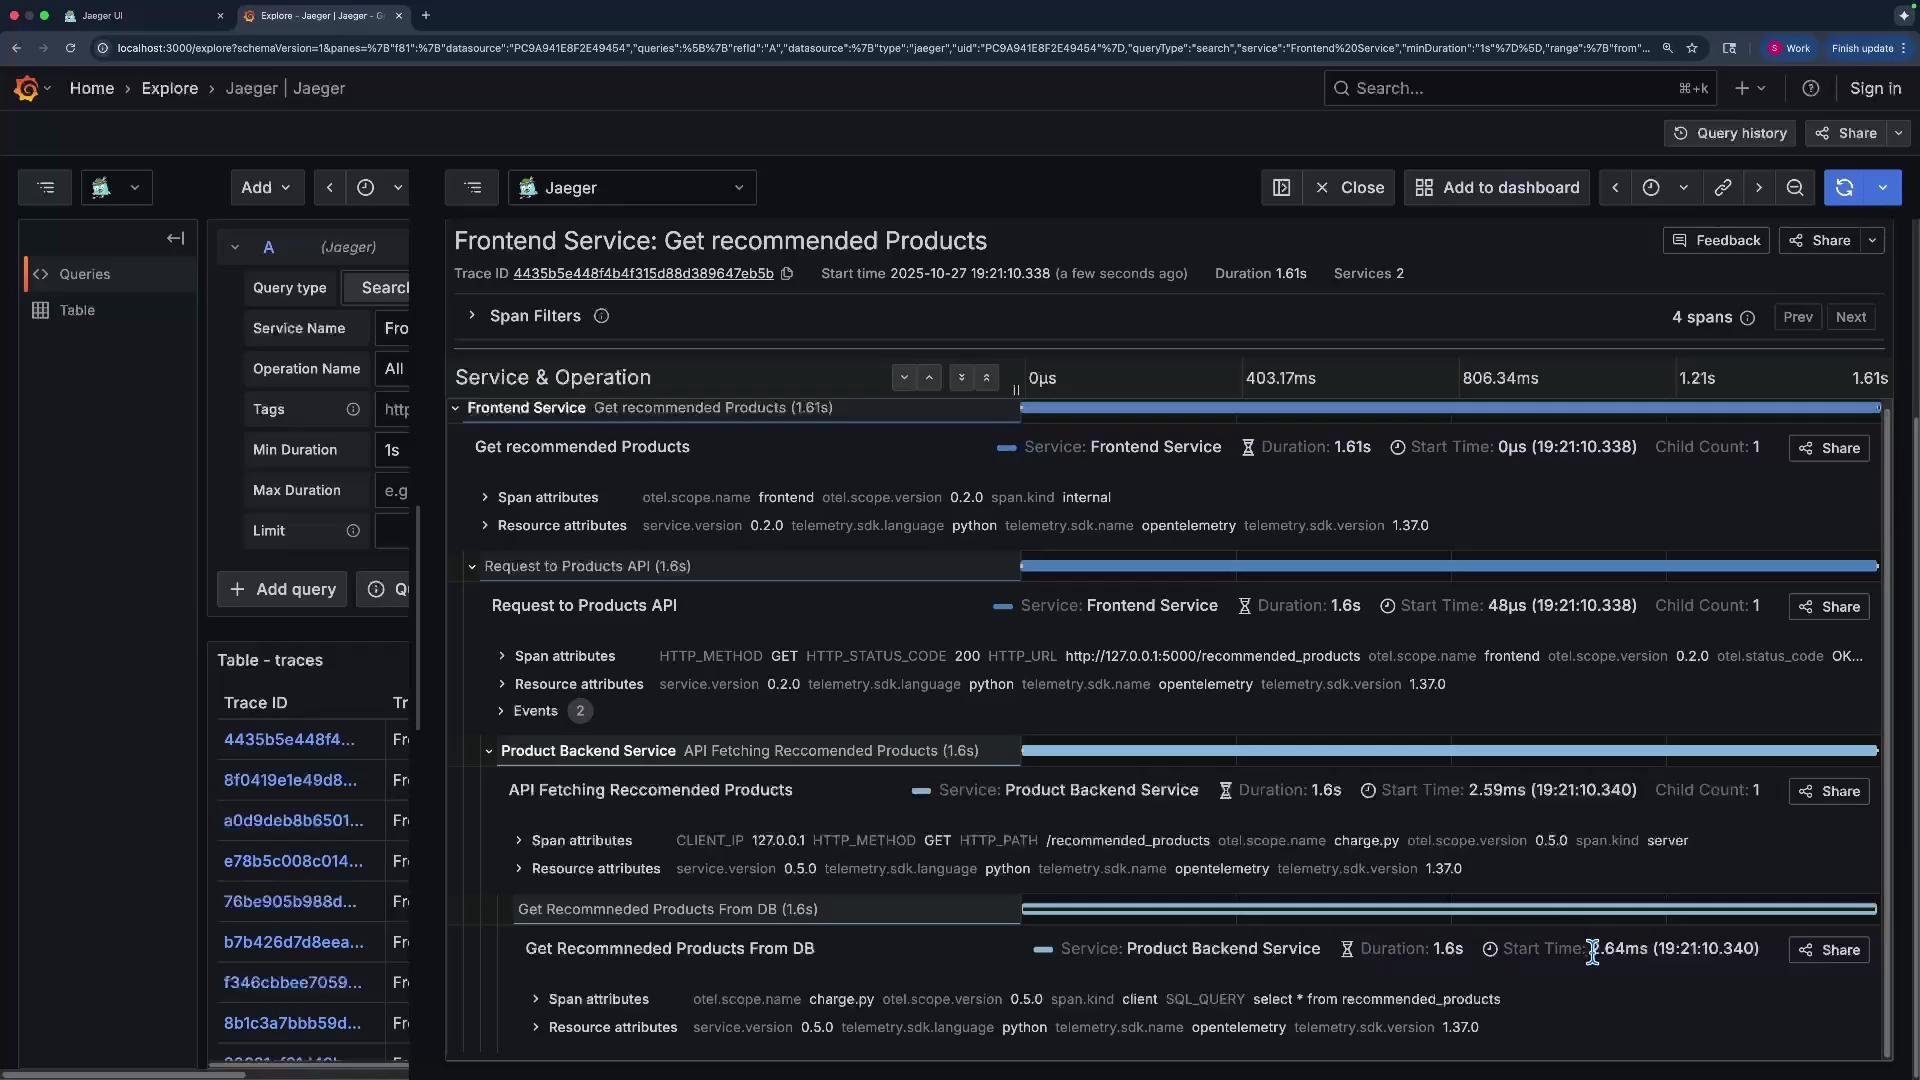 Example span attributes for the slow DB client span:
* `otel.scope.name`: "charge.py"
* `otel.scope.version`: "0.5.0"
* `span.kind`: "client"
* `SQL_QUERY`: "select \* from recommended\_products"
These attributes let you hand off the exact problematic query and timing to the team that owns the database.
Use duration filters when troubleshooting performance problems: start broad (for example, `min duration > 1s`) and then drill into individual traces to identify the single offending span(s).
Traces and errors
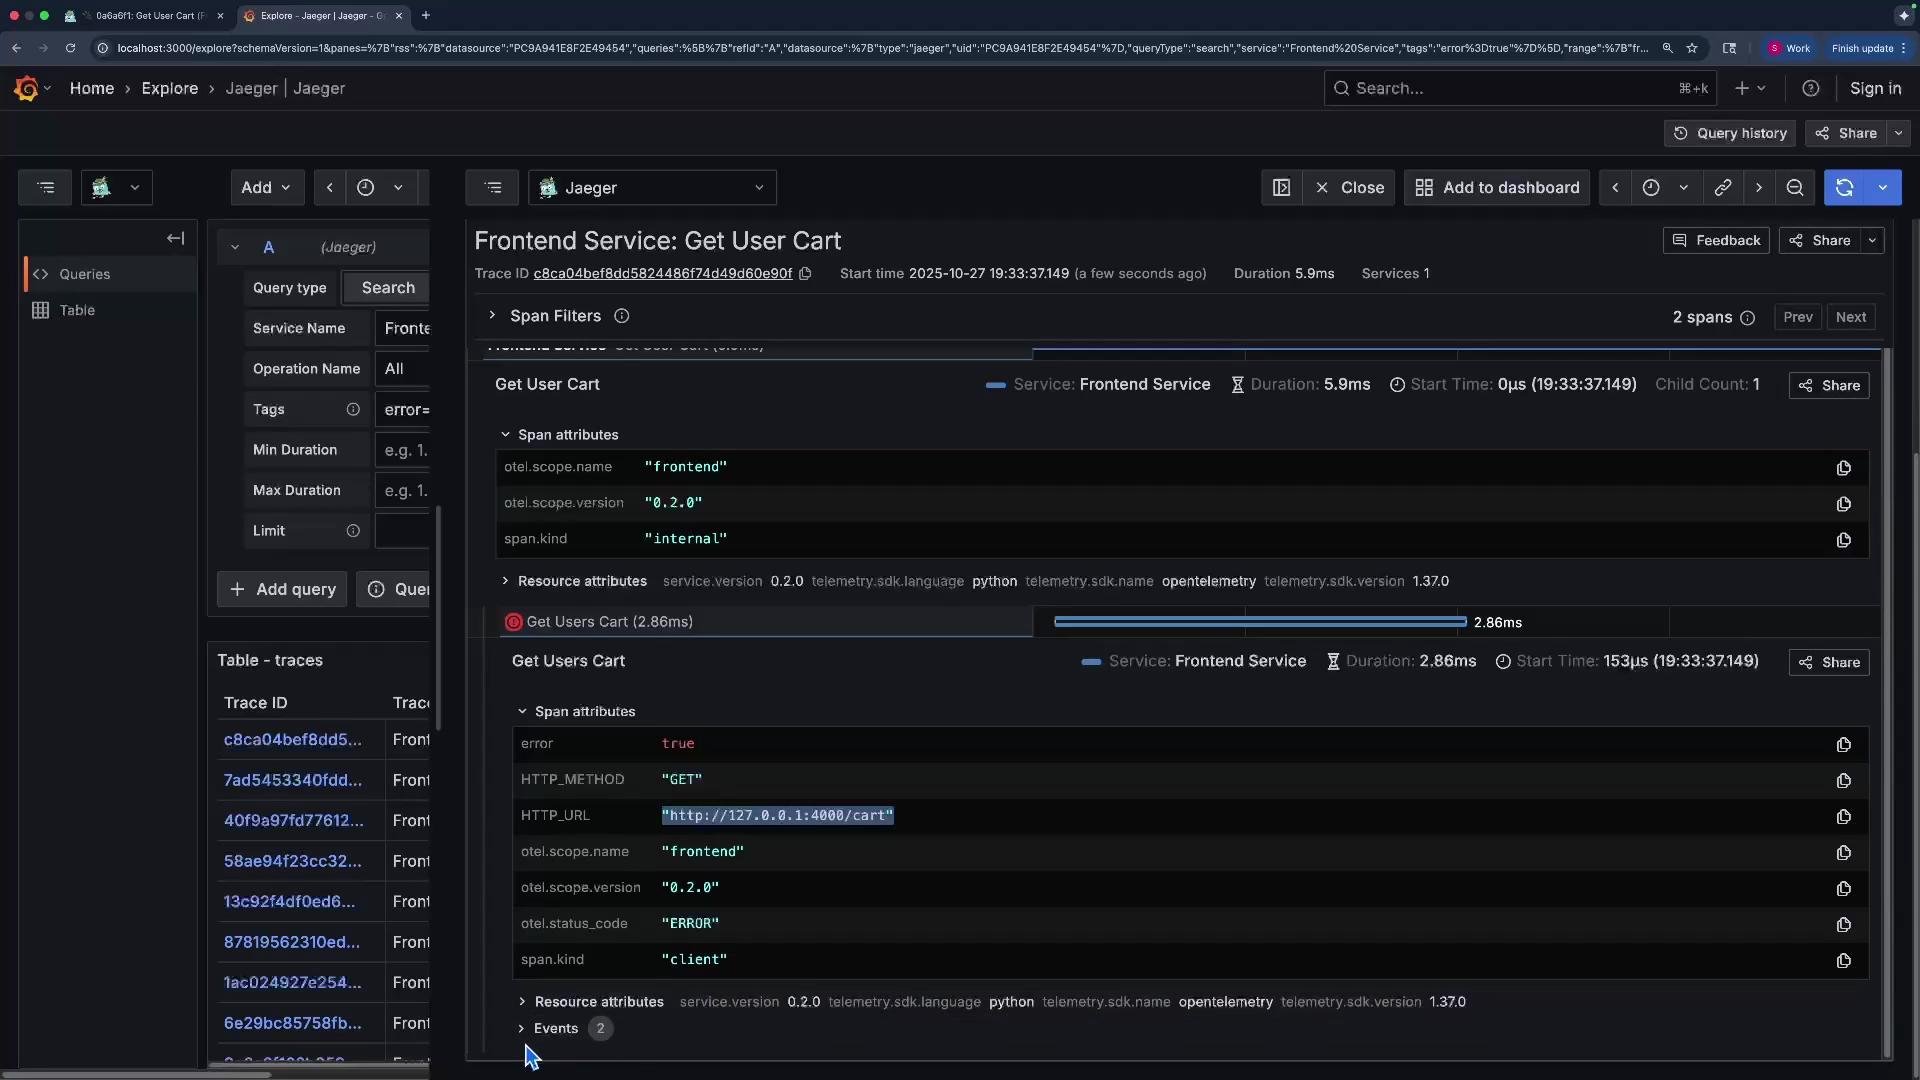
Traces capture errors and exceptions. When a request fails, the span may be marked `error = true` and include an exception event with a stack trace. Searching for traces where `error = true` helps you quickly surface failing requests.
Below is an example exception recorded as a span event. The frontend failed to connect to the cart service (connection refused). The exception payload includes the HTTP client error message and the Python stack trace, which drastically reduces time-to-fix.
Example span attributes for the slow DB client span:
* `otel.scope.name`: "charge.py"
* `otel.scope.version`: "0.5.0"
* `span.kind`: "client"
* `SQL_QUERY`: "select \* from recommended\_products"
These attributes let you hand off the exact problematic query and timing to the team that owns the database.
Use duration filters when troubleshooting performance problems: start broad (for example, `min duration > 1s`) and then drill into individual traces to identify the single offending span(s).
Traces and errors
Traces capture errors and exceptions. When a request fails, the span may be marked `error = true` and include an exception event with a stack trace. Searching for traces where `error = true` helps you quickly surface failing requests.
Below is an example exception recorded as a span event. The frontend failed to connect to the cart service (connection refused). The exception payload includes the HTTP client error message and the Python stack trace, which drastically reduces time-to-fix.
 ```plaintext theme={null}
event: "exception"
exception.escaped: "False"
message: "HTTPConnectionPool(host='127.0.0.1', port=4000): Max retries exceeded with url: /cart (Caused by NewConnectionError(': Failed to establish a new connection: [Errno 61] Connection refused'))"
Traceback (most recent call last):
File "/Users/sanjeev/.local/share/mise/installs/python3.11/lib/python3.11/site-packages/urllib3/connection.py", line 198, in _new_conn
sock = connection.create_connection(...)
File "/Users/sanjeev/.local/share/mise/installs/python3.11/lib/python3.11/site-packages/urllib3/util/connection.py", line 73, in create_connection
sock.connect(sa)
ConnectionRefusedError: [Errno 61] Connection refused
During handling of the above exception, another exception occurred:
Traceback (most recent call last):
File "/Users/sanjeev/Documents/courses/traces-overview-demo/frontend.py", line 152, in get_cart
resp = requests.get(url, headers=headers)
File "/Users/sanjeev/.local/share/virtualenvs/python3.11.13/lib/python3.11/site-packages/requests/api.py", line 73, in get
return request('GET', url, **kwargs)
File "/Users/sanjeev/.local/share/virtualenvs/python3.11.13/lib/python3.11/site-packages/requests/sessions.py", line 589, in send
r = adapter.send(request, **kwargs)
File "/Users/sanjeev/.local/share/mise/installs/python3.11/site-packages/requests/adapters.py", line 677, in send
raise ConnectionError(e, request=request)
requests.exceptions.ConnectionError: HTTPConnectionPool(host='127.0.0.1', port=4000): Max retries exceeded with url: /cart (Caused by NewConnectionError(': Failed to establish a new connection: [Errno 61] Connection refused'))
```
Embedding exceptions and stack traces into spans eliminates guesswork: you can see the exact failing call and error, enabling faster diagnosis of network or application faults.
Summary and next steps
* Traces provide correlated, time-ordered telemetry across service boundaries to pinpoint latency hotspots and failing calls.
* Instrument your services with the OpenTelemetry SDK for your language and configure an exporter (e.g., Jaeger) so services emit spans like the ones shown above.
* Focus on these practical steps when troubleshooting:
1. Filter traces by duration to find slow flows.
2. Drill into a trace and inspect per-span attributes and events.
3. Look for `error = true` spans and exception events for root cause details.
4. If available, use `db.statement` or `SQL_QUERY` to escalate DB problems.
References
* [OpenTelemetry](https://opentelemetry.io/)
* [Jaeger Tracing](https://www.jaegertracing.io/)
* [Grafana](https://grafana.com/)
```plaintext theme={null}
event: "exception"
exception.escaped: "False"
message: "HTTPConnectionPool(host='127.0.0.1', port=4000): Max retries exceeded with url: /cart (Caused by NewConnectionError(': Failed to establish a new connection: [Errno 61] Connection refused'))"
Traceback (most recent call last):
File "/Users/sanjeev/.local/share/mise/installs/python3.11/lib/python3.11/site-packages/urllib3/connection.py", line 198, in _new_conn
sock = connection.create_connection(...)
File "/Users/sanjeev/.local/share/mise/installs/python3.11/lib/python3.11/site-packages/urllib3/util/connection.py", line 73, in create_connection
sock.connect(sa)
ConnectionRefusedError: [Errno 61] Connection refused
During handling of the above exception, another exception occurred:
Traceback (most recent call last):
File "/Users/sanjeev/Documents/courses/traces-overview-demo/frontend.py", line 152, in get_cart
resp = requests.get(url, headers=headers)
File "/Users/sanjeev/.local/share/virtualenvs/python3.11.13/lib/python3.11/site-packages/requests/api.py", line 73, in get
return request('GET', url, **kwargs)
File "/Users/sanjeev/.local/share/virtualenvs/python3.11.13/lib/python3.11/site-packages/requests/sessions.py", line 589, in send
r = adapter.send(request, **kwargs)
File "/Users/sanjeev/.local/share/mise/installs/python3.11/site-packages/requests/adapters.py", line 677, in send
raise ConnectionError(e, request=request)
requests.exceptions.ConnectionError: HTTPConnectionPool(host='127.0.0.1', port=4000): Max retries exceeded with url: /cart (Caused by NewConnectionError(': Failed to establish a new connection: [Errno 61] Connection refused'))
```
Embedding exceptions and stack traces into spans eliminates guesswork: you can see the exact failing call and error, enabling faster diagnosis of network or application faults.
Summary and next steps
* Traces provide correlated, time-ordered telemetry across service boundaries to pinpoint latency hotspots and failing calls.
* Instrument your services with the OpenTelemetry SDK for your language and configure an exporter (e.g., Jaeger) so services emit spans like the ones shown above.
* Focus on these practical steps when troubleshooting:
1. Filter traces by duration to find slow flows.
2. Drill into a trace and inspect per-span attributes and events.
3. Look for `error = true` spans and exception events for root cause details.
4. If available, use `db.statement` or `SQL_QUERY` to escalate DB problems.
References
* [OpenTelemetry](https://opentelemetry.io/)
* [Jaeger Tracing](https://www.jaegertracing.io/)
* [Grafana](https://grafana.com/)