> ## Documentation Index
> Fetch the complete documentation index at: https://notes.kodekloud.com/llms.txt
> Use this file to discover all available pages before exploring further.
# Span Events
> Explains span events as timestamped annotations inside spans that record exceptions, milestones, and contextual attributes to aid debugging, correlation, and latency analysis.
Span events let you record discrete, timestamped moments inside a span. They enrich a trace with point-in-time annotations that go beyond the span's start and end timestamps, making it easier to debug, correlate errors, and understand latency.
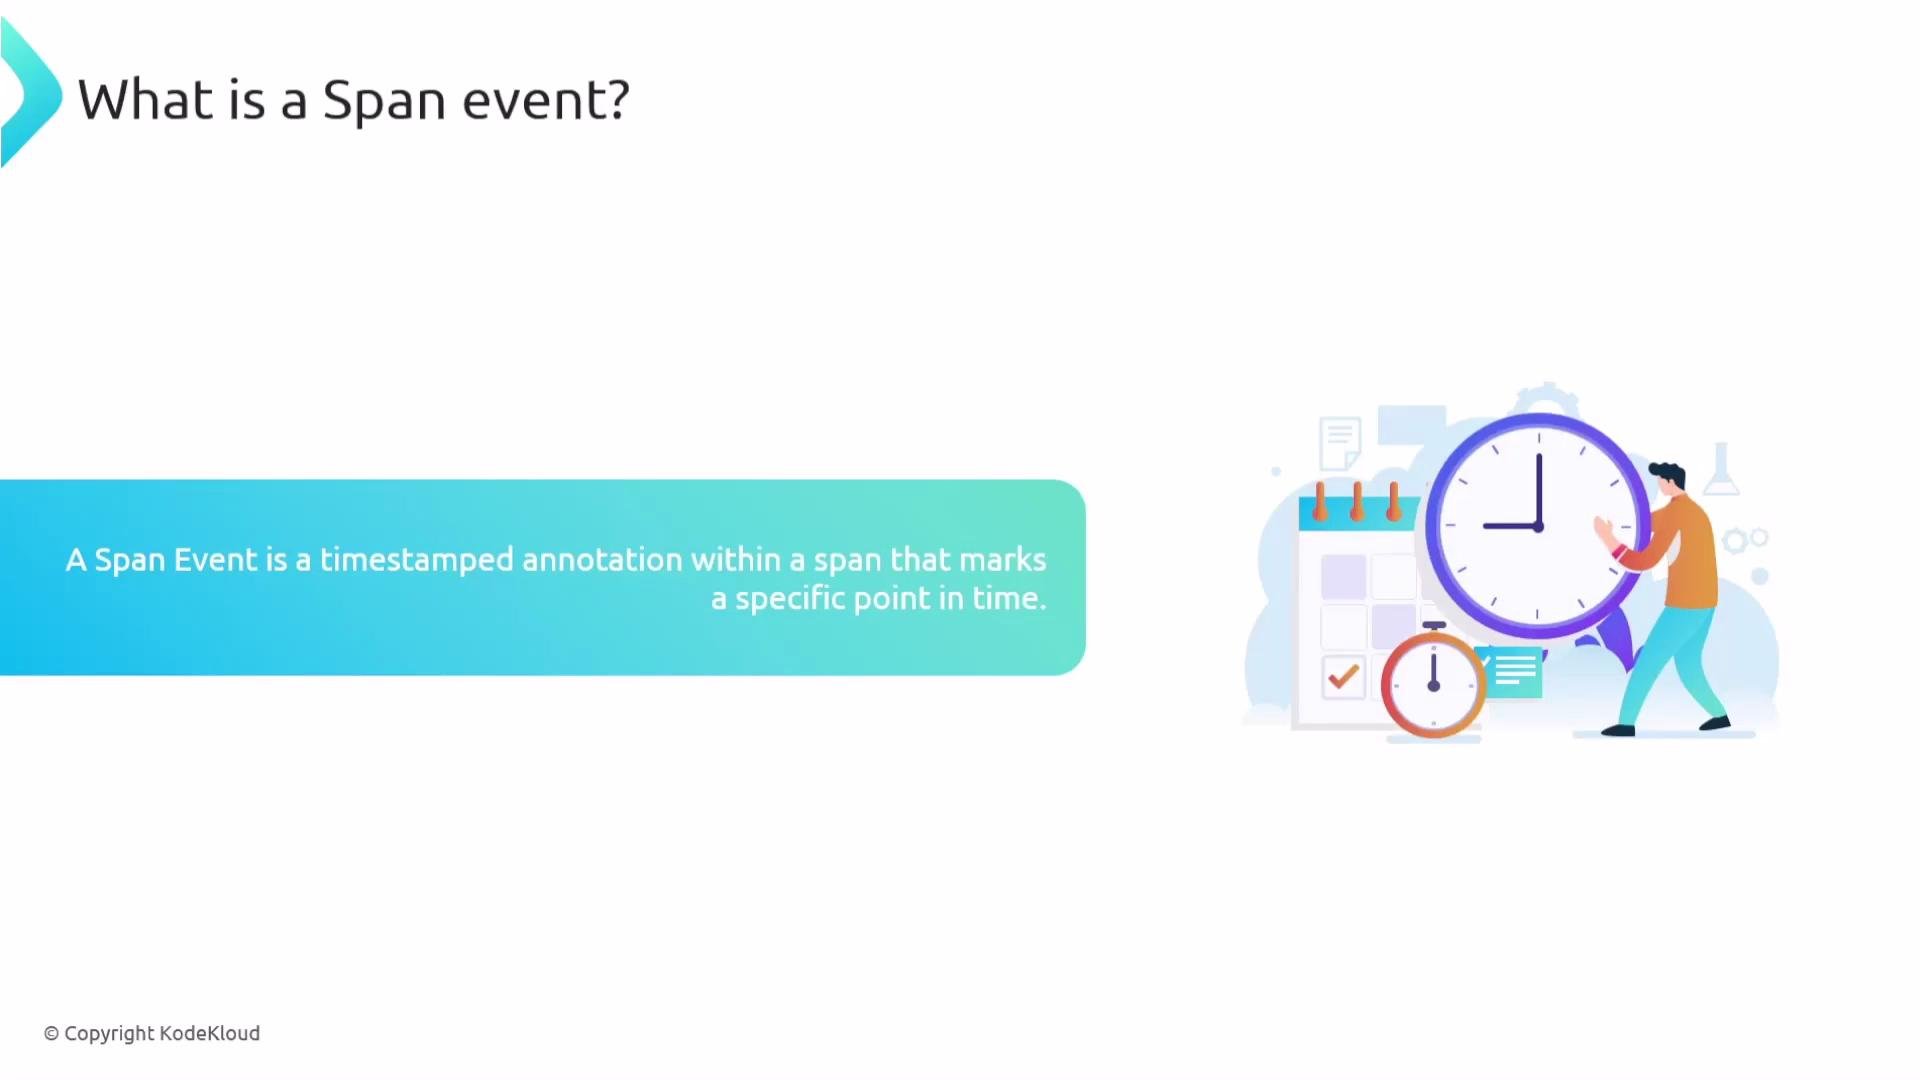
A span event is a timestamped annotation — a point-in-time marker inside a span that highlights when something specific occurred.
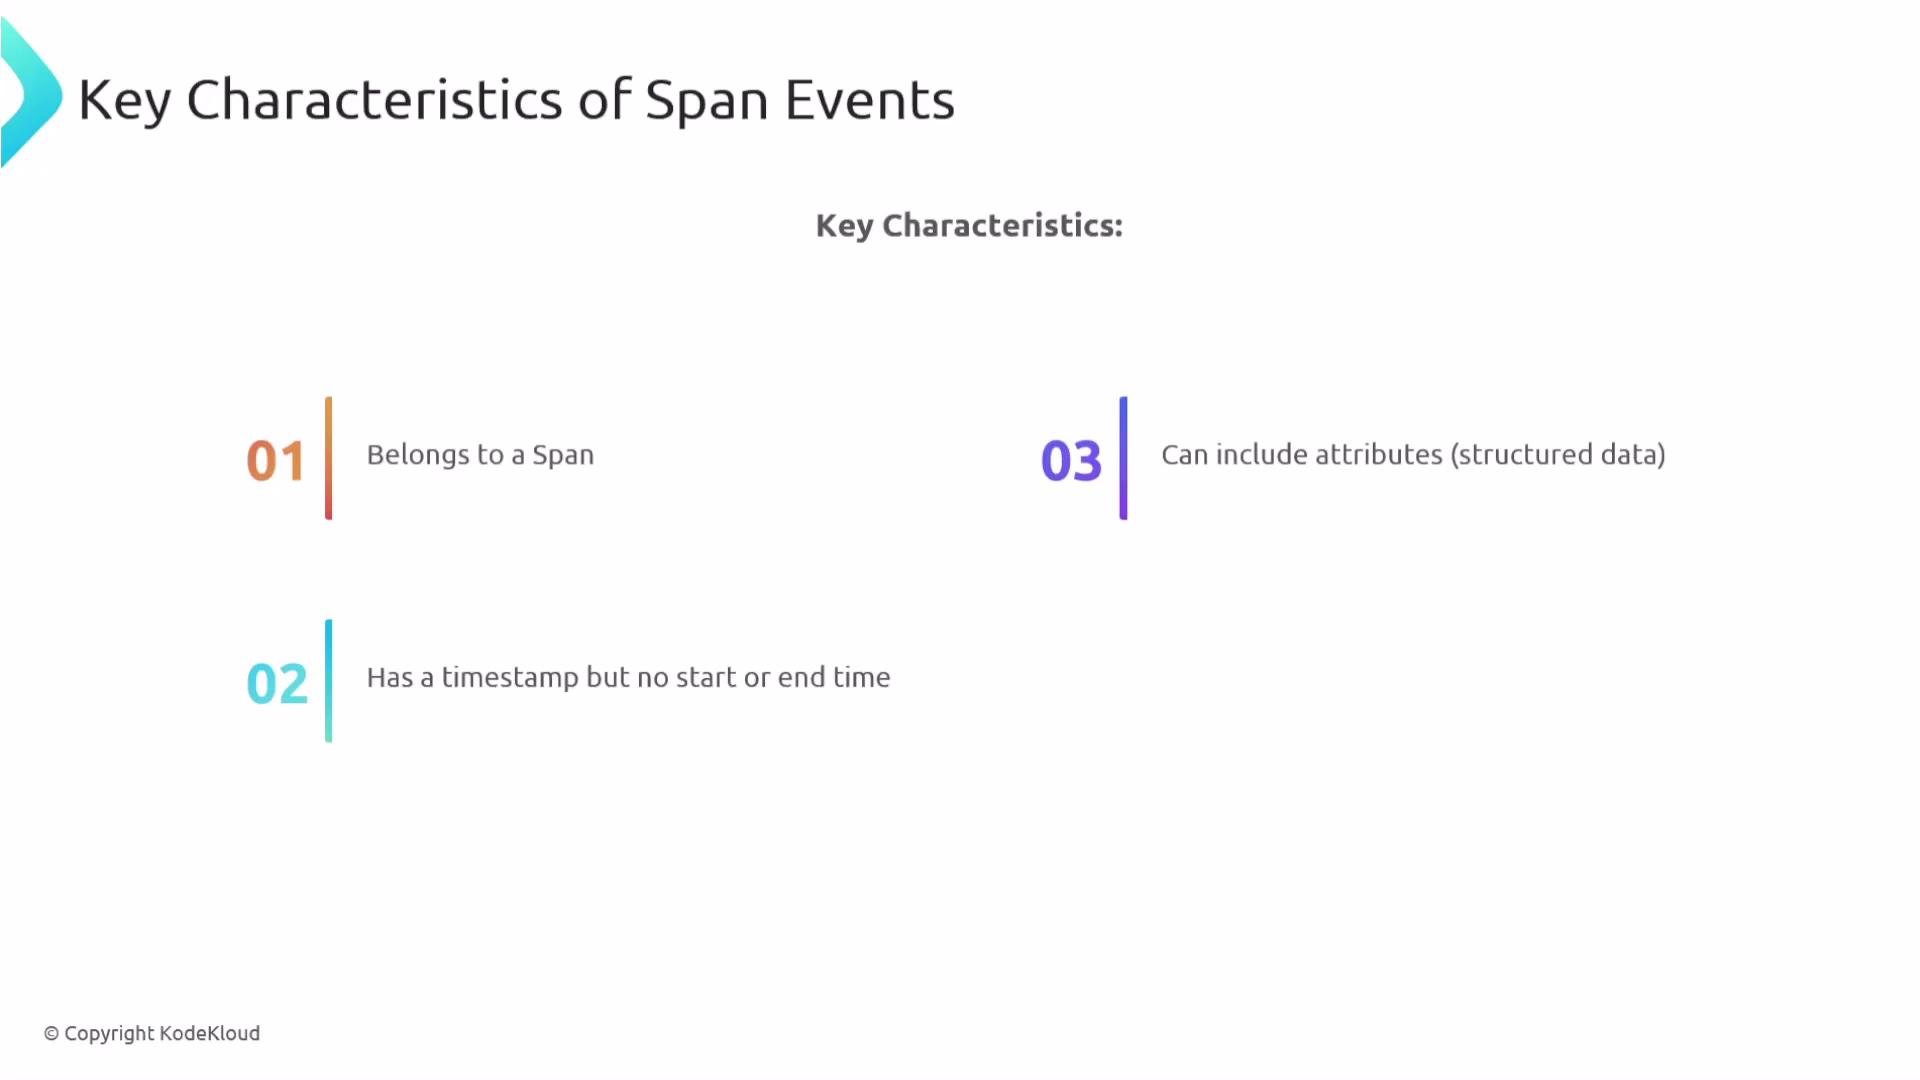
 What makes a span event unique:
* Each event belongs to a span; it cannot exist independently.
* An event has a single timestamp (there is no start/end time).
* Events can carry structured attributes to provide contextual detail.
What makes a span event unique:
* Each event belongs to a span; it cannot exist independently.
* An event has a single timestamp (there is no start/end time).
* Events can carry structured attributes to provide contextual detail.
 Quick reference: Characteristics and common attributes
| Characteristic | Why it matters | Typical attributes |
| --------------------- | -------------------------------------------------: | ------------------------------------------------------ |
| Belongs to a span | Keeps events tied to trace context for correlation | `trace_id`, `span_id` |
| Single timestamp | Pinpoints when an event occurred | `timestamp` |
| Structured attributes | Attach context (errors, counts, metadata) | `exception.type`, `exception.message`, `result_length` |
Common uses are capturing milestones such as a DB query completion, an external API response, or an exception. When recording an exception, include attributes like `exception.type`, `exception.message`, and `exception.stacktrace`. Example JSON event:
```json theme={null}
{
"events": [
{
"name": "exception",
"timestamp": "2025-05-01T12:58:08.969805Z",
"attributes": {
"exception.type": "HTTPError",
"exception.message": "404 Not Found",
"exception.stacktrace": "raise_for_status() -> HTTPError",
"exception.escaped": false
}
}
]
}
```
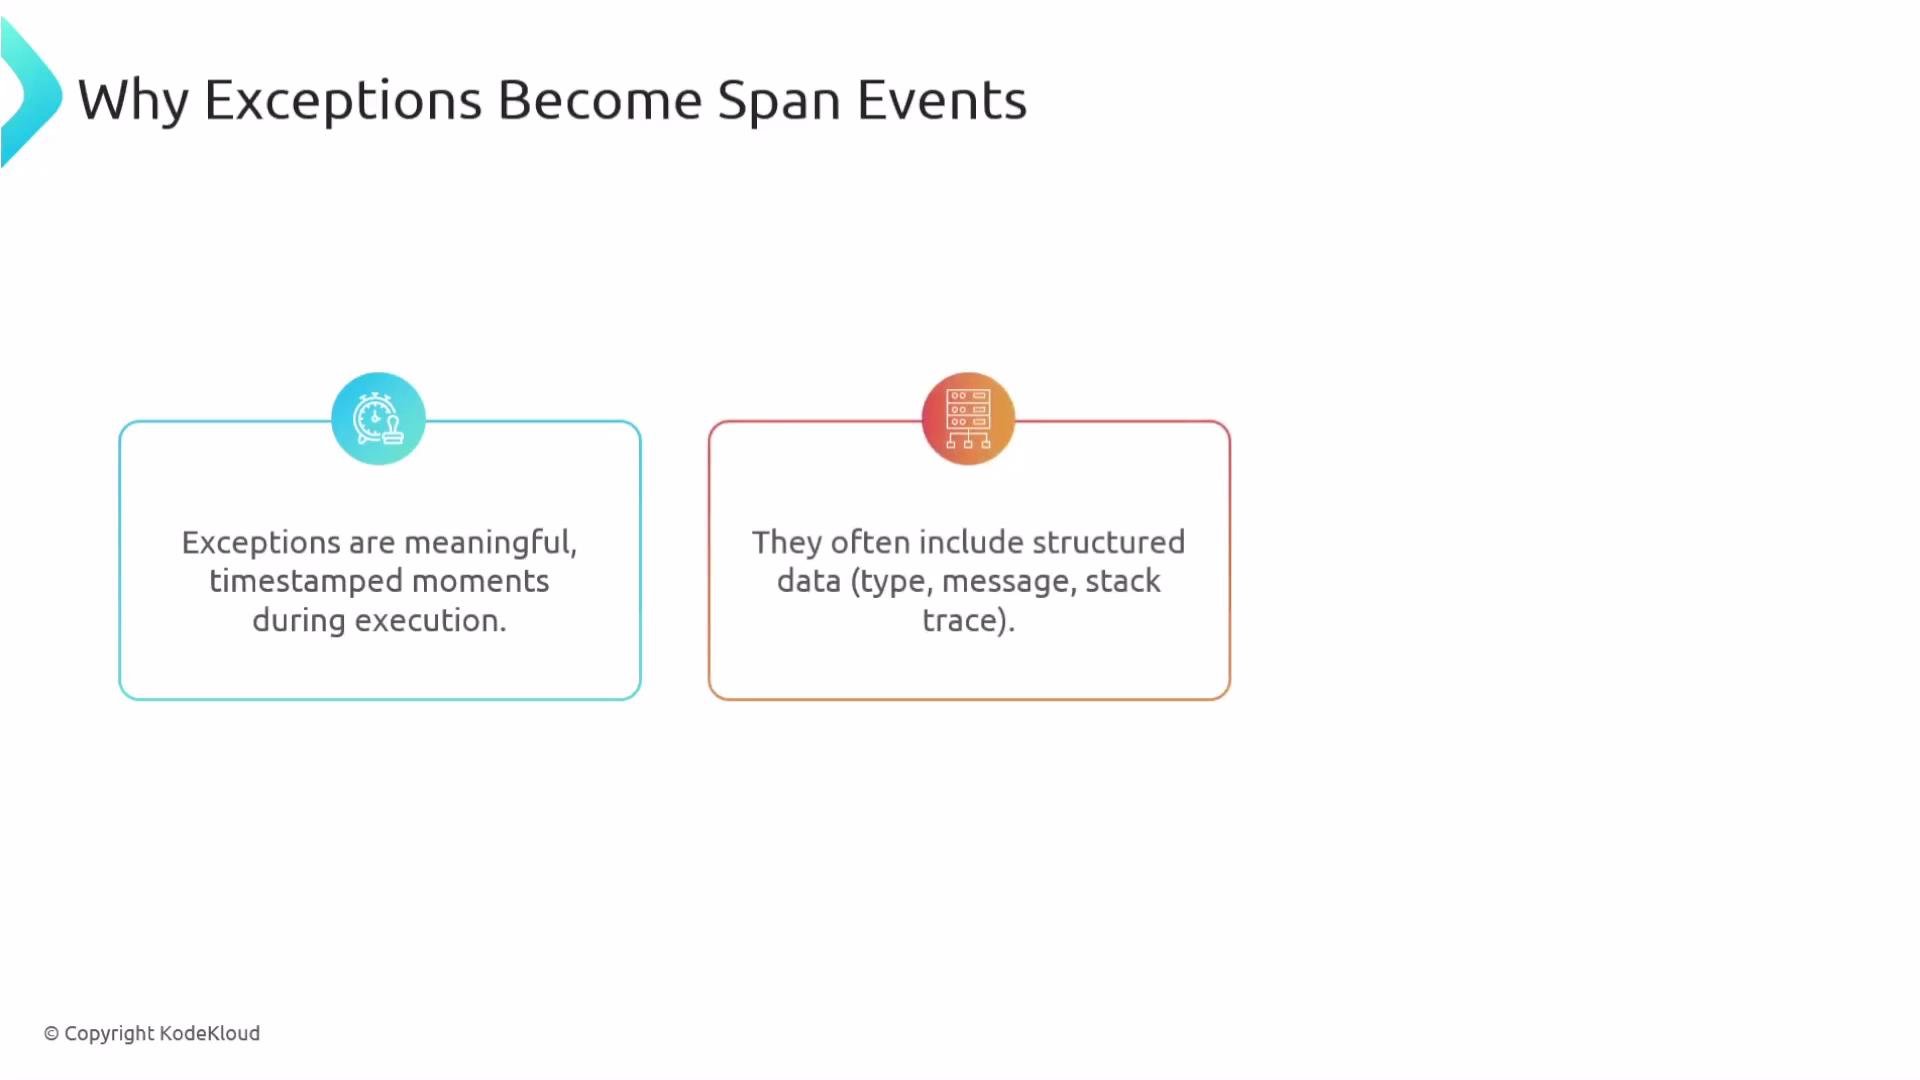
[OpenTelemetry](https://opentelemetry.io/docs/specs/otel/semantic_conventions/exceptions/) recommends recording exceptions as span events so they remain connected to the trace context and are timestamped for easier debugging.
Recording exceptions as span events keeps the error context within the trace itself, simplifying root-cause analysis and making it easier to see exactly when and where a problem happened.
Quick reference: Characteristics and common attributes
| Characteristic | Why it matters | Typical attributes |
| --------------------- | -------------------------------------------------: | ------------------------------------------------------ |
| Belongs to a span | Keeps events tied to trace context for correlation | `trace_id`, `span_id` |
| Single timestamp | Pinpoints when an event occurred | `timestamp` |
| Structured attributes | Attach context (errors, counts, metadata) | `exception.type`, `exception.message`, `result_length` |
Common uses are capturing milestones such as a DB query completion, an external API response, or an exception. When recording an exception, include attributes like `exception.type`, `exception.message`, and `exception.stacktrace`. Example JSON event:
```json theme={null}
{
"events": [
{
"name": "exception",
"timestamp": "2025-05-01T12:58:08.969805Z",
"attributes": {
"exception.type": "HTTPError",
"exception.message": "404 Not Found",
"exception.stacktrace": "raise_for_status() -> HTTPError",
"exception.escaped": false
}
}
]
}
```
[OpenTelemetry](https://opentelemetry.io/docs/specs/otel/semantic_conventions/exceptions/) recommends recording exceptions as span events so they remain connected to the trace context and are timestamped for easier debugging.
Recording exceptions as span events keeps the error context within the trace itself, simplifying root-cause analysis and making it easier to see exactly when and where a problem happened.
 One major advantage: span events bring log-level detail into traces. This reduces the need to cross-reference separate logging systems when investigating an issue.
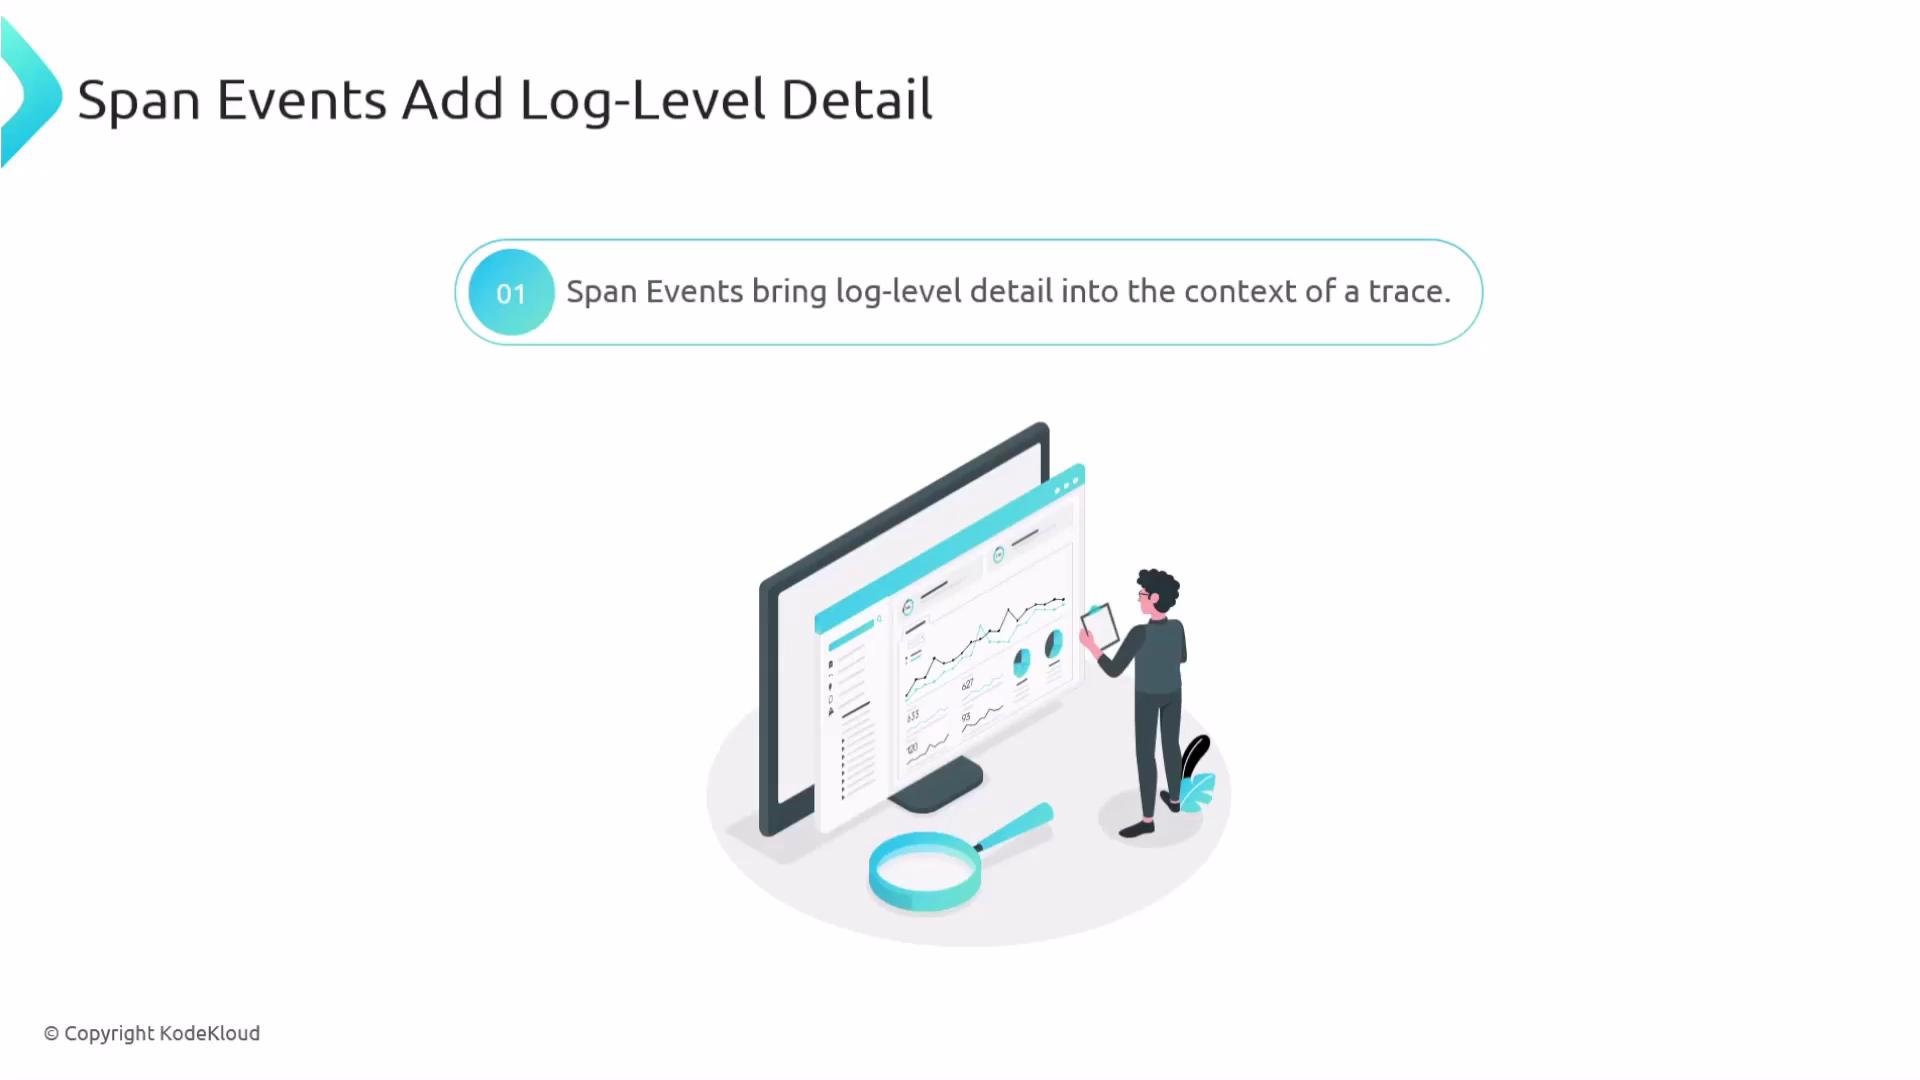 This approach streamlines troubleshooting: inspect a trace and view the exact message and attributes recorded at the moment the event occurred.
 Span events are especially useful for debugging and for identifying contributors to latency in a request’s journey.
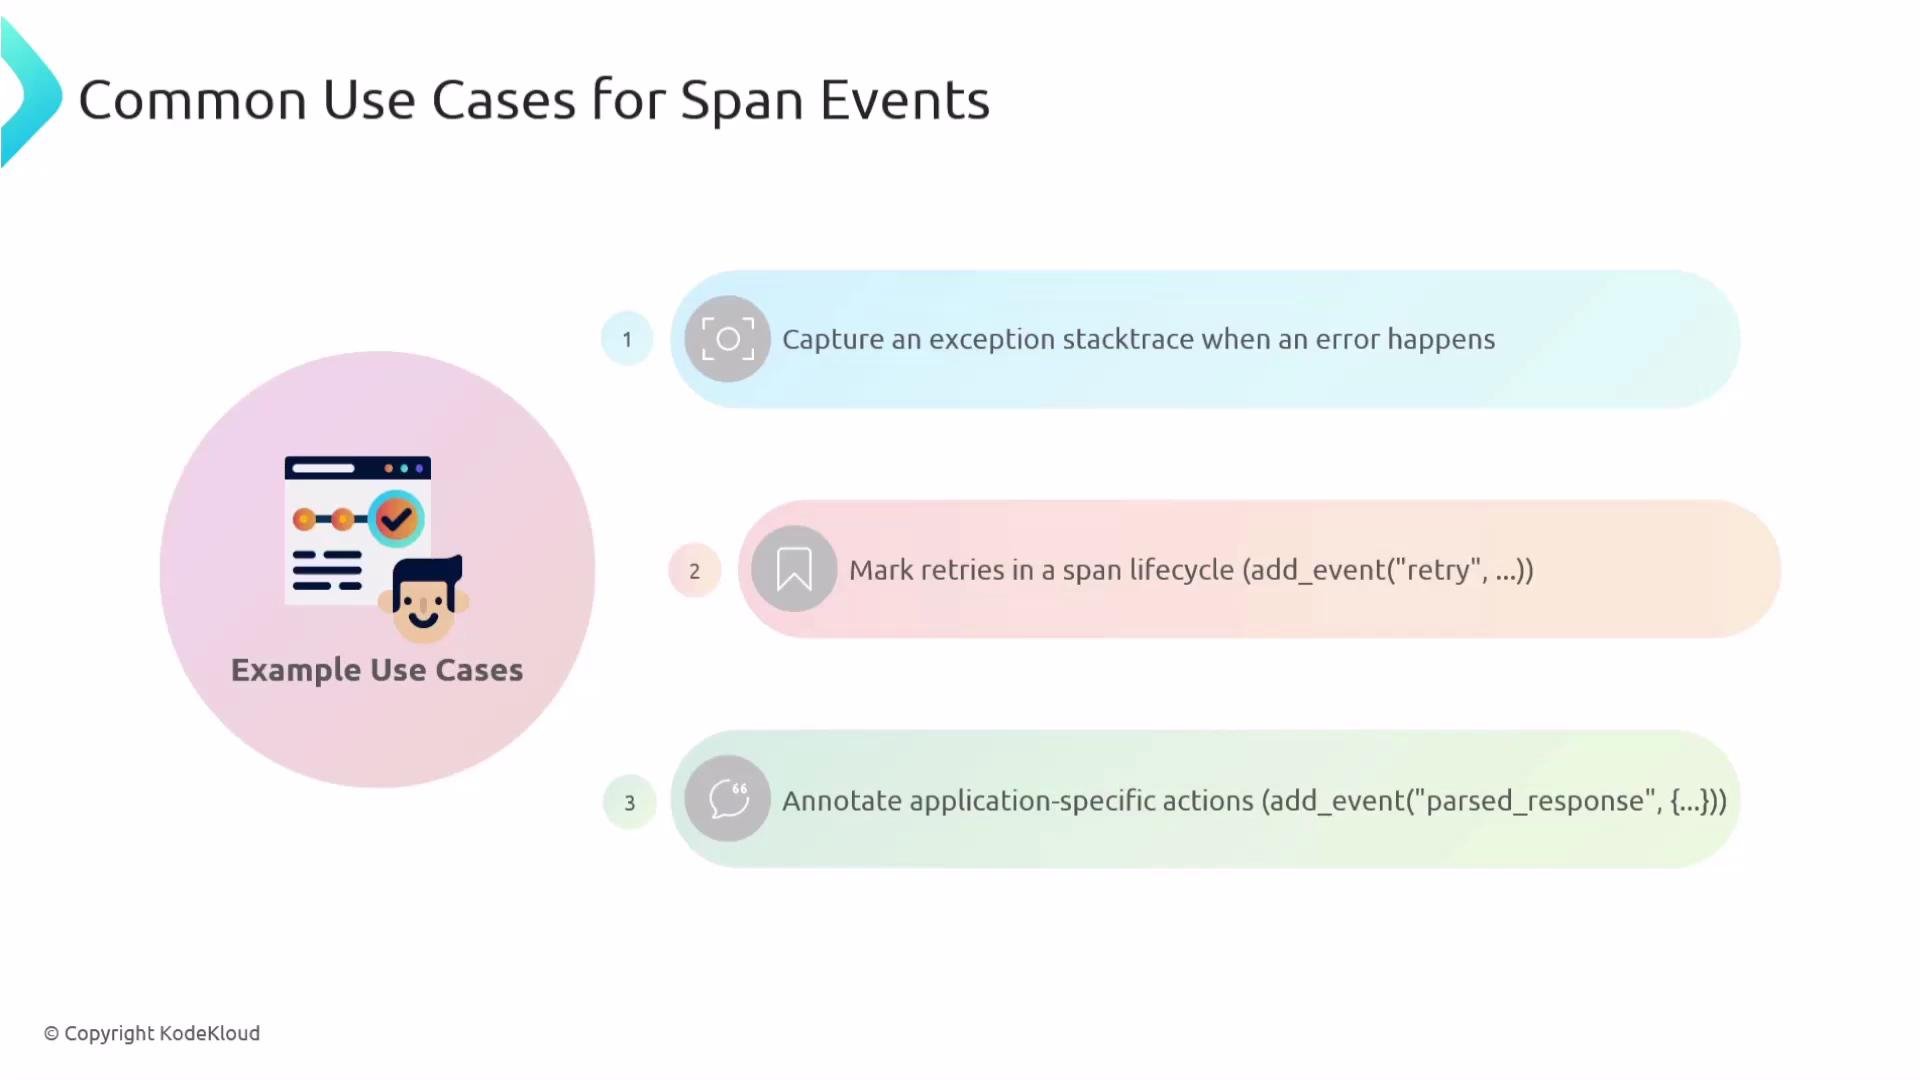
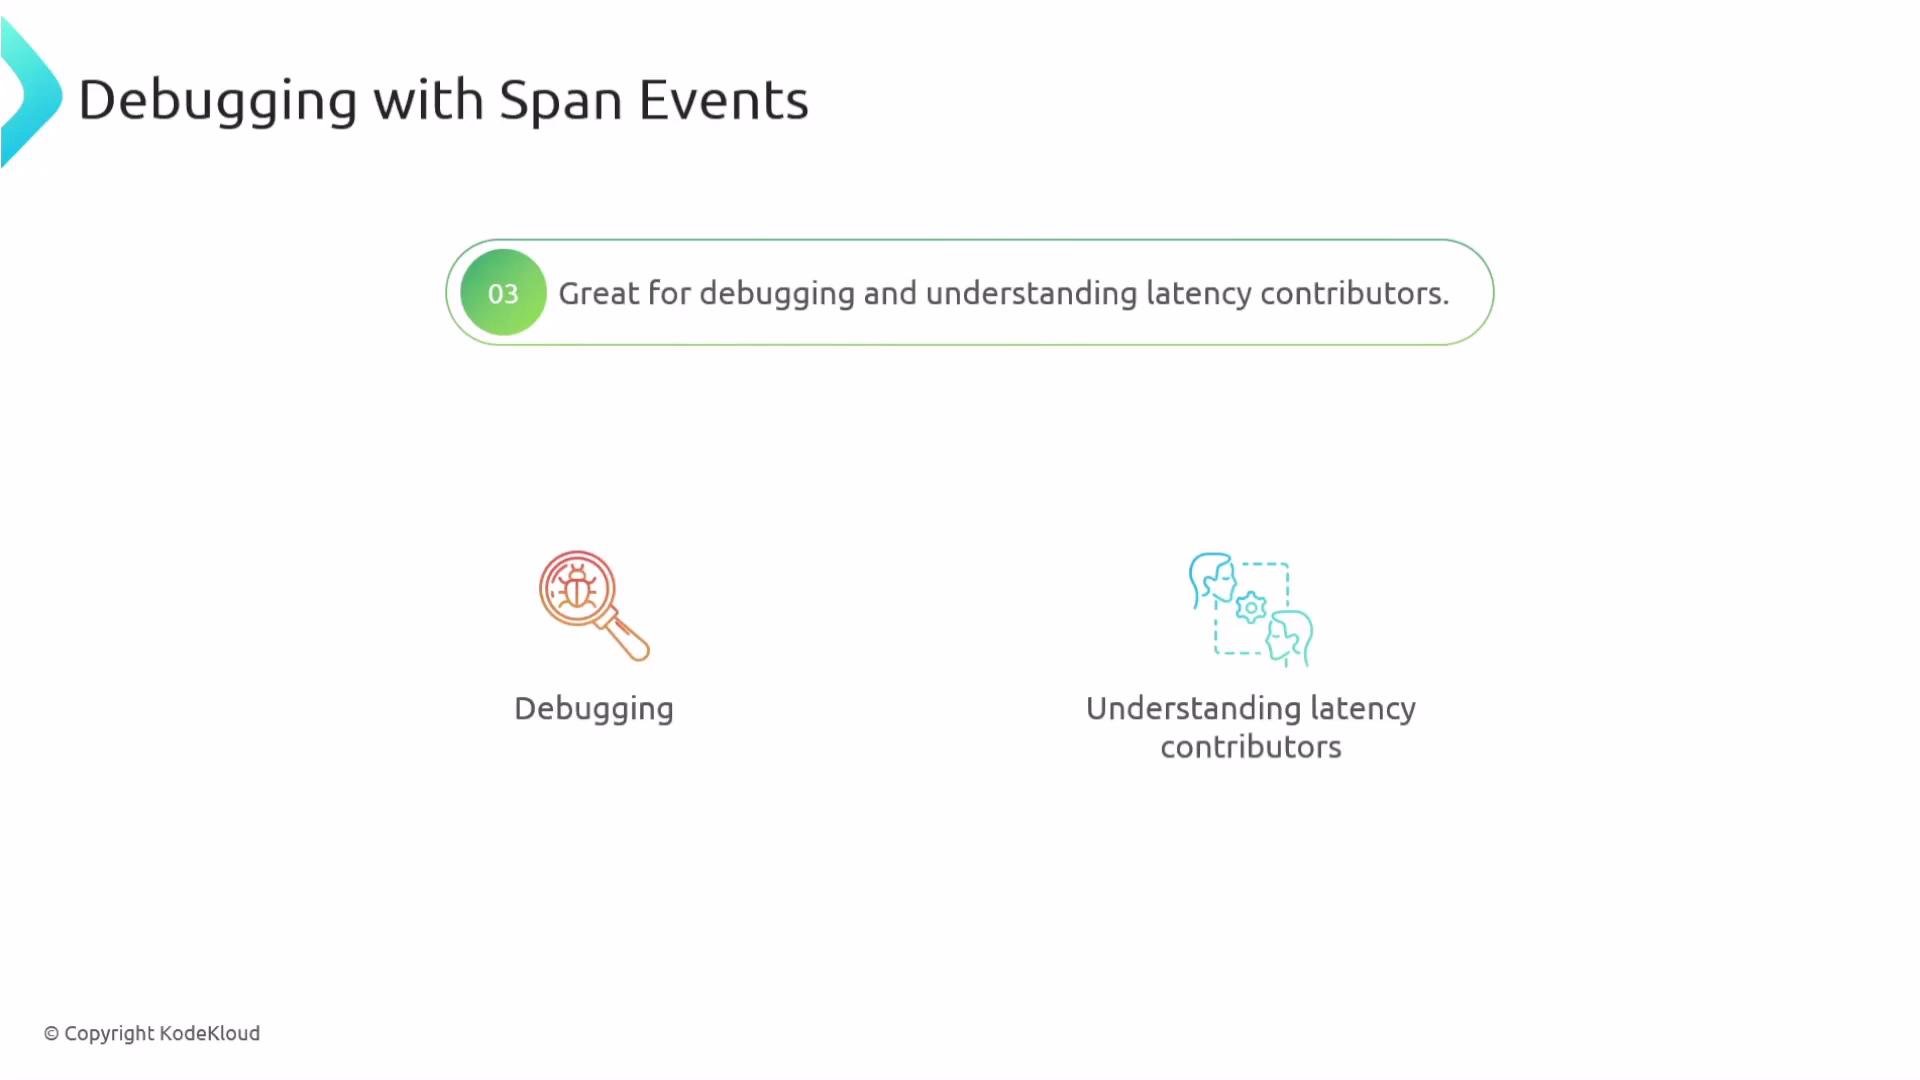 Common span-event use cases:
* Capturing a stack trace or exception details when an error occurs.
* Marking retries or backoff events inside a span.
* Annotating application-specific checkpoints (e.g., parsing completed, cache miss).
* Recording important external call completions or timeouts.
Common span-event use cases:
* Capturing a stack trace or exception details when an error occurs.
* Marking retries or backoff events inside a span.
* Annotating application-specific checkpoints (e.g., parsing completed, cache miss).
* Recording important external call completions or timeouts.
 A single span can contain multiple events, each representing a distinct point-in-time action. Example of a span with several events:
```json theme={null}
{
"name": "main_function_span",
"context": {
"trace_id": "0x6d4a0605d5d4cb37f8e117ac0069a52",
"span_id": "0x3f73ffe9da555ea",
"trace_state": []
},
"kind": "SpanKind.INTERNAL",
"parent_id": null,
"start_time": "2025-10-17T12:57:33.567313Z",
"end_time": "2025-10-17T12:57:53.210426Z",
"status": {
"status_code": "UNSET"
},
"attributes": {},
"events": [
{
"name": "Starting main function execution",
"timestamp": "2025-10-17T12:57:33.567313Z",
"attributes": {}
},
{
"name": "Slow API call completed",
"timestamp": "2025-10-17T12:57:53.210337Z",
"attributes": {
"result_length": 359
}
},
{
"name": "Main function execution complete",
"timestamp": "2025-10-17T12:57:53.210410Z",
"attributes": {}
}
]
}
```
Each event maintains its own timestamp and attributes, letting you inspect the precise sequence of actions that took place during the span’s lifetime.
Exceptions are commonly reported automatically by tracing instrumentation as span events. To add custom events manually, call the span object's `add_event` (or equivalent) API in your SDK. Example in Python:
```python theme={null}
span.add_event(
"Slow API call completed",
attributes={"result_length": len(result)}
)
```
After adding the event, it will appear in the span’s trace data and show up in your tracing UI alongside other events for that span.
Links and references
* [OpenTelemetry: Exceptions semantic conventions](https://opentelemetry.io/docs/specs/otel/semantic_conventions/exceptions/)
* [OpenTelemetry: Tracing overview](https://opentelemetry.io/docs/specs/otel/overview/)
* [OpenTelemetry SDKs and APIs](https://opentelemetry.io/docs/)
A single span can contain multiple events, each representing a distinct point-in-time action. Example of a span with several events:
```json theme={null}
{
"name": "main_function_span",
"context": {
"trace_id": "0x6d4a0605d5d4cb37f8e117ac0069a52",
"span_id": "0x3f73ffe9da555ea",
"trace_state": []
},
"kind": "SpanKind.INTERNAL",
"parent_id": null,
"start_time": "2025-10-17T12:57:33.567313Z",
"end_time": "2025-10-17T12:57:53.210426Z",
"status": {
"status_code": "UNSET"
},
"attributes": {},
"events": [
{
"name": "Starting main function execution",
"timestamp": "2025-10-17T12:57:33.567313Z",
"attributes": {}
},
{
"name": "Slow API call completed",
"timestamp": "2025-10-17T12:57:53.210337Z",
"attributes": {
"result_length": 359
}
},
{
"name": "Main function execution complete",
"timestamp": "2025-10-17T12:57:53.210410Z",
"attributes": {}
}
]
}
```
Each event maintains its own timestamp and attributes, letting you inspect the precise sequence of actions that took place during the span’s lifetime.
Exceptions are commonly reported automatically by tracing instrumentation as span events. To add custom events manually, call the span object's `add_event` (or equivalent) API in your SDK. Example in Python:
```python theme={null}
span.add_event(
"Slow API call completed",
attributes={"result_length": len(result)}
)
```
After adding the event, it will appear in the span’s trace data and show up in your tracing UI alongside other events for that span.
Links and references
* [OpenTelemetry: Exceptions semantic conventions](https://opentelemetry.io/docs/specs/otel/semantic_conventions/exceptions/)
* [OpenTelemetry: Tracing overview](https://opentelemetry.io/docs/specs/otel/overview/)
* [OpenTelemetry SDKs and APIs](https://opentelemetry.io/docs/)