> ## Documentation Index
> Fetch the complete documentation index at: https://notes.kodekloud.com/llms.txt
> Use this file to discover all available pages before exploring further.
# Demo Sampling Strategies
> Demonstrates implementing probabilistic and tail sampling in an OpenTelemetry Collector pipeline, including configuration examples, composite policies to keep errors, and tuning considerations for memory and latency.
This lesson demonstrates how to implement sampling in an OpenTelemetry Collector pipeline. You'll learn how to:
* Send traces to a Collector with no sampling.
* Apply probabilistic sampling for simple percentage-based reduction.
* Use tail sampling to make decisions after a trace has completed.
* Combine policies (composite tail sampling) to always keep errors while sampling non-error traces.
Overview of the starting Collector configuration
* The Collector accepts OTLP over gRPC and HTTP.
* Exporters are configured for Jaeger (OTLP) and a detailed debug exporter.
* For clarity this example shows traces only; metrics and logs use the same concepts and similar configuration.
Initial Collector config
```yaml theme={null}
receivers:
otlp:
protocols:
grpc:
endpoint: 0.0.0.0:4317
http:
endpoint: 0.0.0.0:4318
exporters:
prometheusremotewrite:
endpoint: "http://prometheus:9090/api/v1/write"
otlp/jaeger:
endpoint: http://jaeger:4317
tls:
insecure: true
debug:
verbosity: detailed
service:
pipelines:
traces:
receivers: [otlp]
exporters: [debug, otlp/jaeger]
metrics:
receivers: [otlp]
exporters: [debug]
logs:
receivers: [otlp]
exporters: [debug]
```
Send sample traces without any sampling
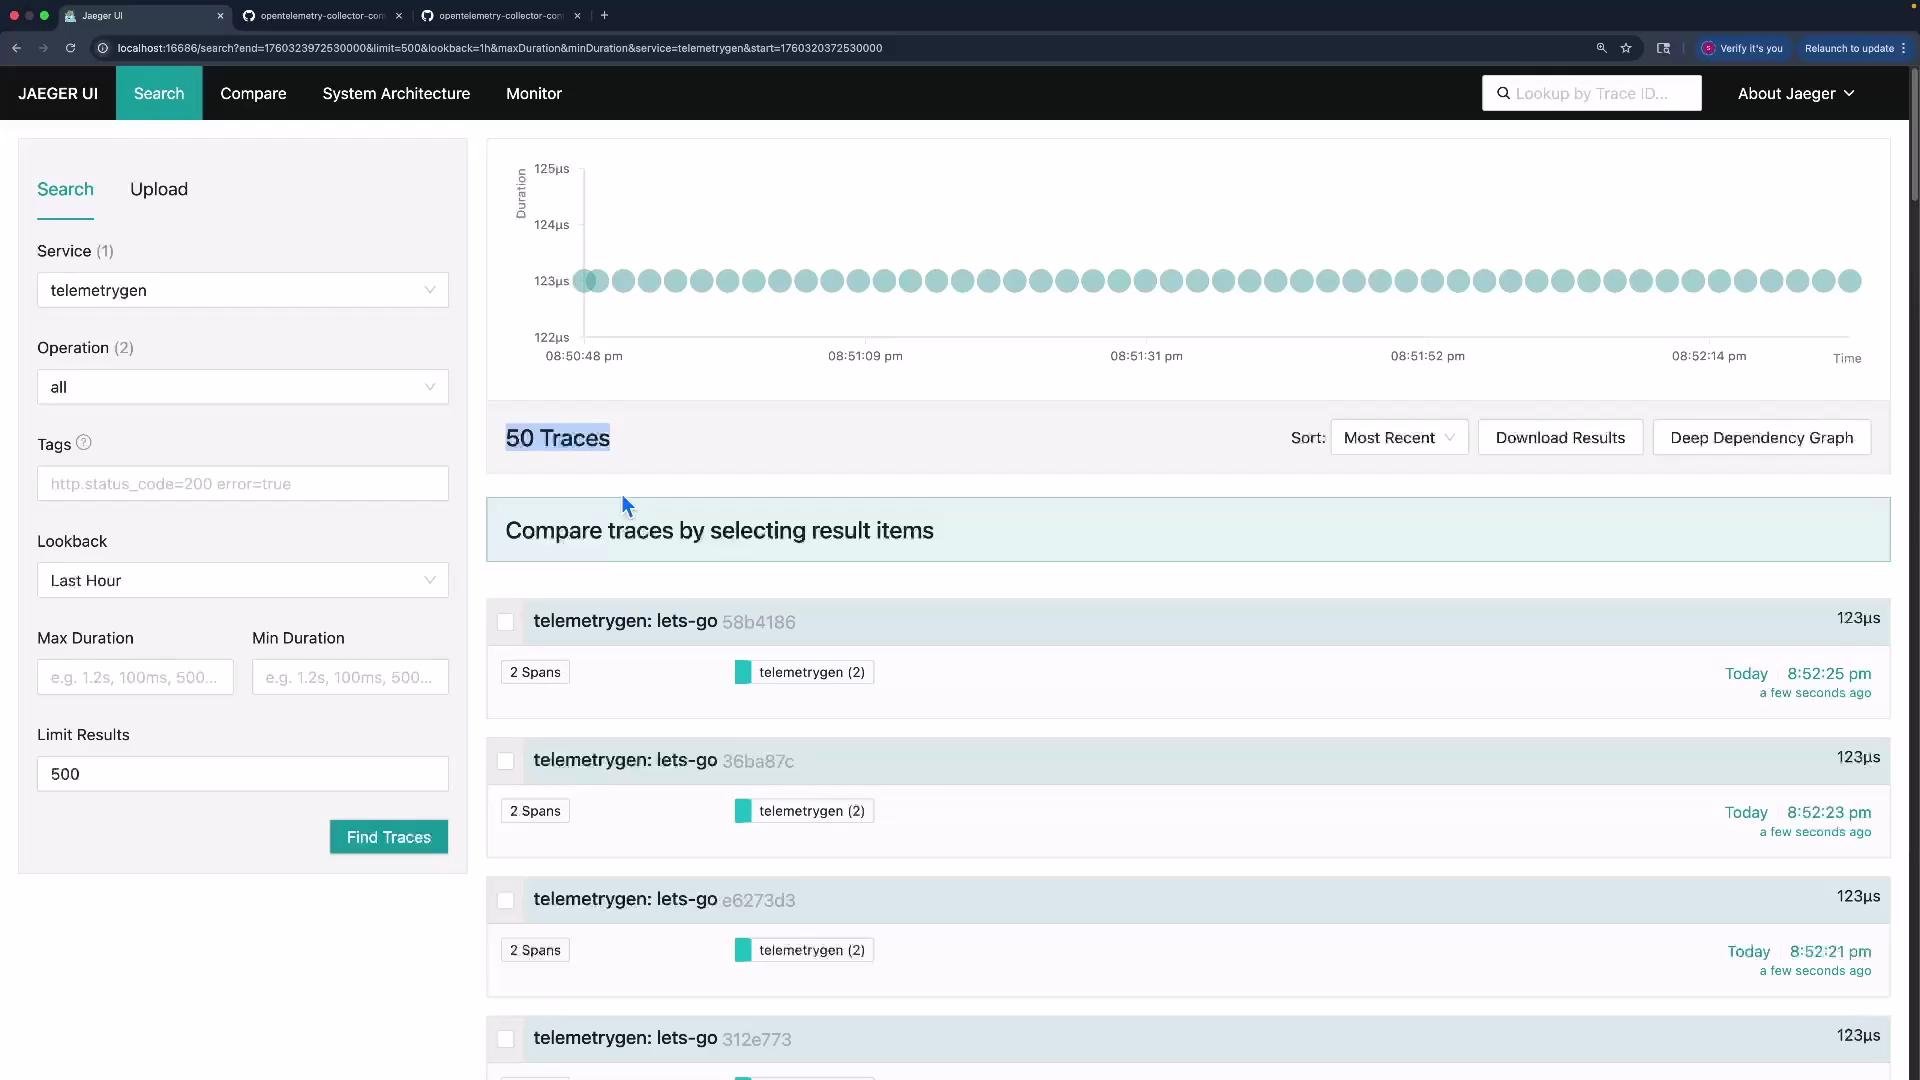
* Generate 50 traces using telemetrygen and send them to the Collector via OTLP HTTP (insecure).
* Adjust `GOBIN` if needed.
Commands:
```bash theme={null}
export GOBIN=${GOBIN:=$(go env GOPATH)/bin}
$GOBIN/telemetrygen traces --otlp-insecure --otlp-http --traces 50
```
Trimmed sample telemetrygen output:
```plaintext theme={null}
2025-10-12T20:50:48.317-0600 INFO traces/traces.go:40 starting HTTP exporter
2025-10-12T20:50:48.317-0600 INFO traces/traces.go:118 generation of traces is limited {"per-second": 1}
2025-10-12T20:52:27.318-0600 INFO traces/worker.go:15 traces generated {"worker": 0, "traces": 50}
2025-10-12T20:52:27.321-0600 INFO traces/traces.go:74 stop the batch span processor
2025-10-12T20:52:27.321-0600 INFO traces/traces.go:64 stopping the exporter
```
Because no sampling is active, all 50 traces should be processed and forwarded to the configured exporters (debug output and Jaeger).
 Probabilistic sampling (simple percentage-based sampling)
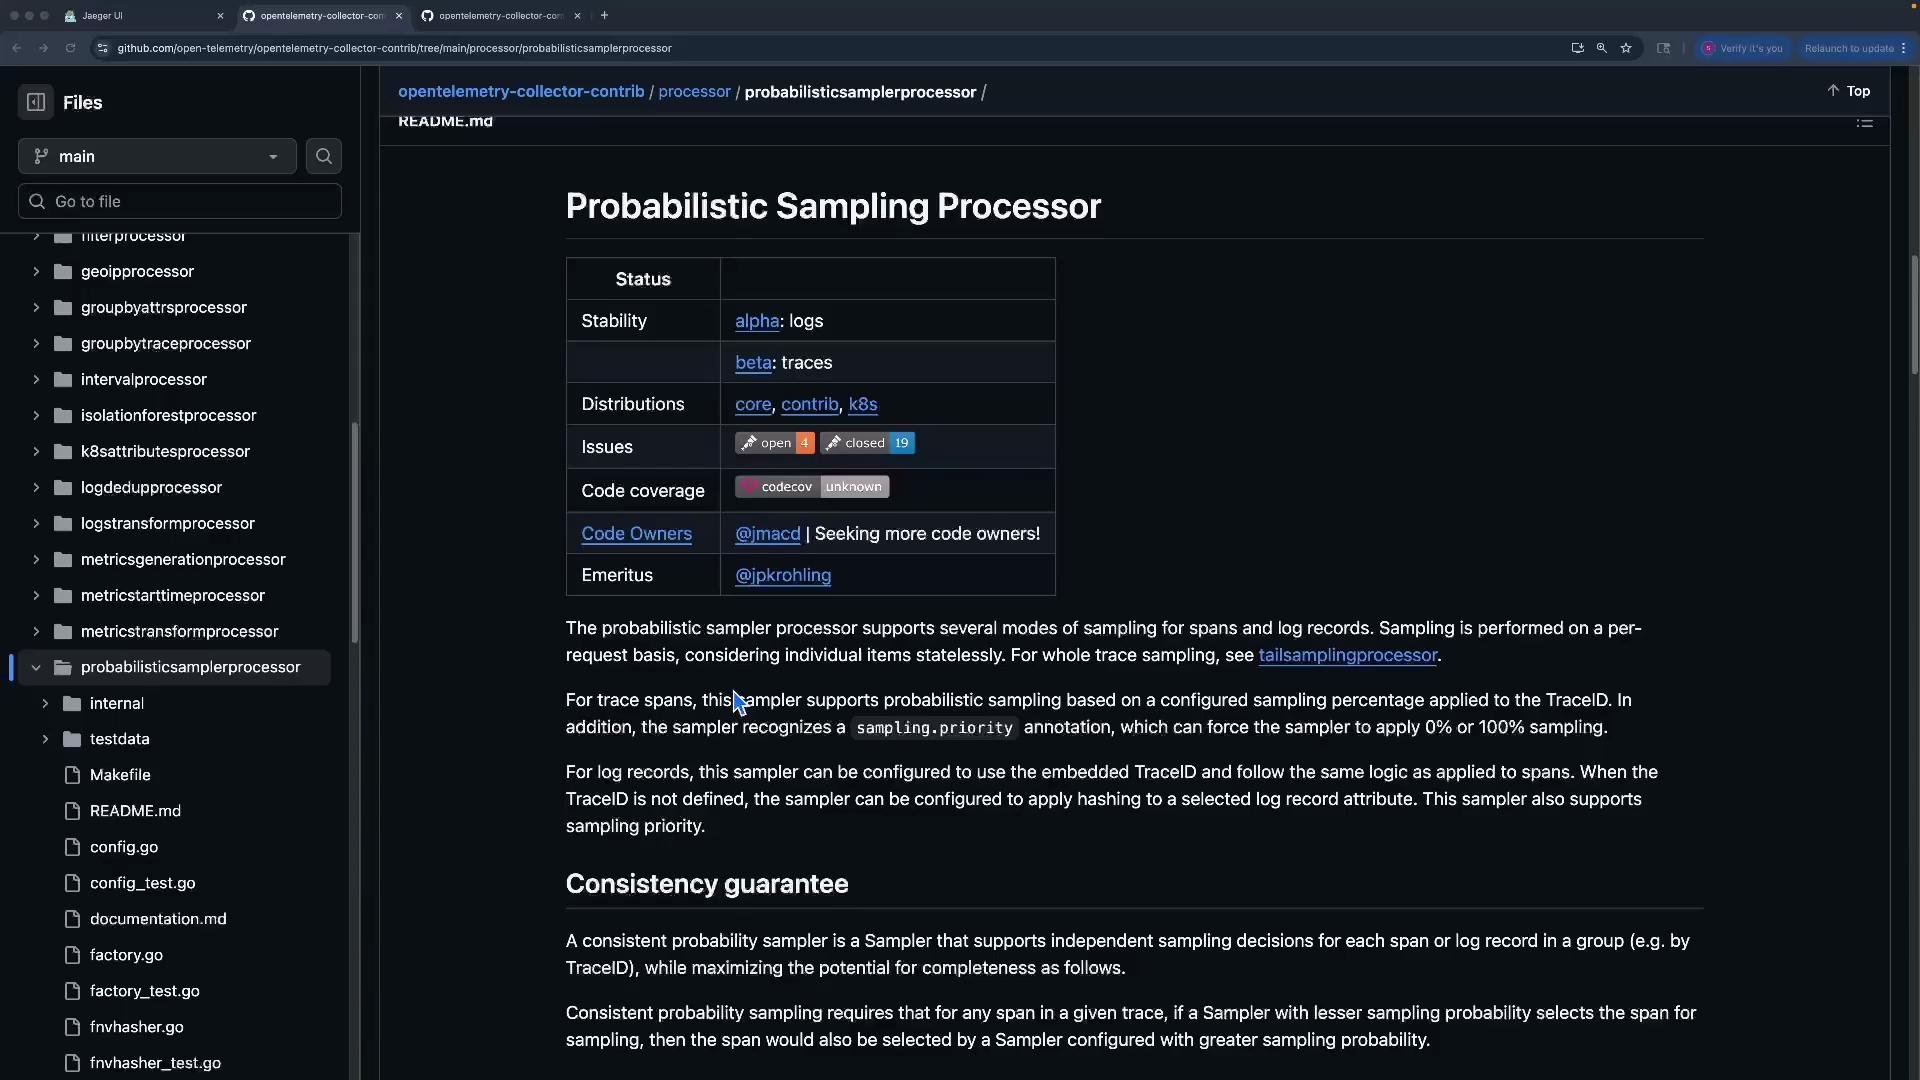
* Use the probabilistic sampler processor when you only need a fixed-percentage reduction of trace volume (for example, keep 10% of traces).
* This sampler is fast and low-overhead but cannot inspect full trace content to preferentially keep errors or high-latency traces.
Reference: Probabilistic Sampling Processor (GitHub)\
[https://github.com/open-telemetry/opentelemetry-collector-contrib/tree/main/processor/probabilisticsamplerprocessor](https://github.com/open-telemetry/opentelemetry-collector-contrib/tree/main/processor/probabilisticsamplerprocessor)
Probabilistic sampling (simple percentage-based sampling)
* Use the probabilistic sampler processor when you only need a fixed-percentage reduction of trace volume (for example, keep 10% of traces).
* This sampler is fast and low-overhead but cannot inspect full trace content to preferentially keep errors or high-latency traces.
Reference: Probabilistic Sampling Processor (GitHub)\
[https://github.com/open-telemetry/opentelemetry-collector-contrib/tree/main/processor/probabilisticsamplerprocessor](https://github.com/open-telemetry/opentelemetry-collector-contrib/tree/main/processor/probabilisticsamplerprocessor)
 Minimal probabilistic sampler example
```yaml theme={null}
processors:
probabilistic_sampler:
sampling_percentage: 15
```
Extended options (attribute source, trace ID selection)
```yaml theme={null}
processors:
probabilistic_sampler:
sampling_percentage: 15
attribute_source: record # possible values: record or traceID
from_attribute: logID # required when attribute_source is `record`
```
Wire probabilistic sampling into the traces pipeline (example: proportional mode with 10%):
```yaml theme={null}
receivers:
otlp:
protocols:
grpc:
endpoint: 0.0.0.0:4317
http:
endpoint: 0.0.0.0:4318
processors:
probabilistic_sampler:
mode: proportional
sampling_percentage: 10
exporters:
otlp/jaeger:
endpoint: http://jaeger:4317
tls:
insecure: true
debug:
verbosity: detailed
service:
pipelines:
traces:
receivers: [otlp]
processors: [probabilistic_sampler]
exporters: [debug, otlp/jaeger]
metrics:
receivers: [otlp]
exporters: [debug]
```
Restart the Collector after updating its config. When you generate 50 traces again, roughly 10% (about 5 traces) should be forwarded to Jaeger — subject to random variance.
Limitations of probabilistic sampling
* Samples purely by probability; cannot preferentially keep error traces or traces with special attributes.
* Not suitable when you need content-aware decisions that require seeing the entire trace.
Detailed documentation: Probabilistic Sampling Processor (GitHub)
Minimal probabilistic sampler example
```yaml theme={null}
processors:
probabilistic_sampler:
sampling_percentage: 15
```
Extended options (attribute source, trace ID selection)
```yaml theme={null}
processors:
probabilistic_sampler:
sampling_percentage: 15
attribute_source: record # possible values: record or traceID
from_attribute: logID # required when attribute_source is `record`
```
Wire probabilistic sampling into the traces pipeline (example: proportional mode with 10%):
```yaml theme={null}
receivers:
otlp:
protocols:
grpc:
endpoint: 0.0.0.0:4317
http:
endpoint: 0.0.0.0:4318
processors:
probabilistic_sampler:
mode: proportional
sampling_percentage: 10
exporters:
otlp/jaeger:
endpoint: http://jaeger:4317
tls:
insecure: true
debug:
verbosity: detailed
service:
pipelines:
traces:
receivers: [otlp]
processors: [probabilistic_sampler]
exporters: [debug, otlp/jaeger]
metrics:
receivers: [otlp]
exporters: [debug]
```
Restart the Collector after updating its config. When you generate 50 traces again, roughly 10% (about 5 traces) should be forwarded to Jaeger — subject to random variance.
Limitations of probabilistic sampling
* Samples purely by probability; cannot preferentially keep error traces or traces with special attributes.
* Not suitable when you need content-aware decisions that require seeing the entire trace.
Detailed documentation: Probabilistic Sampling Processor (GitHub)
 Tail sampling (sample after trace completion)
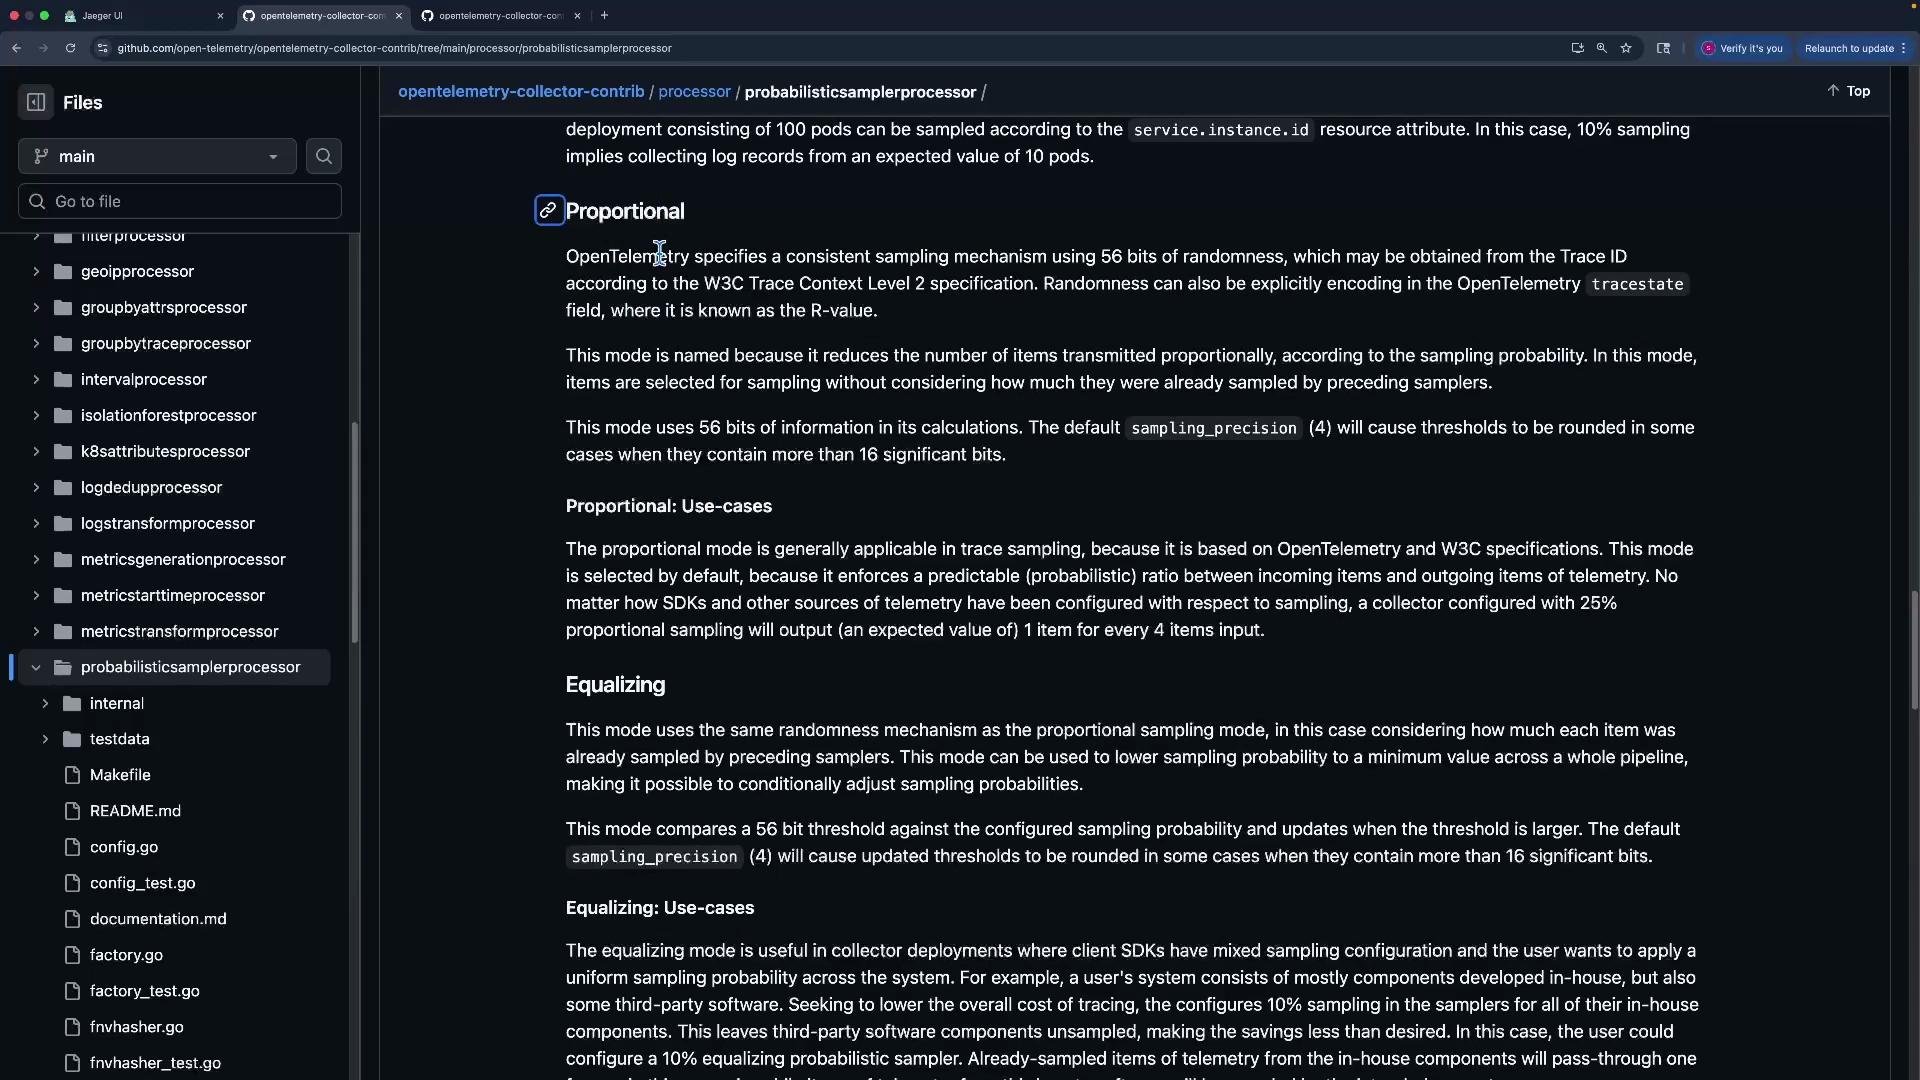
* Tail sampling waits until a trace is complete (or until a configured decision timeout) so the processor can evaluate the whole trace when deciding to keep or drop it.
* Useful when you must always keep errors, high-latency traces, or apply complex composite rules.
Reference: tailsamplingprocessor docs\
[https://github.com/open-telemetry/opentelemetry-collector-contrib/tree/main/processor/tailsamplingprocessor](https://github.com/open-telemetry/opentelemetry-collector-contrib/tree/main/processor/tailsamplingprocessor)
Key configuration options
* decision\_wait: How long to wait for late spans before making a decision (e.g., `10s`). Longer waits can improve accuracy but increase memory usage.
* num\_traces: Max number of traces to keep in memory (eviction safety limit).
* expected\_new\_traces\_per\_sec: Hint for internal optimizations.
* decision\_cache: Cache sizes for sampled and non-sampled decisions to avoid recalculating decisions.
Basic tail\_sampling example (keep all traces with ERROR status):
```yaml theme={null}
processors:
tail_sampling:
decision_wait: 10s
num_traces: 100000
expected_new_traces_per_sec: 100
decision_cache:
sampled_cache_size: 100000
non_sampled_cache_size: 100000
policies:
- name: all-errors
type: status_code
status_code:
status_codes: [ERROR]
```
Wire tail sampling into the traces pipeline:
```yaml theme={null}
service:
pipelines:
traces:
receivers: [otlp]
processors: [tail_sampling]
exporters: [debug, otlp/jaeger]
metrics:
receivers: [otlp]
exporters: [debug]
```
Callout: tuning and memory considerations
Tail sampling lets you make accurate, content-aware decisions (for example, always keep errors). Tune `decision_wait`, `num_traces`, and cache sizes based on your traffic profile to balance accuracy and memory usage.
Behavior examples and tests
1. No error status in traces
* Generate 50 traces without ERROR status. With the `all-errors` policy above, the tail sampler will drop them (they don’t match the ERROR policy).
```bash theme={null}
export GOBIN=${GOBIN:=$(go env GOPATH)/bin}
$GOBIN/telemetrygen traces --otlp-insecure --otlp-http --traces 50
```
Expected result: Jaeger receives no traces (tail sampler dropped them).
2. All traces set to ERROR
* Generate 50 traces with ERROR status. Tail sampling will keep them.
```bash theme={null}
$GOBIN/telemetrygen traces --otlp-insecure --otlp-http --traces 50 --status-code ERROR
```
Expected result: Jaeger receives all 50 traces (policy matched).
Composite policies: keep all errors, but probabilistically sample non-error traces
* Real-world pattern:
* Always keep traces with ERROR status.
* For OK or UNSET traces, keep around 10% to reduce volume.
Composite policy example (AND + status + probabilistic):
```yaml theme={null}
processors:
tail_sampling:
decision_wait: 10s
num_traces: 100000
expected_new_traces_per_sec: 100
decision_cache:
sampled_cache_size: 100000
non_sampled_cache_size: 100000
policies:
# keep all errors for debugging
- name: all-errors
type: status_code
status_code:
status_codes: [ERROR]
# for non-error traces (OK or UNSET) sample ~10%
- name: sample-success
type: and
and:
and_sub_policy:
- name: non-error
type: status_code
status_code:
status_codes: [OK, UNSET]
- name: ten-percent
type: probabilistic
probabilistic:
sampling_percentage: 10
```
How this works:
* `all-errors` preserves any trace with status ERROR.
* `sample-success` is an AND composite policy: it only samples when both a non-error status is detected and the probabilistic sub-policy passes.
Testing the composite policy
* Restart the Collector after applying the composite policy.
* Generate 50 ERROR traces -> all should be kept in Jaeger.
* Generate 100 OK/UNSET traces -> about 10% (\~10) should be kept and forwarded.
Callout: resource and correctness warning
Tail sampling holds traces in memory until a decision is made. Misconfigured `decision_wait`, `num_traces`, or cache sizes can cause high memory usage or eviction of traces. Monitor memory and tune policies for production workloads.
Comparison: Probabilistic vs Tail Sampling
| Feature | Probabilistic (processor) | Tail Sampling (processor) |
| ---------------------: | :-------------------------: | :----------------------------------------------: |
| Decision time | At ingestion (early) | After trace completion (late) |
| Can prioritize errors? | No | Yes |
| Memory overhead | Minimal | Higher (stores traces until decision) |
| Typical use case | Simple percentage reduction | Keep errors/high-latency and apply complex rules |
| Latency impact | None | Adds decision\_wait delay before export |
Links and references
* Probabilistic Sampling Processor (GitHub): [https://github.com/open-telemetry/opentelemetry-collector-contrib/tree/main/processor/probabilisticsamplerprocessor](https://github.com/open-telemetry/opentelemetry-collector-contrib/tree/main/processor/probabilisticsamplerprocessor)
* Tail Sampling Processor (GitHub): [https://github.com/open-telemetry/opentelemetry-collector-contrib/tree/main/processor/tailsamplingprocessor](https://github.com/open-telemetry/opentelemetry-collector-contrib/tree/main/processor/tailsamplingprocessor)
* telemetrygen (example generator): [https://github.com/open-telemetry/opentelemetry-collector-contrib/tree/main/cmd/telemetrygen](https://github.com/open-telemetry/opentelemetry-collector-contrib/tree/main/cmd/telemetrygen)
* OpenTelemetry Collector docs: [https://opentelemetry.io/docs/collector/](https://opentelemetry.io/docs/collector/)
Wrap-up
* Use probabilistic sampling for low-cost, uniform reductions.
* Use tail sampling when you need content-aware decisions (always keep errors, high-latency traces, or apply composite policies).
* Carefully tune `decision_wait`, `num_traces`, and decision caches for tail sampling to avoid excessive memory usage and evictions.
This concludes the lesson on implementing sampling strategies in the OpenTelemetry Collector.
Tail sampling (sample after trace completion)
* Tail sampling waits until a trace is complete (or until a configured decision timeout) so the processor can evaluate the whole trace when deciding to keep or drop it.
* Useful when you must always keep errors, high-latency traces, or apply complex composite rules.
Reference: tailsamplingprocessor docs\
[https://github.com/open-telemetry/opentelemetry-collector-contrib/tree/main/processor/tailsamplingprocessor](https://github.com/open-telemetry/opentelemetry-collector-contrib/tree/main/processor/tailsamplingprocessor)
Key configuration options
* decision\_wait: How long to wait for late spans before making a decision (e.g., `10s`). Longer waits can improve accuracy but increase memory usage.
* num\_traces: Max number of traces to keep in memory (eviction safety limit).
* expected\_new\_traces\_per\_sec: Hint for internal optimizations.
* decision\_cache: Cache sizes for sampled and non-sampled decisions to avoid recalculating decisions.
Basic tail\_sampling example (keep all traces with ERROR status):
```yaml theme={null}
processors:
tail_sampling:
decision_wait: 10s
num_traces: 100000
expected_new_traces_per_sec: 100
decision_cache:
sampled_cache_size: 100000
non_sampled_cache_size: 100000
policies:
- name: all-errors
type: status_code
status_code:
status_codes: [ERROR]
```
Wire tail sampling into the traces pipeline:
```yaml theme={null}
service:
pipelines:
traces:
receivers: [otlp]
processors: [tail_sampling]
exporters: [debug, otlp/jaeger]
metrics:
receivers: [otlp]
exporters: [debug]
```
Callout: tuning and memory considerations
Tail sampling lets you make accurate, content-aware decisions (for example, always keep errors). Tune `decision_wait`, `num_traces`, and cache sizes based on your traffic profile to balance accuracy and memory usage.
Behavior examples and tests
1. No error status in traces
* Generate 50 traces without ERROR status. With the `all-errors` policy above, the tail sampler will drop them (they don’t match the ERROR policy).
```bash theme={null}
export GOBIN=${GOBIN:=$(go env GOPATH)/bin}
$GOBIN/telemetrygen traces --otlp-insecure --otlp-http --traces 50
```
Expected result: Jaeger receives no traces (tail sampler dropped them).
2. All traces set to ERROR
* Generate 50 traces with ERROR status. Tail sampling will keep them.
```bash theme={null}
$GOBIN/telemetrygen traces --otlp-insecure --otlp-http --traces 50 --status-code ERROR
```
Expected result: Jaeger receives all 50 traces (policy matched).
Composite policies: keep all errors, but probabilistically sample non-error traces
* Real-world pattern:
* Always keep traces with ERROR status.
* For OK or UNSET traces, keep around 10% to reduce volume.
Composite policy example (AND + status + probabilistic):
```yaml theme={null}
processors:
tail_sampling:
decision_wait: 10s
num_traces: 100000
expected_new_traces_per_sec: 100
decision_cache:
sampled_cache_size: 100000
non_sampled_cache_size: 100000
policies:
# keep all errors for debugging
- name: all-errors
type: status_code
status_code:
status_codes: [ERROR]
# for non-error traces (OK or UNSET) sample ~10%
- name: sample-success
type: and
and:
and_sub_policy:
- name: non-error
type: status_code
status_code:
status_codes: [OK, UNSET]
- name: ten-percent
type: probabilistic
probabilistic:
sampling_percentage: 10
```
How this works:
* `all-errors` preserves any trace with status ERROR.
* `sample-success` is an AND composite policy: it only samples when both a non-error status is detected and the probabilistic sub-policy passes.
Testing the composite policy
* Restart the Collector after applying the composite policy.
* Generate 50 ERROR traces -> all should be kept in Jaeger.
* Generate 100 OK/UNSET traces -> about 10% (\~10) should be kept and forwarded.
Callout: resource and correctness warning
Tail sampling holds traces in memory until a decision is made. Misconfigured `decision_wait`, `num_traces`, or cache sizes can cause high memory usage or eviction of traces. Monitor memory and tune policies for production workloads.
Comparison: Probabilistic vs Tail Sampling
| Feature | Probabilistic (processor) | Tail Sampling (processor) |
| ---------------------: | :-------------------------: | :----------------------------------------------: |
| Decision time | At ingestion (early) | After trace completion (late) |
| Can prioritize errors? | No | Yes |
| Memory overhead | Minimal | Higher (stores traces until decision) |
| Typical use case | Simple percentage reduction | Keep errors/high-latency and apply complex rules |
| Latency impact | None | Adds decision\_wait delay before export |
Links and references
* Probabilistic Sampling Processor (GitHub): [https://github.com/open-telemetry/opentelemetry-collector-contrib/tree/main/processor/probabilisticsamplerprocessor](https://github.com/open-telemetry/opentelemetry-collector-contrib/tree/main/processor/probabilisticsamplerprocessor)
* Tail Sampling Processor (GitHub): [https://github.com/open-telemetry/opentelemetry-collector-contrib/tree/main/processor/tailsamplingprocessor](https://github.com/open-telemetry/opentelemetry-collector-contrib/tree/main/processor/tailsamplingprocessor)
* telemetrygen (example generator): [https://github.com/open-telemetry/opentelemetry-collector-contrib/tree/main/cmd/telemetrygen](https://github.com/open-telemetry/opentelemetry-collector-contrib/tree/main/cmd/telemetrygen)
* OpenTelemetry Collector docs: [https://opentelemetry.io/docs/collector/](https://opentelemetry.io/docs/collector/)
Wrap-up
* Use probabilistic sampling for low-cost, uniform reductions.
* Use tail sampling when you need content-aware decisions (always keep errors, high-latency traces, or apply composite policies).
* Carefully tune `decision_wait`, `num_traces`, and decision caches for tail sampling to avoid excessive memory usage and evictions.
This concludes the lesson on implementing sampling strategies in the OpenTelemetry Collector.