> ## Documentation Index
> Fetch the complete documentation index at: https://notes.kodekloud.com/llms.txt
> Use this file to discover all available pages before exploring further.
# OTTL Basics
> Overview of OTTL, the OpenTelemetry Transformation Language, showing how to write rules to enrich, normalize, redact, and filter traces, metrics, and logs in the Collector pipeline
Now let's take a closer look at the OpenTelemetry Transformation Language (OTTL) — what it is, why it matters, and how it integrates with the OpenTelemetry Collector pipeline.
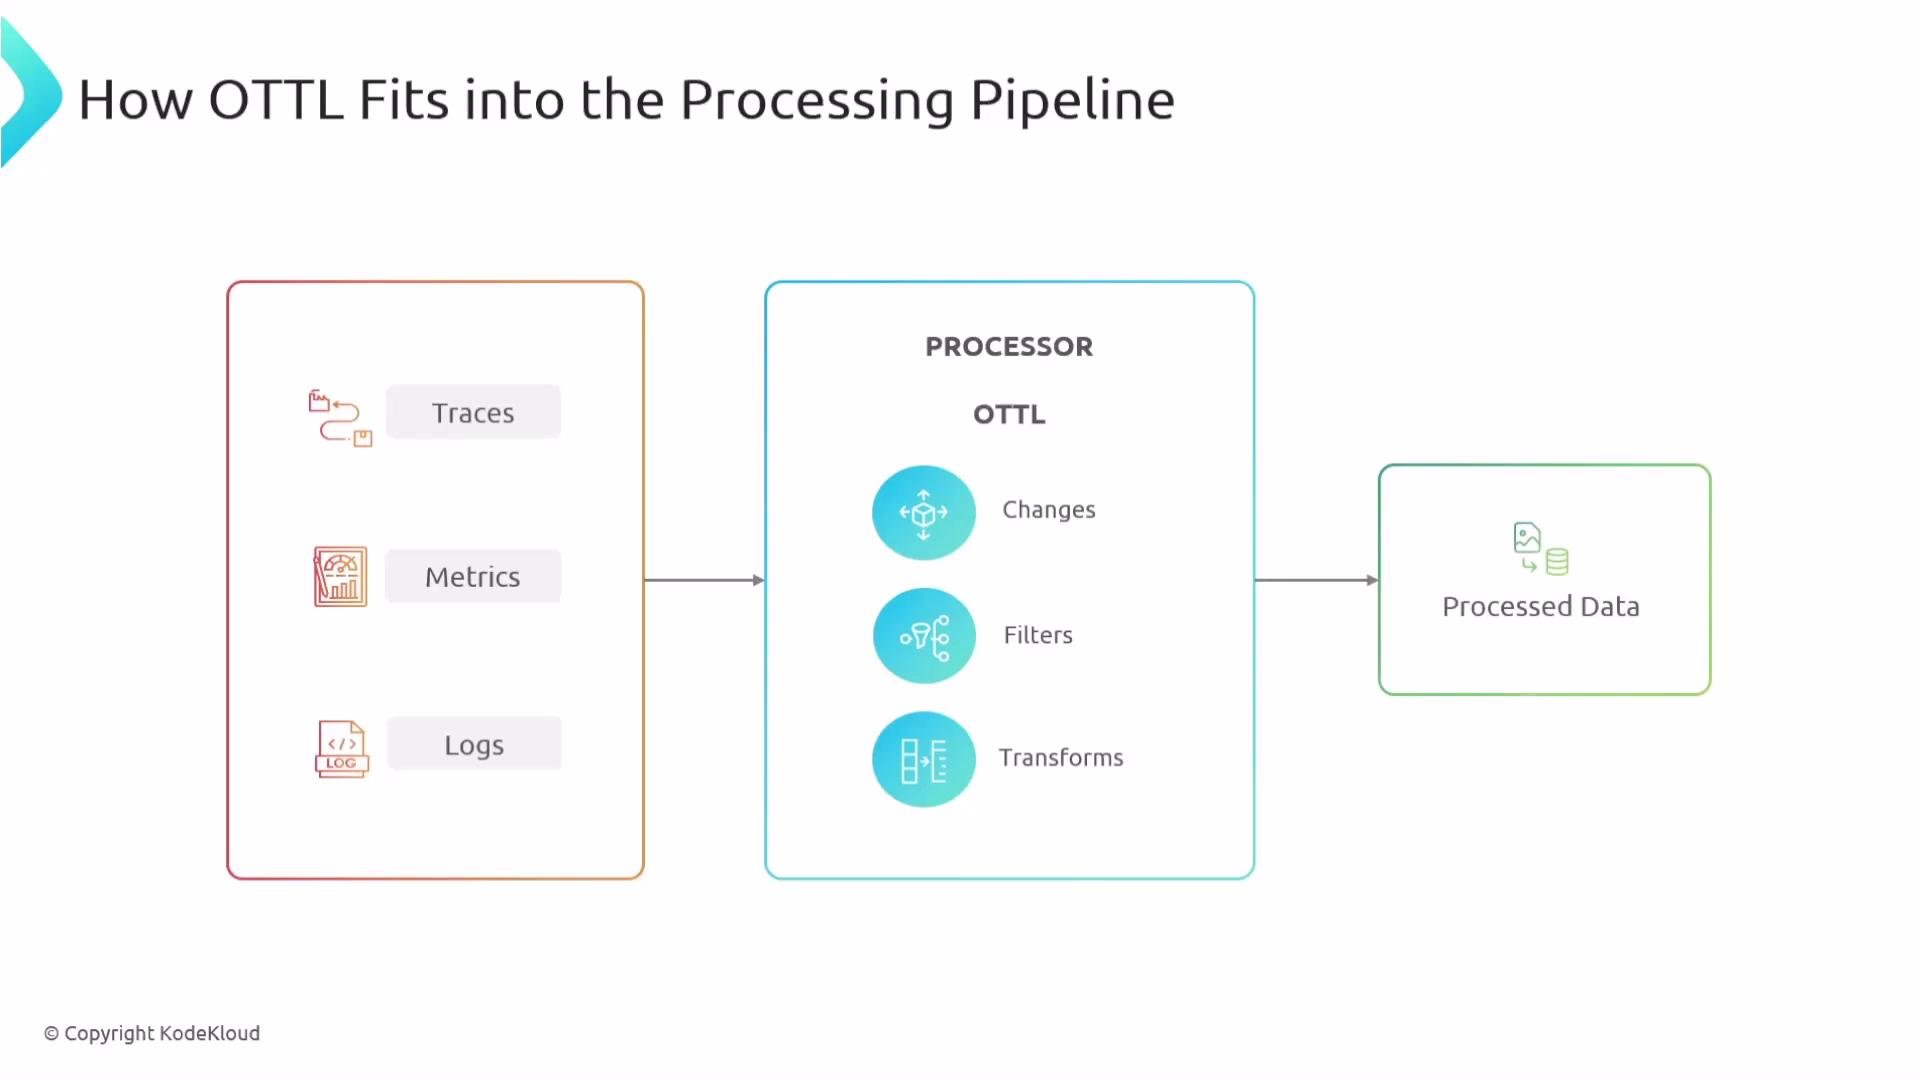
OTTL lets you write concise, expressive rules that the Collector evaluates as telemetry flows through processors. These rules can enrich, normalize, redact, or filter traces, metrics, and logs so exporters receive safer and more consistent data.
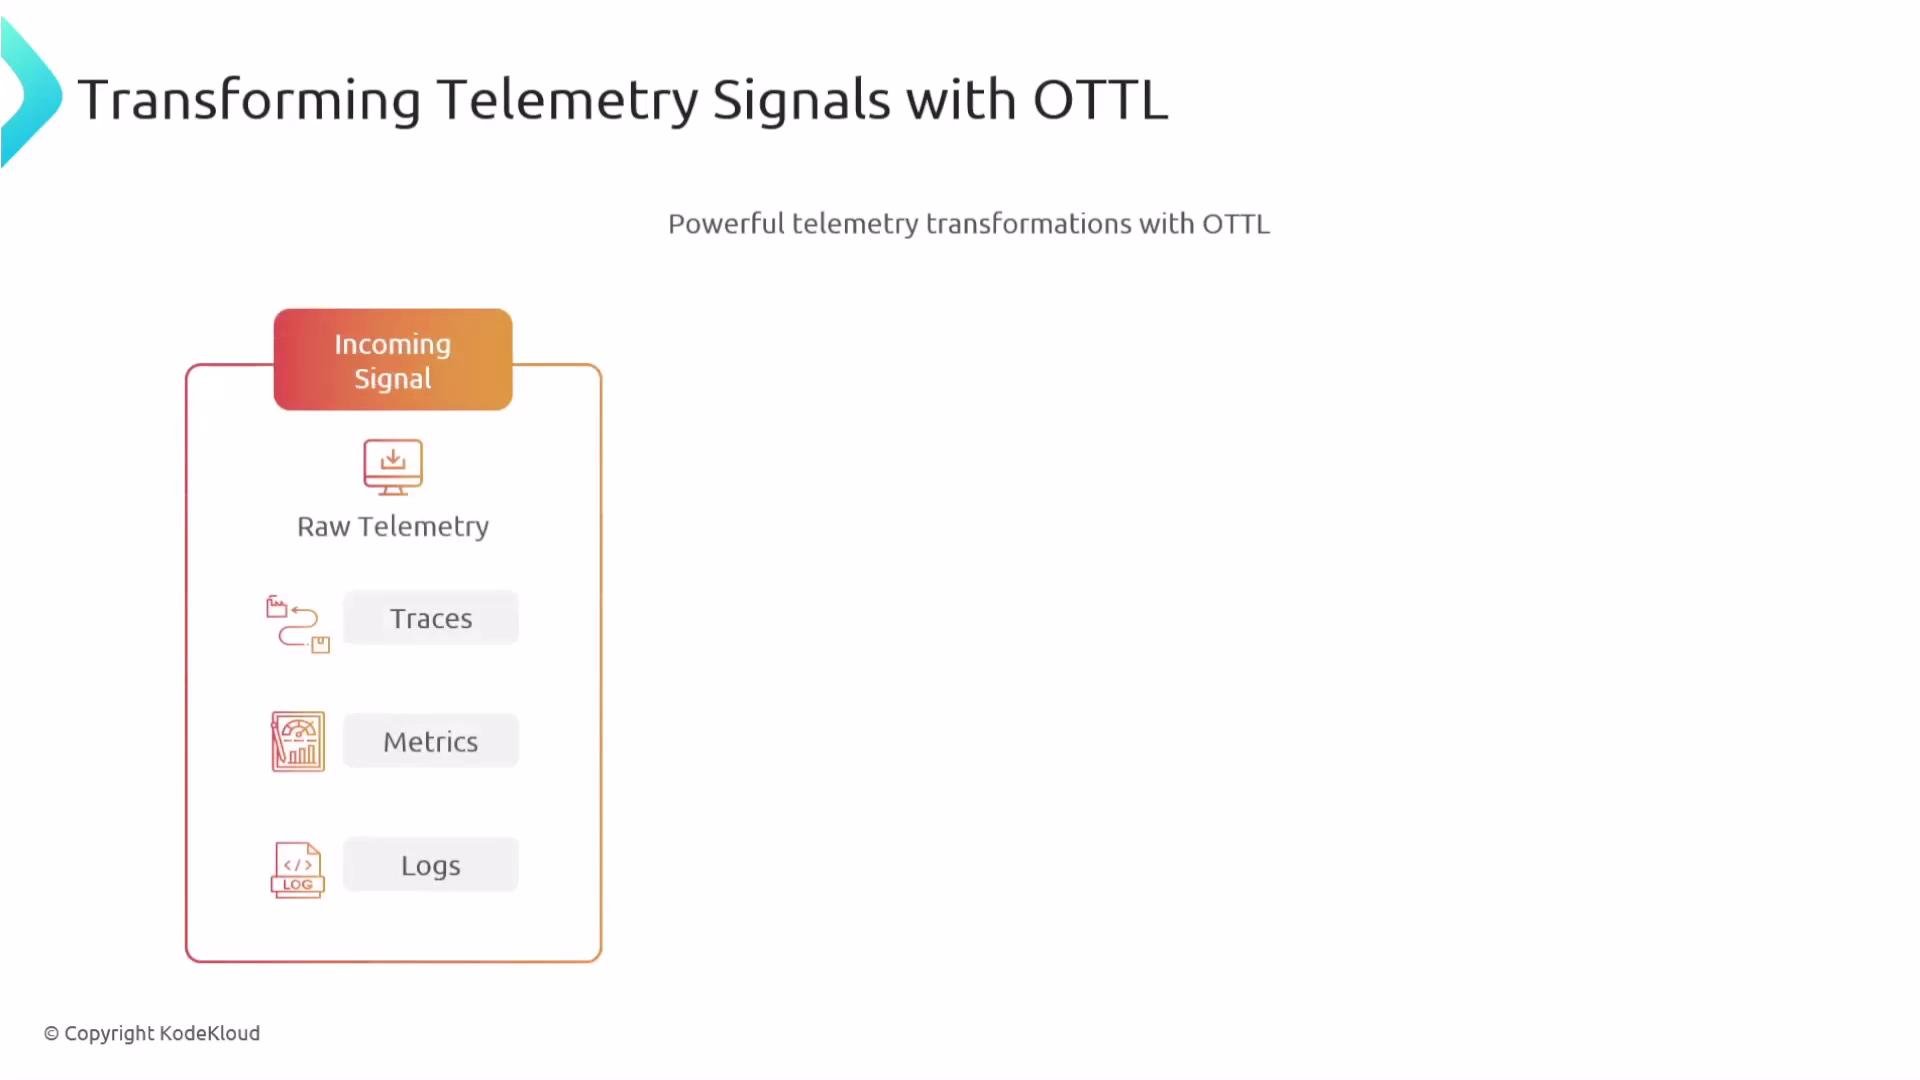 What OTTL does in a nutshell
* Define rules (statements) in processor configurations.
* The Collector evaluates those statements per telemetry item.
* Statements can set attributes, replace values, extract patterns, or drop items.
* Works across all signal types: traces, metrics, and logs.
OTTL integrates into the Collector pipeline so transformations happen inline — before data is routed to sinks/exporters or other processing steps.
What OTTL does in a nutshell
* Define rules (statements) in processor configurations.
* The Collector evaluates those statements per telemetry item.
* Statements can set attributes, replace values, extract patterns, or drop items.
* Works across all signal types: traces, metrics, and logs.
OTTL integrates into the Collector pipeline so transformations happen inline — before data is routed to sinks/exporters or other processing steps.
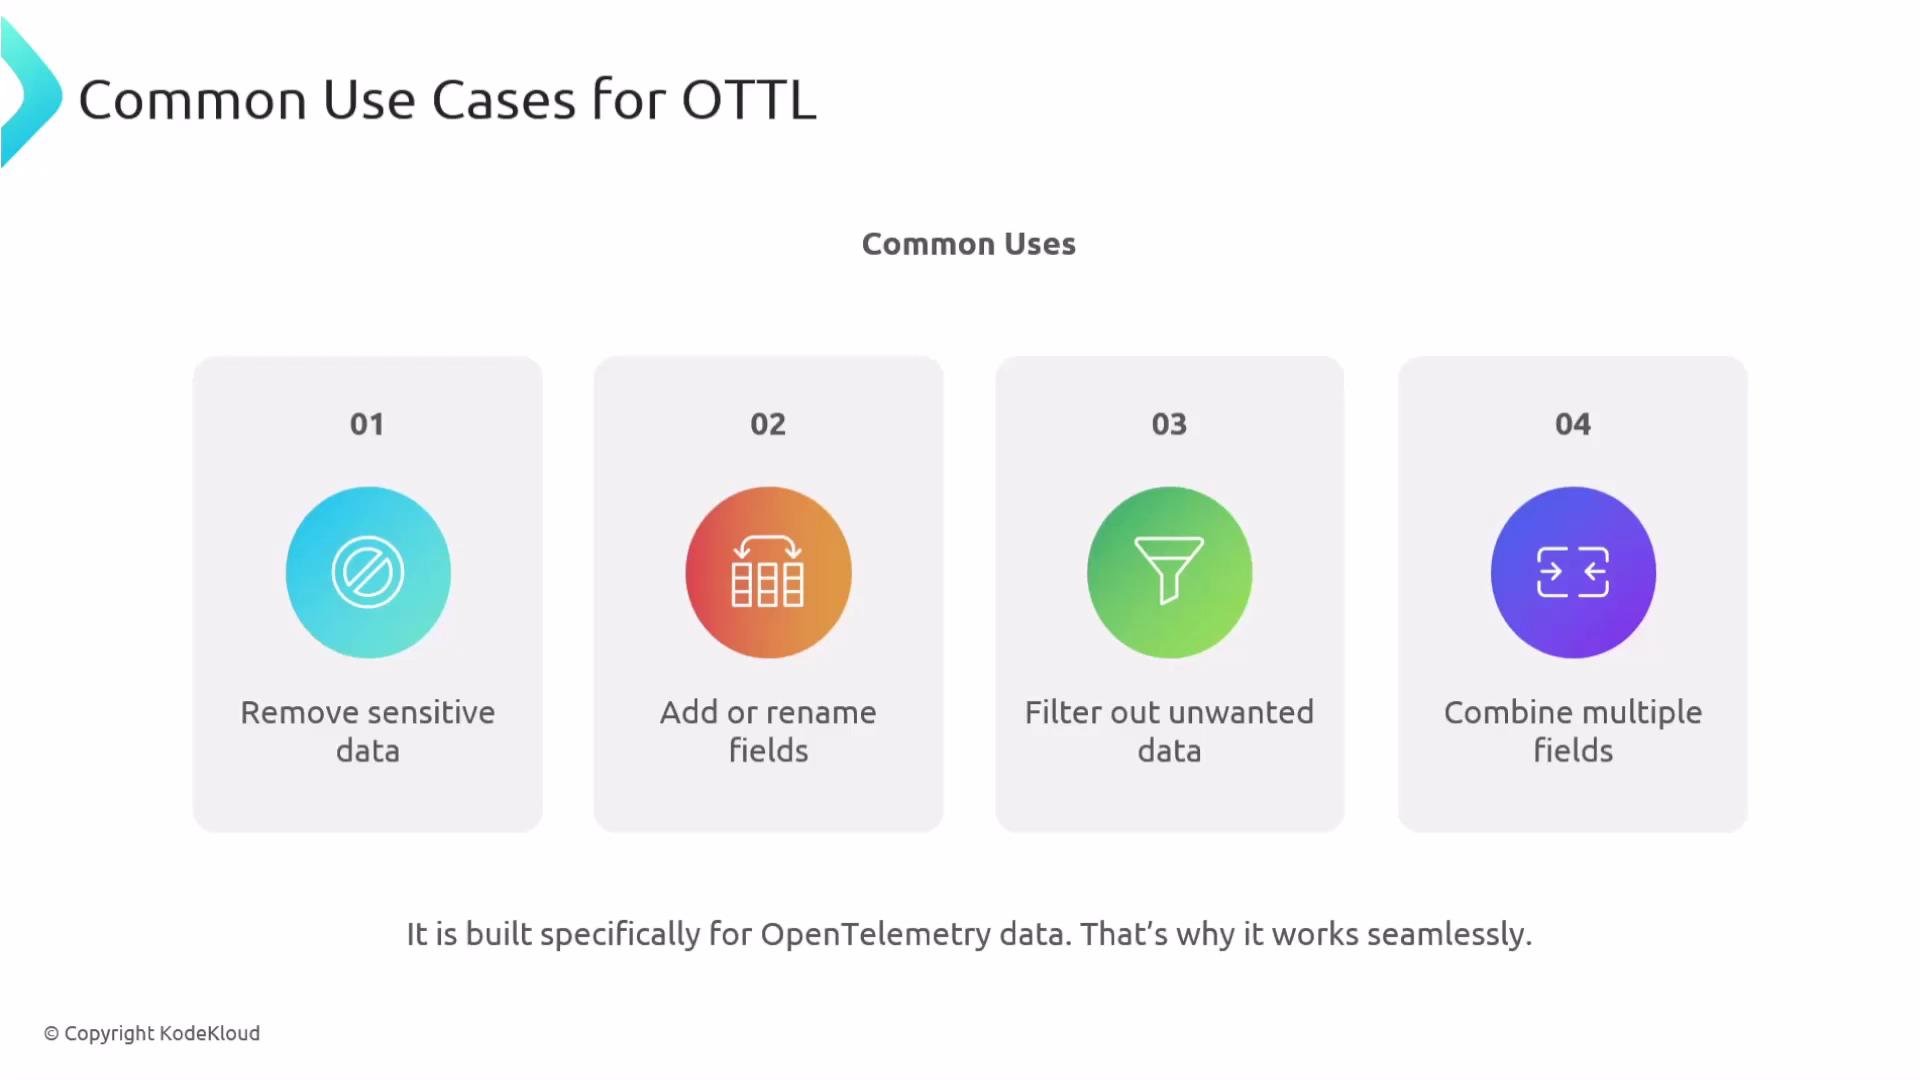
 Common use cases
* Remove or mask sensitive data (PII) before export.
* Add, rename, or normalize attributes for schema consistency.
* Filter out noisy or irrelevant telemetry to reduce volume.
* Extract or combine fields to simplify downstream analysis.
Common use cases
* Remove or mask sensitive data (PII) before export.
* Add, rename, or normalize attributes for schema consistency.
* Filter out noisy or irrelevant telemetry to reduce volume.
* Extract or combine fields to simplify downstream analysis.
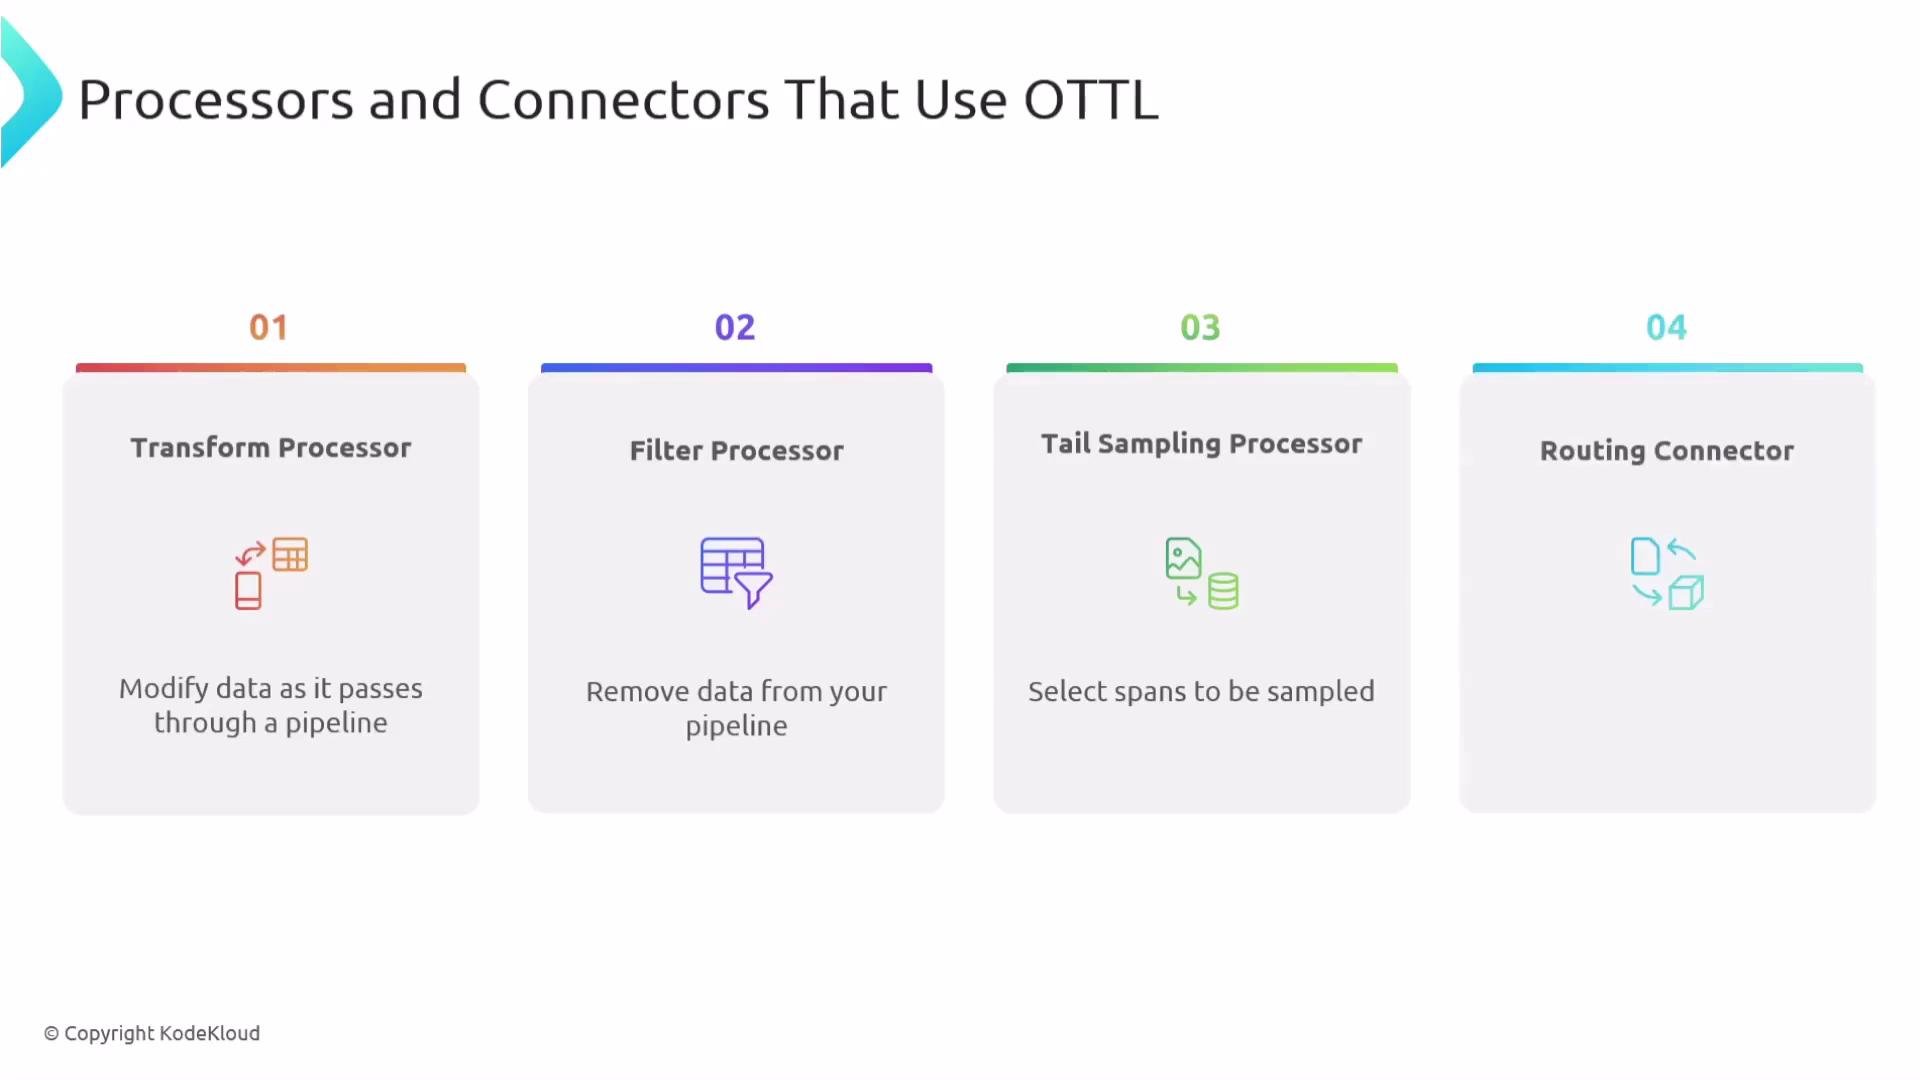
 Collectors, processors, and connectors that use OTTL
Several Collector components embed OTTL support so you can apply rules in different stages:
| Component | Purpose | Example usage |
| ----------------------- | ---------------------------- | ---------------------------------------------- |
| Transform processor | Modify telemetry as it flows | `trace_statements` to set or update attributes |
| Filter processor | Drop unwanted telemetry | Drop spans from non-prod environments |
| Tail-sampling processor | Select spans for sampling | Keep only error-related traces |
| Routing connector | Route data between pipelines | Send logs to a pipeline based on attributes |
Collectors, processors, and connectors that use OTTL
Several Collector components embed OTTL support so you can apply rules in different stages:
| Component | Purpose | Example usage |
| ----------------------- | ---------------------------- | ---------------------------------------------- |
| Transform processor | Modify telemetry as it flows | `trace_statements` to set or update attributes |
| Filter processor | Drop unwanted telemetry | Drop spans from non-prod environments |
| Tail-sampling processor | Select spans for sampling | Keep only error-related traces |
| Routing connector | Route data between pipelines | Send logs to a pipeline based on attributes |
 Practical examples
Below are common, real-world examples that show how OTTL statements are written and what outcomes they produce. Each example includes an input span, the OTTL statements (as used in a transform/filter processor), and the resulting span or traces after processing.
Example 1 — Set severity from HTTP status
* Input span (before):
```json theme={null}
{
"traceId": "abc123",
"spanId": "xyz789",
"name": "GET /api/checkout",
"attributes": {
"http.status_code": 503,
"service.name": "checkout-svc"
}
}
```
* Transform processor (OTTL) statements:
```yaml theme={null}
trace_statements:
- context: span
statements:
# Set severity based on status code
- set(attributes["severity"], "critical")
where attributes["http.status_code"] >= 500
- set(attributes["severity"], "error")
where attributes["http.status_code"] >= 400 and attributes["http.status_code"] < 500
- set(attributes["severity"], "info")
where attributes["http.status_code"] < 400
```
* Resulting span (after):
```json theme={null}
{
"traceId": "abc123",
"spanId": "xyz789",
"name": "GET /api/checkout",
"attributes": {
"http.status_code": 503,
"service.name": "checkout-svc",
"severity": "critical"
}
}
```
This shows how to enrich spans by adding a `severity` attribute derived from `http.status_code`.
Example 2 — Extract values and parse user agent
* Input span:
```json theme={null}
{
"traceId": "abc123",
"spanId": "xyz789",
"name": "GET /api/user",
"attributes": {
"http.target": "/api/users/12345/profile",
"user.agent": "Mozilla/5.0 (iPhone; CPU iPhone OS 16_0)"
}
}
```
* Transform processor (extract user ID and device type):
```yaml theme={null}
trace_statements:
- context: span
statements:
# Extract user ID from URL path
- set(attributes["user.id"],
ExtractPatterns(attributes["http.target"], "/users/(\\d+)/")[0])
# Parse device type from user agent
- set(attributes["device.type"], "mobile")
where IsMatch(attributes["user.agent"], "iPhone|Android")
```
* Resulting span (after):
```json theme={null}
{
"traceId": "abc123",
"spanId": "xyz789",
"name": "GET /api/user",
"attributes": {
"http.target": "/api/users/12345/profile",
"user.agent": "Mozilla/5.0 (iPhone; CPU iPhone OS 16_0)",
"user.id": "12345",
"device.type": "mobile"
}
}
```
Example 3 — Hashing (redacting) sensitive attributes
* Input span:
```json theme={null}
{
"traceId": "abc123",
"spanId": "xyz789",
"name": "POST /api/payment",
"attributes": {
"user.email": "john.doe@example.com",
"credit.card": "4532-1234-5678-9010",
"ip.address": "192.168.1.100"
}
}
```
* Transform processor (hash sensitive fields using a hashing function):
```yaml theme={null}
trace_statements:
- context: span
statements:
# Hash sensitive data (example using SHA256 wrapper)
- set(attributes["user.email"],
ReplacePattern(attributes["user.email"], ".*", SHA256(attributes["user.email"])))
- set(attributes["credit.card"],
ReplacePattern(attributes["credit.card"], ".*", SHA256(attributes["credit.card"])))
- set(attributes["ip.address"],
ReplacePattern(attributes["ip.address"], ".*", SHA256(attributes["ip.address"])))
```
Note: function names and availability vary across Collector distributions. The intent is to replace raw PII with consistent hashes for safe correlation.
* Resulting span (after — sample hashed values shown):
```json theme={null}
{
"traceId": "abc123",
"spanId": "xyz789",
"name": "POST /api/payment",
"attributes": {
"user.email": "sha256:6f1a...abcd",
"credit.card": "sha256:3b2c...7890",
"ip.address": "sha256:9a8b...def0"
}
}
```
Example 4 — Drop fast or non-production spans with the filter processor
* Input traces payload:
```json theme={null}
{
"traceId": "abc123",
"spans": [
{
"spanId": "xyz789",
"name": "db.query",
"duration_ms": 45,
"attributes": {
"service.name": "api"
}
},
{
"spanId": "def456",
"name": "cache.get",
"duration_ms": 3500,
"attributes": {
"service.name": "api"
}
}
]
}
```
* Filter processor rule (drop fast or non-prod spans):
```yaml theme={null}
traces:
span:
# Drop spans that are fast (< 1000ms) OR not from production
- attributes["duration_ms"] < 1000 or resource.attributes["env"] != "prod"
```
The filter processor drops spans that match the condition — in this case, fast spans or spans not in `env == "prod"`.
* Resulting traces (after):
```json theme={null}
{
"traceId": "abc123",
"spans": [
{
"spanId": "def456",
"name": "cache.get",
"duration_ms": 3500,
"attributes": {
"service.name": "api"
}
}
]
}
```
How OTTL statements execute
* Statements live inside transform/filter configurations (e.g., under `trace_statements`).
* `set()` specifies the target attribute or field to change.
* `where` is a guard — run the statement only when the condition is true.
* If the `where` condition is false, the statement is skipped for that telemetry item.
Error handling modes
OTTL execution supports different error modes that influence Collector behavior when a statement fails:
| Mode | Behavior | When to use |
| --------- | ------------------------------------- | -------------------------------------------------------------------- |
| Ignore | Log the error and continue processing | Safe default for production; keeps pipeline running |
| Silent | Continue without logging the error | Rarely recommended — hides issues |
| Propagate | Surface the error and stop processing | Use when you must prevent any bad transformations from being applied |
Practical examples
Below are common, real-world examples that show how OTTL statements are written and what outcomes they produce. Each example includes an input span, the OTTL statements (as used in a transform/filter processor), and the resulting span or traces after processing.
Example 1 — Set severity from HTTP status
* Input span (before):
```json theme={null}
{
"traceId": "abc123",
"spanId": "xyz789",
"name": "GET /api/checkout",
"attributes": {
"http.status_code": 503,
"service.name": "checkout-svc"
}
}
```
* Transform processor (OTTL) statements:
```yaml theme={null}
trace_statements:
- context: span
statements:
# Set severity based on status code
- set(attributes["severity"], "critical")
where attributes["http.status_code"] >= 500
- set(attributes["severity"], "error")
where attributes["http.status_code"] >= 400 and attributes["http.status_code"] < 500
- set(attributes["severity"], "info")
where attributes["http.status_code"] < 400
```
* Resulting span (after):
```json theme={null}
{
"traceId": "abc123",
"spanId": "xyz789",
"name": "GET /api/checkout",
"attributes": {
"http.status_code": 503,
"service.name": "checkout-svc",
"severity": "critical"
}
}
```
This shows how to enrich spans by adding a `severity` attribute derived from `http.status_code`.
Example 2 — Extract values and parse user agent
* Input span:
```json theme={null}
{
"traceId": "abc123",
"spanId": "xyz789",
"name": "GET /api/user",
"attributes": {
"http.target": "/api/users/12345/profile",
"user.agent": "Mozilla/5.0 (iPhone; CPU iPhone OS 16_0)"
}
}
```
* Transform processor (extract user ID and device type):
```yaml theme={null}
trace_statements:
- context: span
statements:
# Extract user ID from URL path
- set(attributes["user.id"],
ExtractPatterns(attributes["http.target"], "/users/(\\d+)/")[0])
# Parse device type from user agent
- set(attributes["device.type"], "mobile")
where IsMatch(attributes["user.agent"], "iPhone|Android")
```
* Resulting span (after):
```json theme={null}
{
"traceId": "abc123",
"spanId": "xyz789",
"name": "GET /api/user",
"attributes": {
"http.target": "/api/users/12345/profile",
"user.agent": "Mozilla/5.0 (iPhone; CPU iPhone OS 16_0)",
"user.id": "12345",
"device.type": "mobile"
}
}
```
Example 3 — Hashing (redacting) sensitive attributes
* Input span:
```json theme={null}
{
"traceId": "abc123",
"spanId": "xyz789",
"name": "POST /api/payment",
"attributes": {
"user.email": "john.doe@example.com",
"credit.card": "4532-1234-5678-9010",
"ip.address": "192.168.1.100"
}
}
```
* Transform processor (hash sensitive fields using a hashing function):
```yaml theme={null}
trace_statements:
- context: span
statements:
# Hash sensitive data (example using SHA256 wrapper)
- set(attributes["user.email"],
ReplacePattern(attributes["user.email"], ".*", SHA256(attributes["user.email"])))
- set(attributes["credit.card"],
ReplacePattern(attributes["credit.card"], ".*", SHA256(attributes["credit.card"])))
- set(attributes["ip.address"],
ReplacePattern(attributes["ip.address"], ".*", SHA256(attributes["ip.address"])))
```
Note: function names and availability vary across Collector distributions. The intent is to replace raw PII with consistent hashes for safe correlation.
* Resulting span (after — sample hashed values shown):
```json theme={null}
{
"traceId": "abc123",
"spanId": "xyz789",
"name": "POST /api/payment",
"attributes": {
"user.email": "sha256:6f1a...abcd",
"credit.card": "sha256:3b2c...7890",
"ip.address": "sha256:9a8b...def0"
}
}
```
Example 4 — Drop fast or non-production spans with the filter processor
* Input traces payload:
```json theme={null}
{
"traceId": "abc123",
"spans": [
{
"spanId": "xyz789",
"name": "db.query",
"duration_ms": 45,
"attributes": {
"service.name": "api"
}
},
{
"spanId": "def456",
"name": "cache.get",
"duration_ms": 3500,
"attributes": {
"service.name": "api"
}
}
]
}
```
* Filter processor rule (drop fast or non-prod spans):
```yaml theme={null}
traces:
span:
# Drop spans that are fast (< 1000ms) OR not from production
- attributes["duration_ms"] < 1000 or resource.attributes["env"] != "prod"
```
The filter processor drops spans that match the condition — in this case, fast spans or spans not in `env == "prod"`.
* Resulting traces (after):
```json theme={null}
{
"traceId": "abc123",
"spans": [
{
"spanId": "def456",
"name": "cache.get",
"duration_ms": 3500,
"attributes": {
"service.name": "api"
}
}
]
}
```
How OTTL statements execute
* Statements live inside transform/filter configurations (e.g., under `trace_statements`).
* `set()` specifies the target attribute or field to change.
* `where` is a guard — run the statement only when the condition is true.
* If the `where` condition is false, the statement is skipped for that telemetry item.
Error handling modes
OTTL execution supports different error modes that influence Collector behavior when a statement fails:
| Mode | Behavior | When to use |
| --------- | ------------------------------------- | -------------------------------------------------------------------- |
| Ignore | Log the error and continue processing | Safe default for production; keeps pipeline running |
| Silent | Continue without logging the error | Rarely recommended — hides issues |
| Propagate | Surface the error and stop processing | Use when you must prevent any bad transformations from being applied |
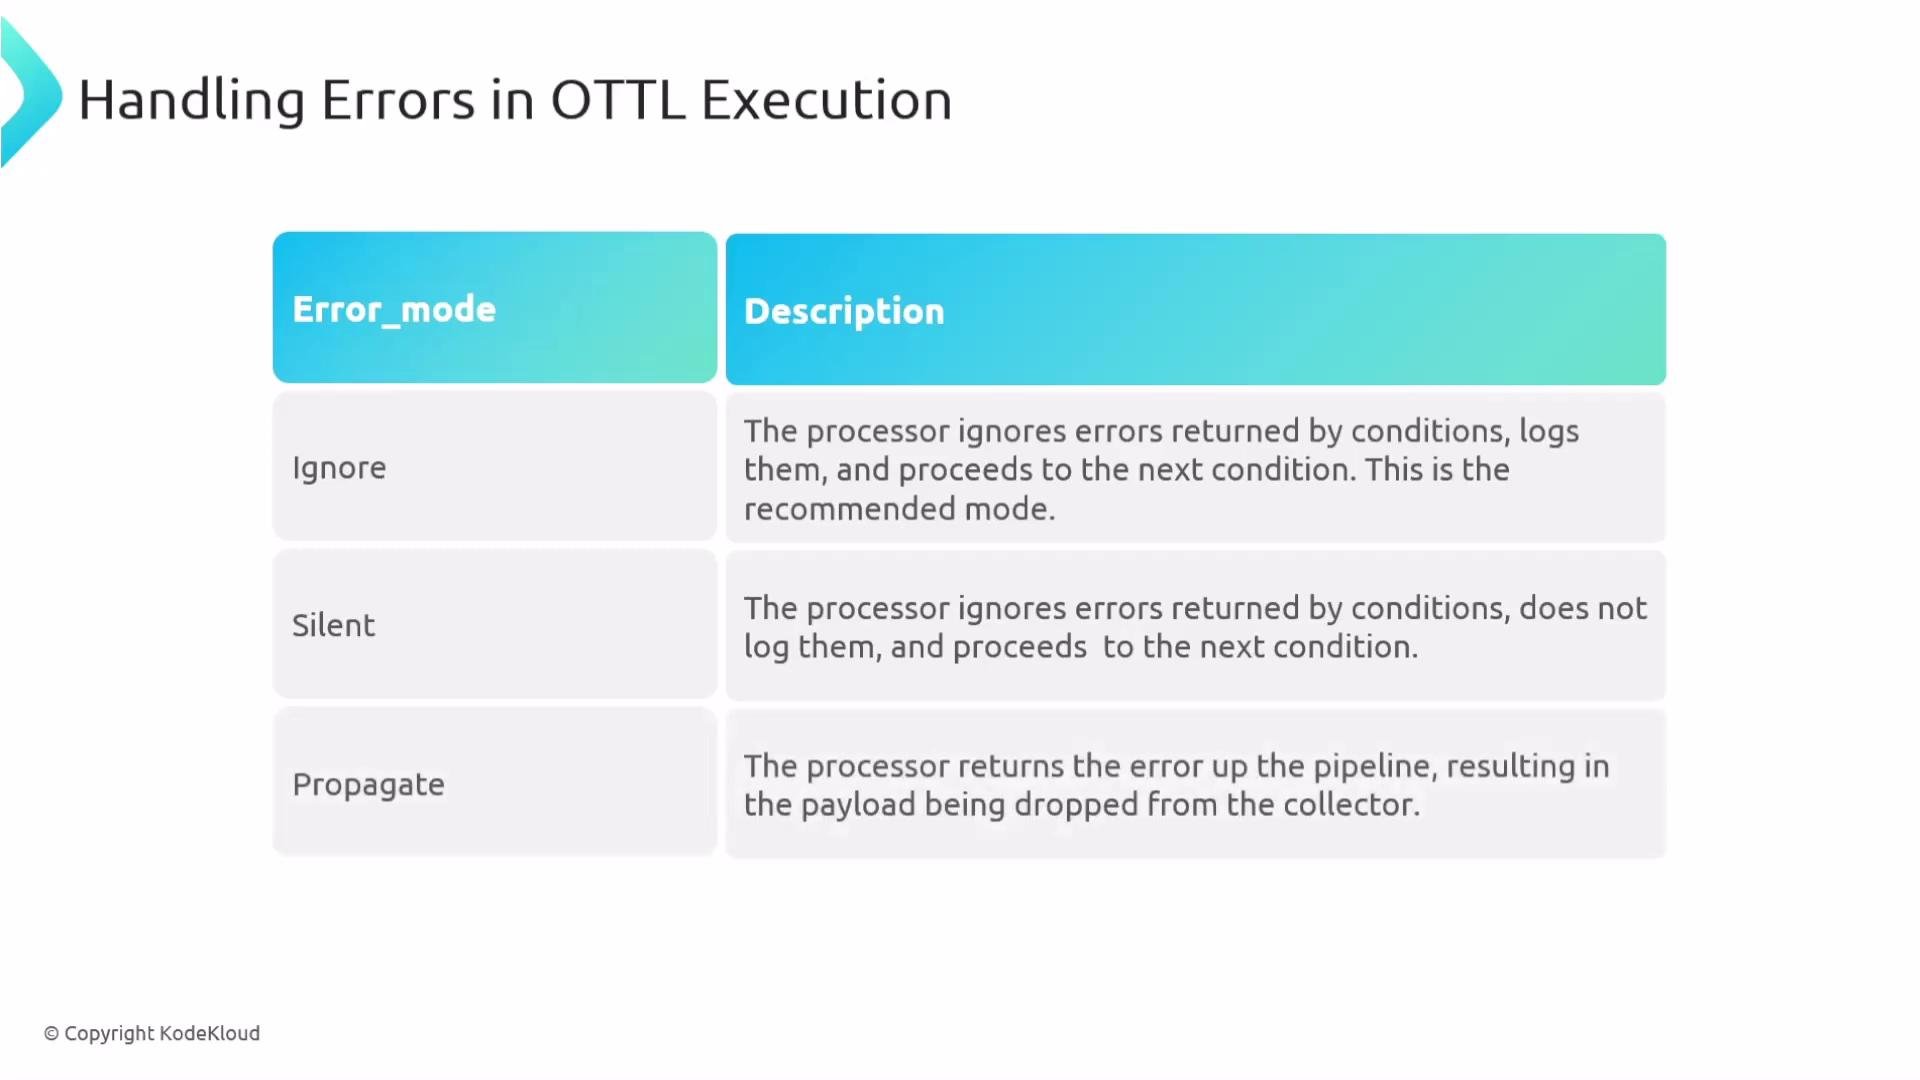 Recommendation: use `error_mode: ignore` during exploration to avoid dropping data due to rule mistakes. Switch to `error_mode: propagate` when you require strict enforcement that prevents any erroneous transformation from being applied.
Simple processor snippets
* Transform processor for logs (ignore minor errors):
```yaml theme={null}
processors:
transform:
error_mode: ignore
log_statements:
- set(log.severity_text, "FAIL") where log.body == "request failed"
```
* Filter processor example to drop spans from `service1`:
```yaml theme={null}
processors:
filter:
traces:
span:
- resource.attributes["service.name"] == "service1"
```
Best practices and validation
Start small: add one simple OTTL statement and test it. Use `error_mode: ignore` while iterating, then switch to stricter error handling once your rules are stable. Always validate your Collector configuration before deploying.
Validate the Collector configuration after edits:
```bash theme={null}
otelcol-contrib validate --config config.yaml
```
This command helps catch syntax errors and common configuration problems before you roll out changes.
Further reading and references
* OpenTelemetry Collector: [https://opentelemetry.io/docs/collector/](https://opentelemetry.io/docs/collector/)
* OTTL overview and syntax (Collector docs): [https://opentelemetry.io/docs/collector/configuration/processor/transform/](https://opentelemetry.io/docs/collector/configuration/processor/transform/)
That covers the core OTTL concepts: purpose, placement in the Collector pipeline, common use cases, hands-on examples for enrichment/redaction/filtering, error handling options, and validation tips.
Recommendation: use `error_mode: ignore` during exploration to avoid dropping data due to rule mistakes. Switch to `error_mode: propagate` when you require strict enforcement that prevents any erroneous transformation from being applied.
Simple processor snippets
* Transform processor for logs (ignore minor errors):
```yaml theme={null}
processors:
transform:
error_mode: ignore
log_statements:
- set(log.severity_text, "FAIL") where log.body == "request failed"
```
* Filter processor example to drop spans from `service1`:
```yaml theme={null}
processors:
filter:
traces:
span:
- resource.attributes["service.name"] == "service1"
```
Best practices and validation
Start small: add one simple OTTL statement and test it. Use `error_mode: ignore` while iterating, then switch to stricter error handling once your rules are stable. Always validate your Collector configuration before deploying.
Validate the Collector configuration after edits:
```bash theme={null}
otelcol-contrib validate --config config.yaml
```
This command helps catch syntax errors and common configuration problems before you roll out changes.
Further reading and references
* OpenTelemetry Collector: [https://opentelemetry.io/docs/collector/](https://opentelemetry.io/docs/collector/)
* OTTL overview and syntax (Collector docs): [https://opentelemetry.io/docs/collector/configuration/processor/transform/](https://opentelemetry.io/docs/collector/configuration/processor/transform/)
That covers the core OTTL concepts: purpose, placement in the Collector pipeline, common use cases, hands-on examples for enrichment/redaction/filtering, error handling options, and validation tips.