> ## Documentation Index
> Fetch the complete documentation index at: https://notes.kodekloud.com/llms.txt
> Use this file to discover all available pages before exploring further.
# Sampling Strategies
> Explains tracing sampling strategies across SDK and Collector, comparing SDK, head, and tail sampling and when to use transforms and sampling processors.
In this lesson we’ll compare sampling points and strategies across the OpenTelemetry stack: starting inside the application (SDK) and moving outward to the Collector. Each diagram is preserved in order and annotated so the flow and decision points are clear.
The OpenTelemetry SDK runs inside your application and is the first—most immediate—place to make sampling decisions for spans and traces.
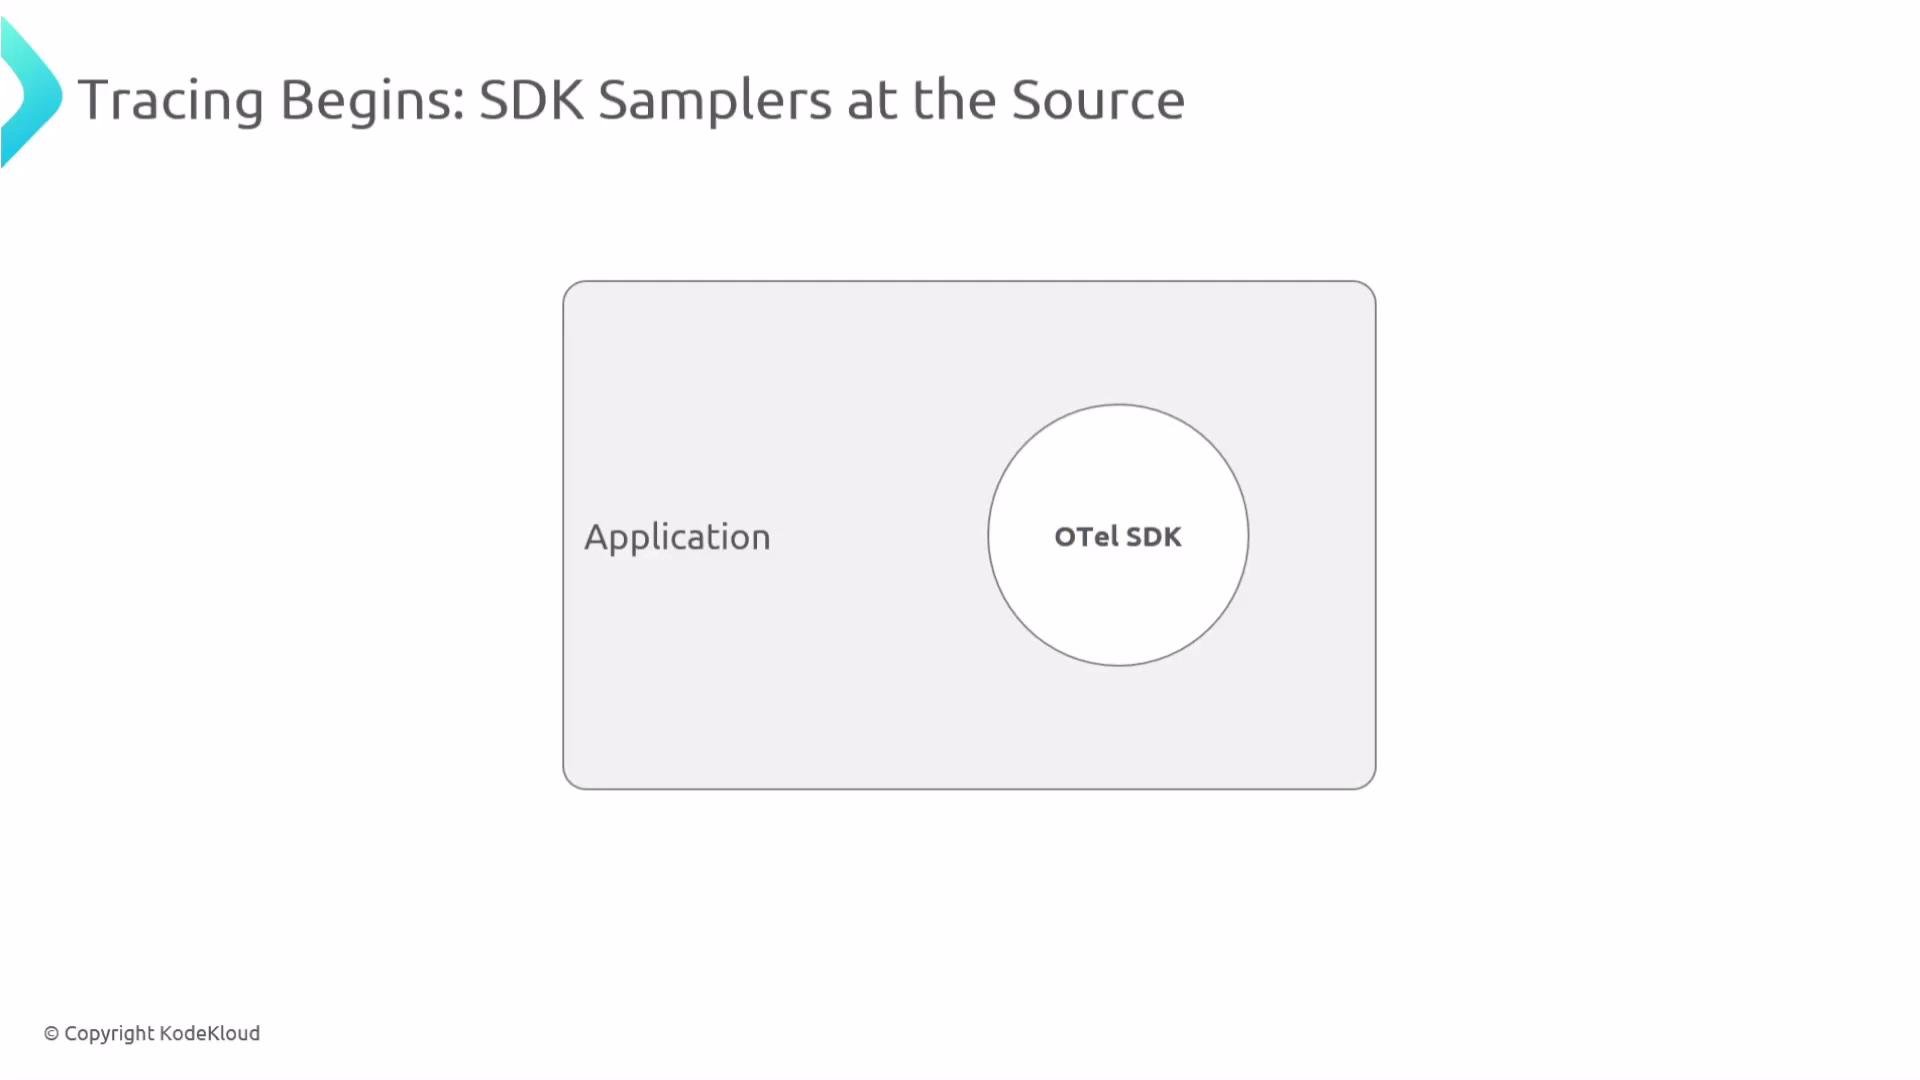 Why sample at the SDK?
* Lowers network and backend load by discarding unneeded spans early.
* Enables consistent per-process sampling configured without code changes.
* Limited by the local view: SDK sampling decisions occur at span creation time and cannot use eventual trace outcomes.
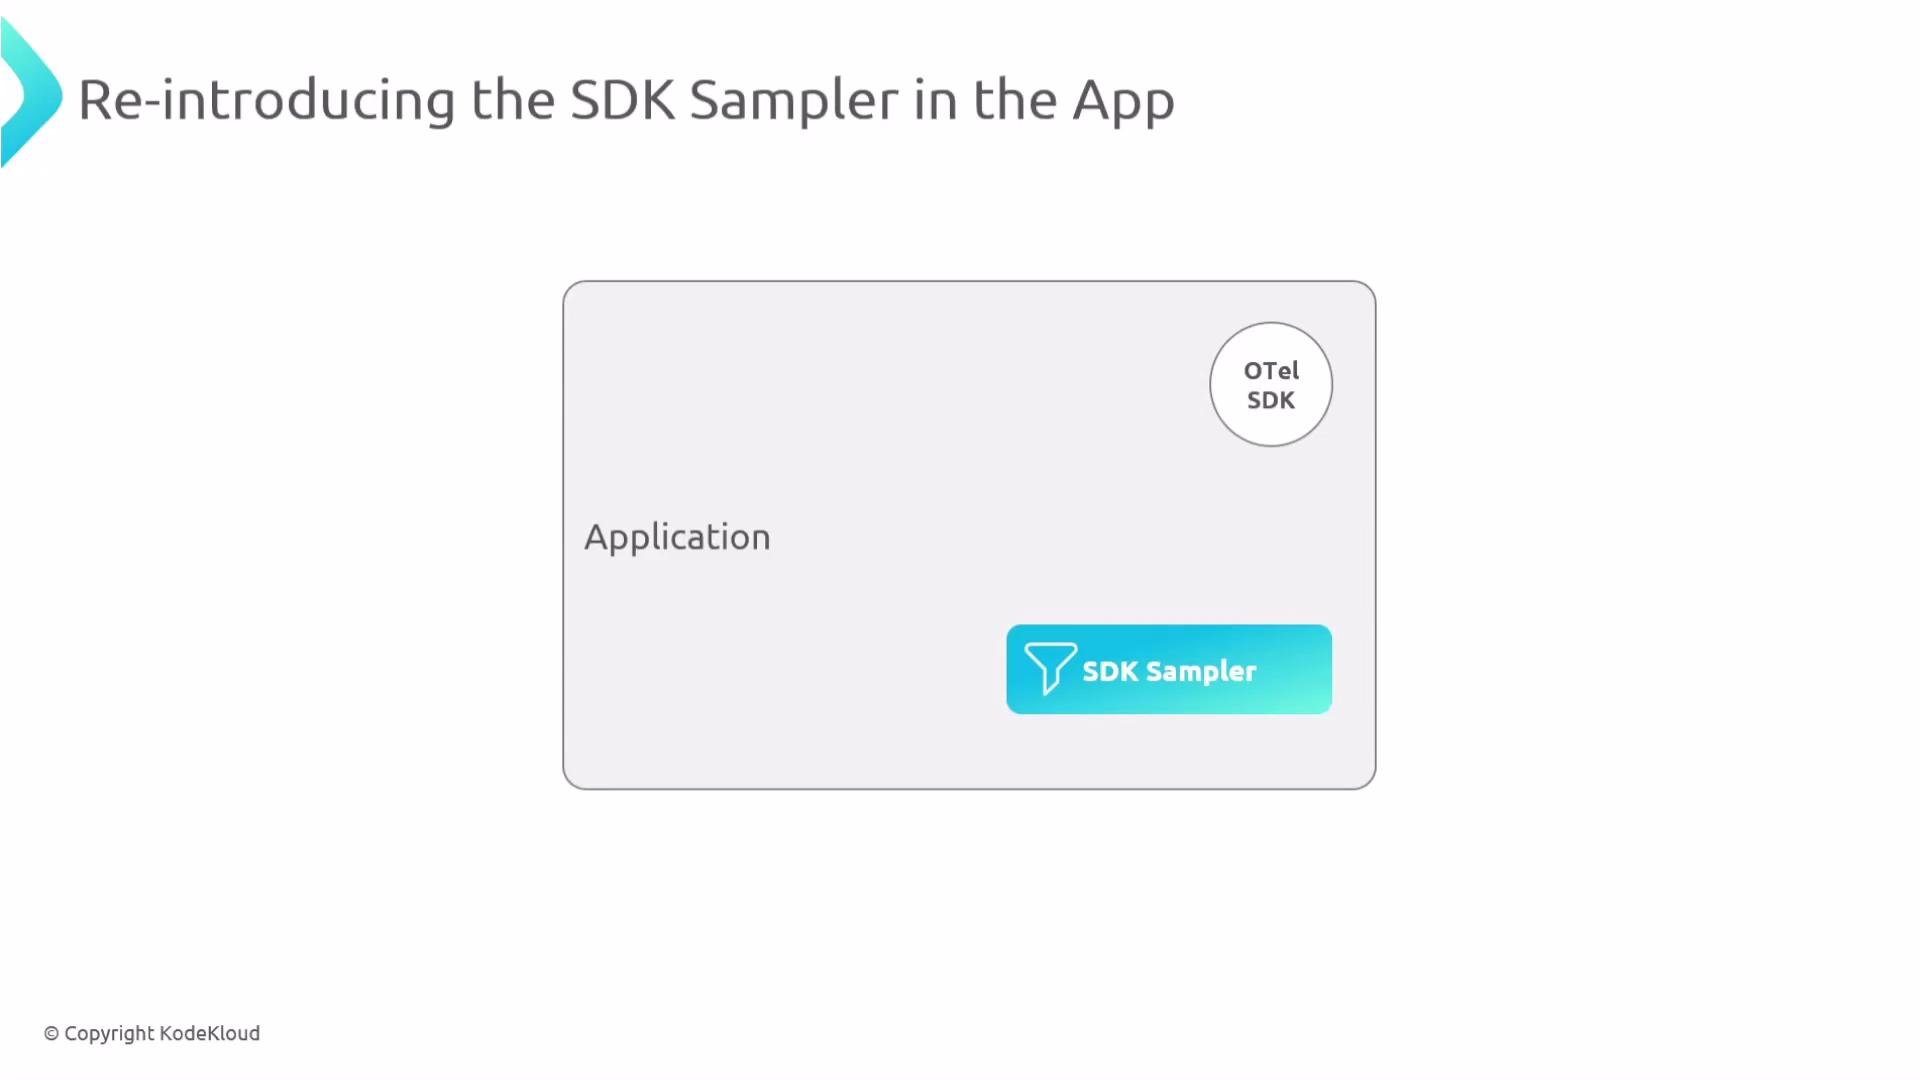
Below is a more focused view showing the SDK and the SDK Sampler component inside an application process.
Why sample at the SDK?
* Lowers network and backend load by discarding unneeded spans early.
* Enables consistent per-process sampling configured without code changes.
* Limited by the local view: SDK sampling decisions occur at span creation time and cannot use eventual trace outcomes.
Below is a more focused view showing the SDK and the SDK Sampler component inside an application process.
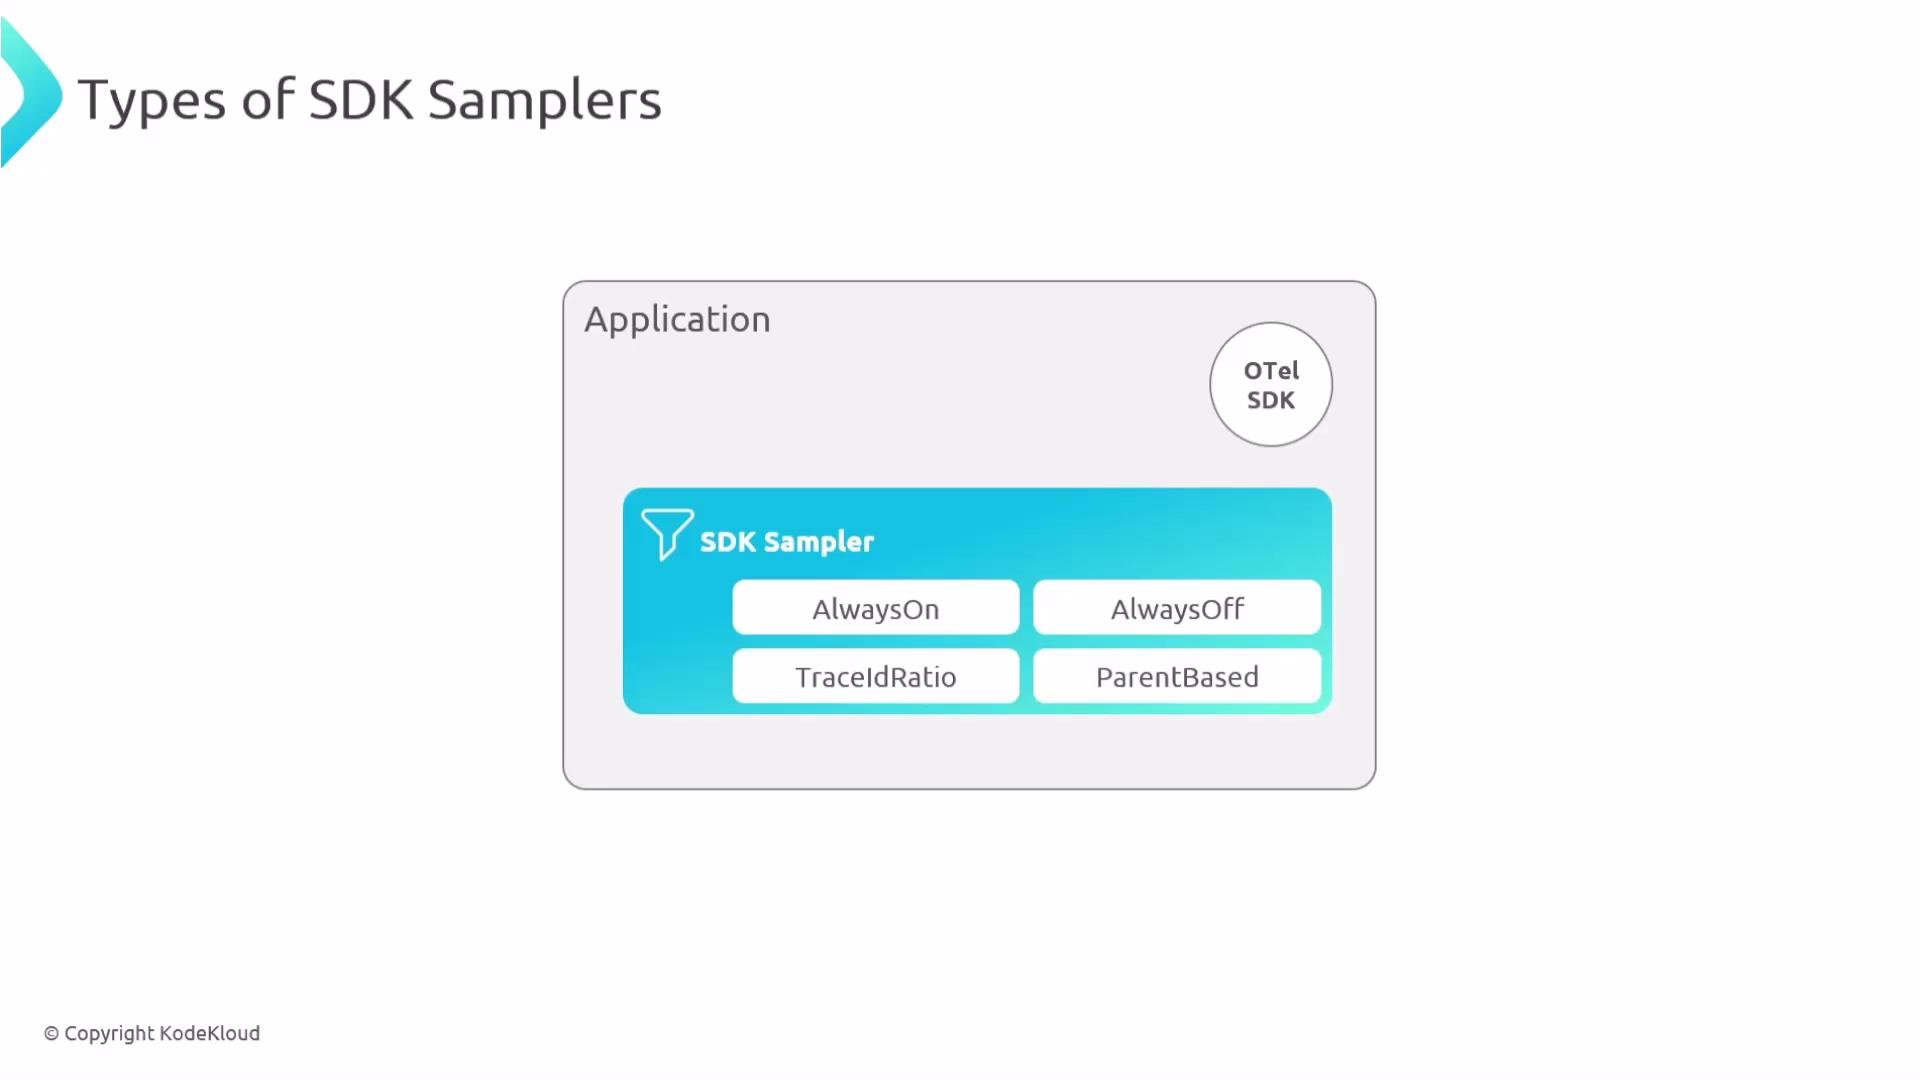
 Common SDK sampler types and when to use them:
| Sampler | What it does | Use case |
| ---------------------------- | ----------------------------------------------------------------- | --------------------------------------------- |
| AlwaysOn | Records all traces | Debugging, development, short-lived tests |
| AlwaysOff | Records no traces | Disable telemetry in specific runs |
| TraceIdRatio (probabilistic) | Records a fixed percentage of traces using a hash of the trace ID | Control volume with predictable sampling rate |
| ParentBased | Follows the parent span's decision | Preserve trace consistency across services |
Common SDK sampler types and when to use them:
| Sampler | What it does | Use case |
| ---------------------------- | ----------------------------------------------------------------- | --------------------------------------------- |
| AlwaysOn | Records all traces | Debugging, development, short-lived tests |
| AlwaysOff | Records no traces | Disable telemetry in specific runs |
| TraceIdRatio (probabilistic) | Records a fixed percentage of traces using a hash of the trace ID | Control volume with predictable sampling rate |
| ParentBased | Follows the parent span's decision | Preserve trace consistency across services |
 Example: configure SDK sampling via environment variables (spec follows the OpenTelemetry specification and is cross-language):
```bash theme={null}
# Example (cross-language env vars per spec)
export OTEL_TRACES_SAMPLER=parentbased_traceidratio
export OTEL_TRACES_SAMPLER_ARG=0.10 # sample 10% of traces at the SDK (when parent decision allows)
```
Sampling at the SDK reduces network and backend load, but it discards data early. If you need sampling decisions based on full-trace results (errors, latency spikes, or aggregated attributes), consider sampling later in the pipeline (the Collector).
If the SDK does not sample, or if you need enrichment/normalization before deciding, the OpenTelemetry Collector is a powerful place to apply sampling. The Collector can receive telemetry from many SDKs, augment traces with transforms, and make more informed sampling decisions.
Example: configure SDK sampling via environment variables (spec follows the OpenTelemetry specification and is cross-language):
```bash theme={null}
# Example (cross-language env vars per spec)
export OTEL_TRACES_SAMPLER=parentbased_traceidratio
export OTEL_TRACES_SAMPLER_ARG=0.10 # sample 10% of traces at the SDK (when parent decision allows)
```
Sampling at the SDK reduces network and backend load, but it discards data early. If you need sampling decisions based on full-trace results (errors, latency spikes, or aggregated attributes), consider sampling later in the pipeline (the Collector).
If the SDK does not sample, or if you need enrichment/normalization before deciding, the OpenTelemetry Collector is a powerful place to apply sampling. The Collector can receive telemetry from many SDKs, augment traces with transforms, and make more informed sampling decisions.
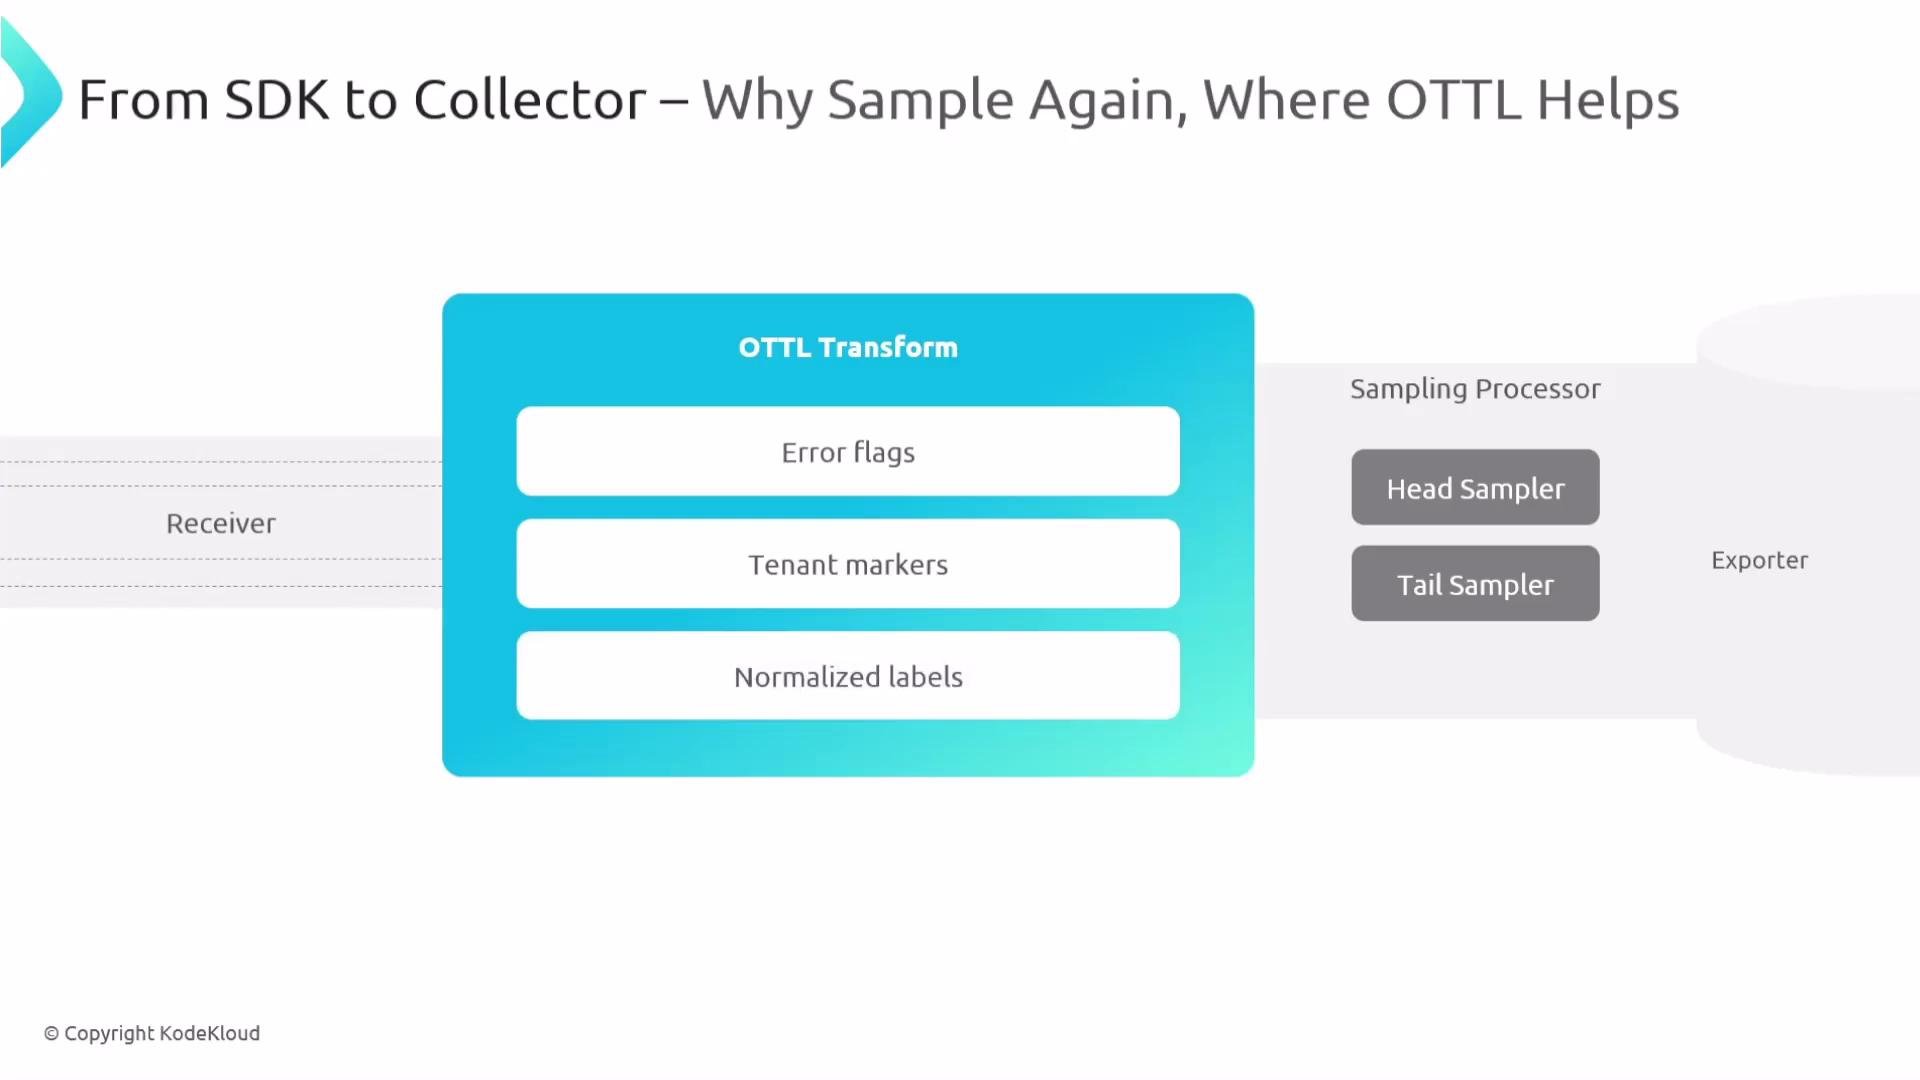 Transforms in the Collector (using OTTL) let you enrich telemetry so sampling policies can use attributes like error flags, tenant IDs, or latency labels. Example: set an error flag and copy a tenant attribute into spans before sampling.
```yaml theme={null}
processors:
transform/normalize:
error_mode: ignore
traces:
statements:
- set(span.attributes["error.flag"], span.status.code == "STATUS_CODE_ERROR")
- set(span.attributes["tenant"], resource.attributes["tenant"]) where
resource.attributes["tenant"] != nil
```
After transforms, telemetry flows through processors that can include sampling processors before export.
Two fundamental Collector sampling approaches:
Transforms in the Collector (using OTTL) let you enrich telemetry so sampling policies can use attributes like error flags, tenant IDs, or latency labels. Example: set an error flag and copy a tenant attribute into spans before sampling.
```yaml theme={null}
processors:
transform/normalize:
error_mode: ignore
traces:
statements:
- set(span.attributes["error.flag"], span.status.code == "STATUS_CODE_ERROR")
- set(span.attributes["tenant"], resource.attributes["tenant"]) where
resource.attributes["tenant"] != nil
```
After transforms, telemetry flows through processors that can include sampling processors before export.
Two fundamental Collector sampling approaches:
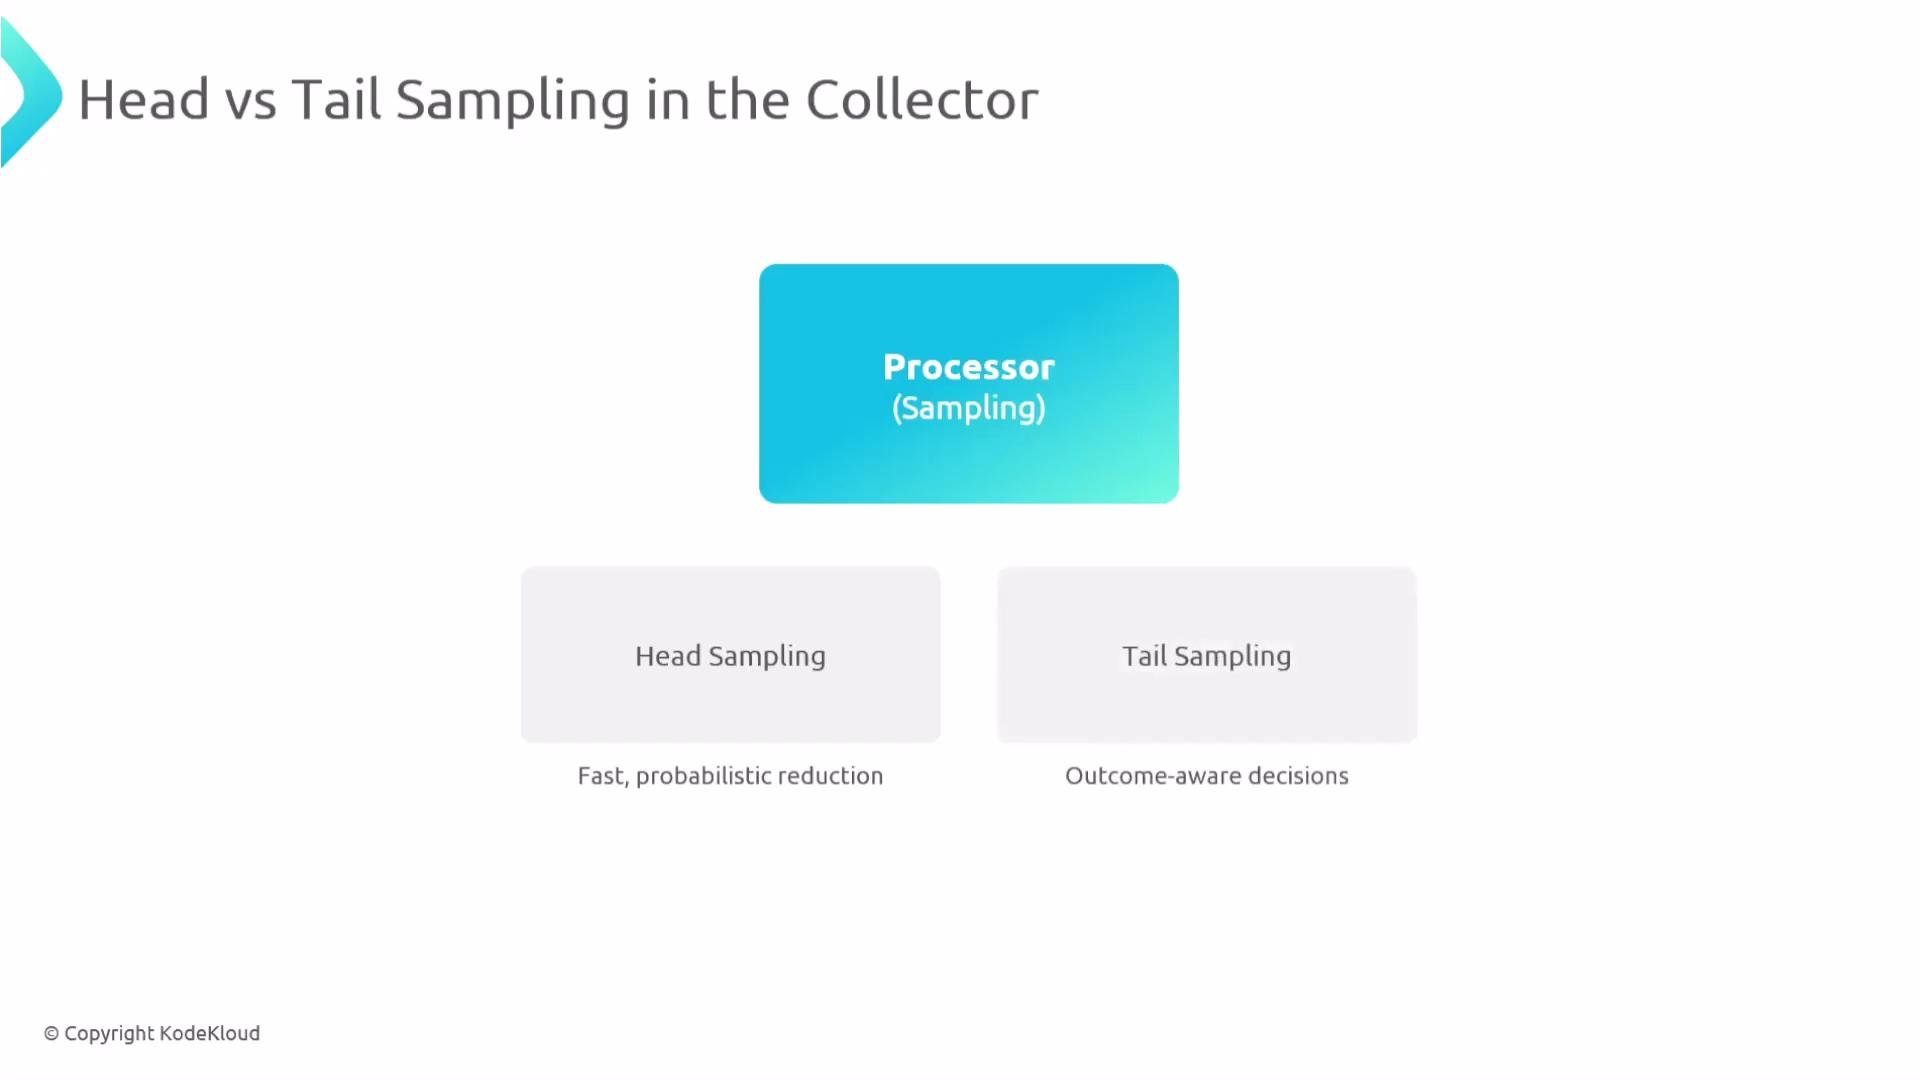 Table: Collector sampling comparison
| Approach | How it works | Pros | Cons |
| ------------- | ------------------------------------------------------------------------------------------------------------------------- | ----------------------------------------------------------------------------------------------------- | -------------------------------------------------------------------------- |
| Head sampling | Decide as spans arrive at the Collector (per-span or per-trace probabilistic policies based on partial info) | Low memory & CPU, fast, scalable | Cannot use full-trace outcomes (may miss important traces) |
| Tail sampling | Buffer and assemble a trace (or wait for a decision signal) and then evaluate the entire trace before keeping or dropping | Outcome-aware (keep traces with errors/latency/patterns), more accurate retention of important traces | Requires buffering, more memory and CPU, complexity in distributed systems |
Tail sampling improves retention of high-value traces but increases memory and processing needs in the Collector. Plan capacity, timeouts, and resource limits carefully to avoid buffering overload.
When to choose which:
* Use SDK or Collector head sampling for lightweight, probabilistic reduction when you only need volume control.
* Use Collector tail sampling when you must make outcome-based decisions (for example, retain all traces that contain errors or unusually high latency).
* Combine approaches: use SDK sampling to reduce baseline volume and tail sampling in the Collector for application-level exceptions or multi-service error patterns.
References and further reading
* OpenTelemetry: [https://opentelemetry.io/](https://opentelemetry.io/)
* OpenTelemetry Collector: [https://opentelemetry.io/docs/collector/](https://opentelemetry.io/docs/collector/)
* OTTL (OpenTelemetry Transformation Language) docs: [https://opentelemetry.io/docs/collector/processing/transform/](https://opentelemetry.io/docs/collector/processing/transform/)
Table: Collector sampling comparison
| Approach | How it works | Pros | Cons |
| ------------- | ------------------------------------------------------------------------------------------------------------------------- | ----------------------------------------------------------------------------------------------------- | -------------------------------------------------------------------------- |
| Head sampling | Decide as spans arrive at the Collector (per-span or per-trace probabilistic policies based on partial info) | Low memory & CPU, fast, scalable | Cannot use full-trace outcomes (may miss important traces) |
| Tail sampling | Buffer and assemble a trace (or wait for a decision signal) and then evaluate the entire trace before keeping or dropping | Outcome-aware (keep traces with errors/latency/patterns), more accurate retention of important traces | Requires buffering, more memory and CPU, complexity in distributed systems |
Tail sampling improves retention of high-value traces but increases memory and processing needs in the Collector. Plan capacity, timeouts, and resource limits carefully to avoid buffering overload.
When to choose which:
* Use SDK or Collector head sampling for lightweight, probabilistic reduction when you only need volume control.
* Use Collector tail sampling when you must make outcome-based decisions (for example, retain all traces that contain errors or unusually high latency).
* Combine approaches: use SDK sampling to reduce baseline volume and tail sampling in the Collector for application-level exceptions or multi-service error patterns.
References and further reading
* OpenTelemetry: [https://opentelemetry.io/](https://opentelemetry.io/)
* OpenTelemetry Collector: [https://opentelemetry.io/docs/collector/](https://opentelemetry.io/docs/collector/)
* OTTL (OpenTelemetry Transformation Language) docs: [https://opentelemetry.io/docs/collector/processing/transform/](https://opentelemetry.io/docs/collector/processing/transform/)