> ## Documentation Index
> Fetch the complete documentation index at: https://notes.kodekloud.com/llms.txt
> Use this file to discover all available pages before exploring further.
# Tail Sampling
> Tail sampling for OpenTelemetry Collector that defers sampling until traces complete, evaluates ordered policies to retain outcome relevant traces while managing memory, latency, and scaling
Tail sampling defers the sampling decision until a trace completes — after all spans for that trace have been collected. This lets you make decisions using the trace’s final outcome (errors, latency, span counts, attributes) instead of sampling early without full context.
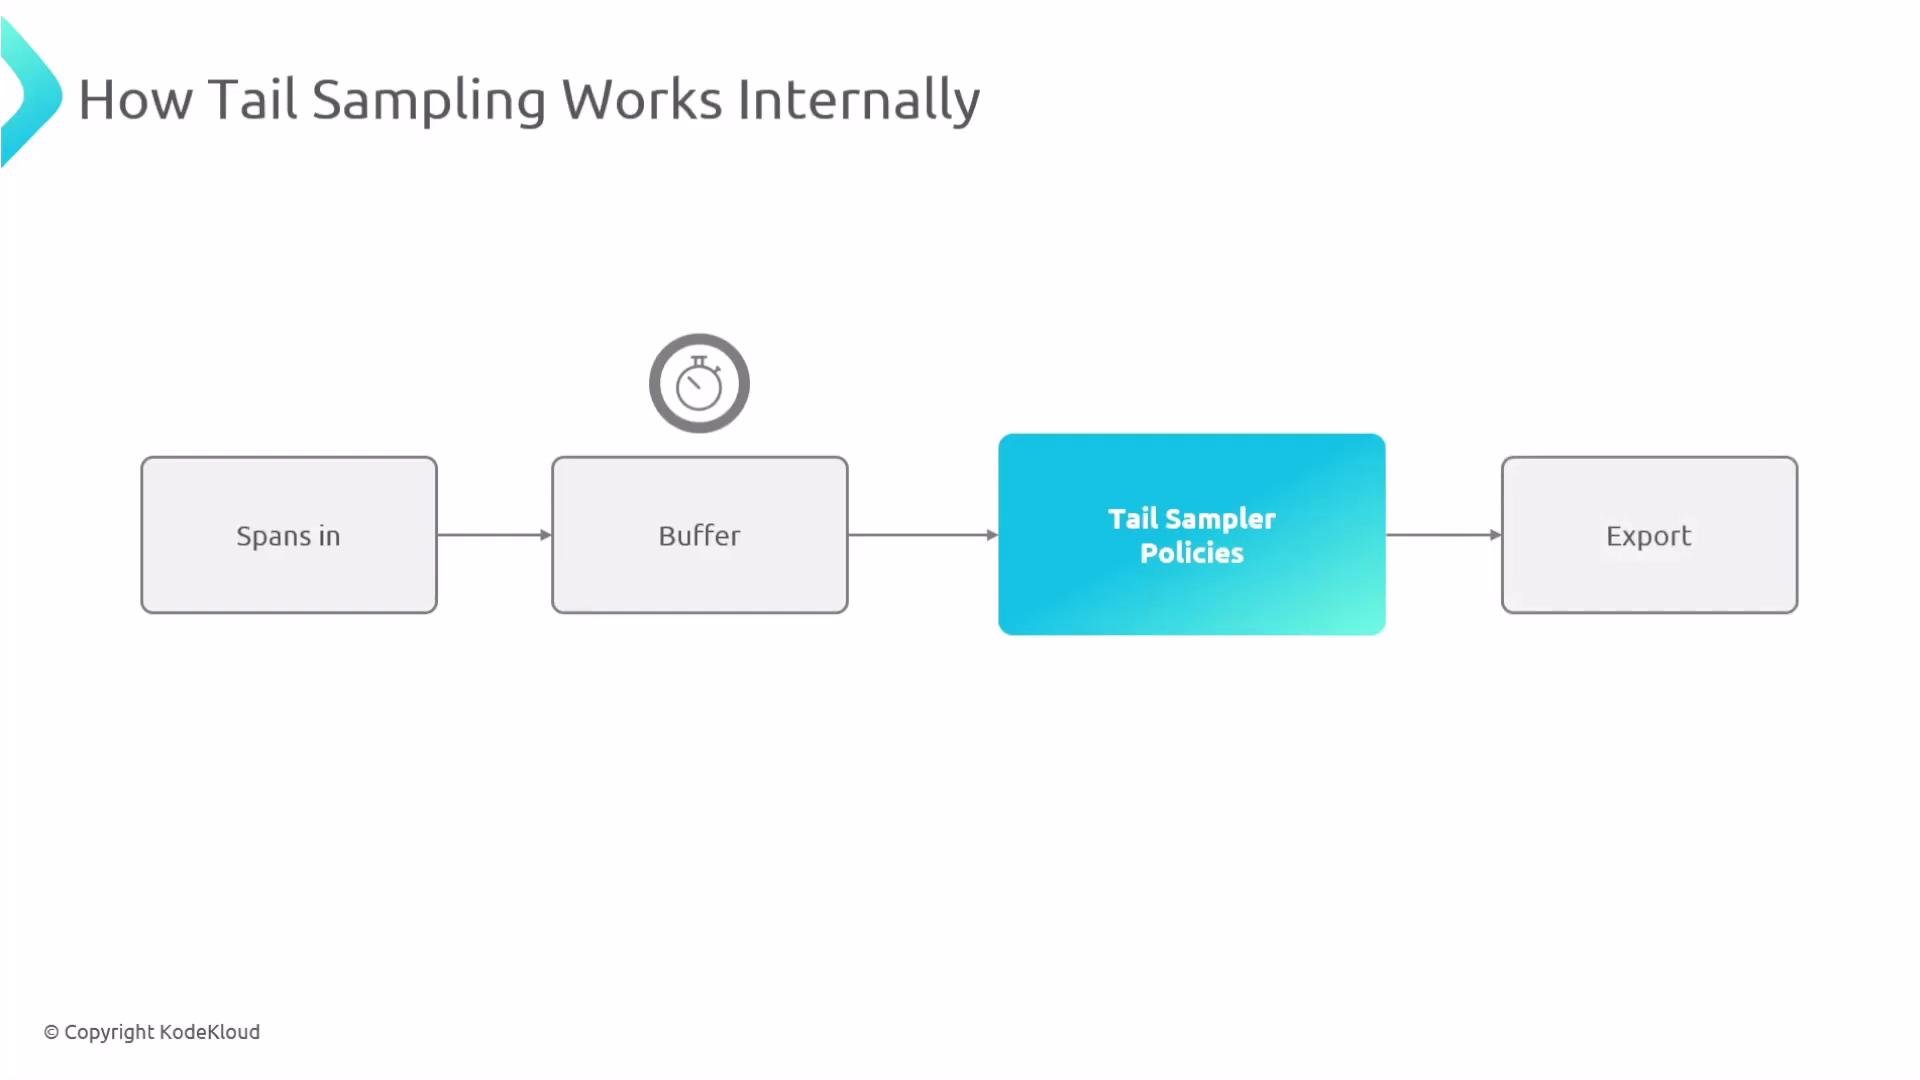
When traces arrive at an OpenTelemetry Collector, the tail sampler buffers each trace until it finishes (or the configured decision wait expires). The sampler evaluates policies in order, retains traces that match a policy, and drops or further samples the remainder. Selected traces are then exported to the configured backend.
Example high-level tail-sampling configuration:
```yaml theme={null}
# collector-config.yaml (high-level example)
processors:
tail_sampling:
policies:
- name: errors-policy
type: status_code
- name: latency-policy
type: latency
- name: probabilistic
type: probabilistic
sampling_percentage: 10
```
How tail sampling works (internal flow):
* Spans arrive at the OpenTelemetry Collector and are buffered until the trace completes or `decision_wait` expires.
* The tail sampler evaluates configured policies in order.
* The first matching policy determines whether the trace is kept; otherwise fallback rules (rate allocation, probabilistic rules) apply.
* Kept traces are exported; others are dropped.
 Policy examples, `decision_wait`, and behavior
The `decision_wait` parameter controls how long the collector waits for late-arriving spans before making a sampling decision. Typical values are a few seconds (for example, `5s`). Policies are evaluated in the configured order — the first matching policy decides to keep a trace.
Detailed example showing multiple policy types, a decision wait, and rate allocation:
```yaml theme={null}
# collector-config.yaml (detailed tail-sampling example)
processors:
tail_sampling:
decision_wait: 5s
policies:
- status_code:
status_codes: ["ERROR"]
- latency:
threshold_ms: 1200
- spans_count:
min_spans: 50
- string_attribute:
key: tenant
values: ["vip"]
- rate_limiting:
spans_per_second: 2000
rate_allocation:
policies:
- name: remaining
percentage: 5
```
Common policy types and when to use them:
| Policy Type | Purpose | Example snippet |
| --------------- | --------------------------------------------- | --------------------------------- |
| Status code | Retain traces with error/failed status | `status_codes: ["ERROR"]` |
| Latency | Capture slow requests exceeding a threshold | `threshold_ms: 1200` |
| Spans count | Keep high-complexity traces with many spans | `min_spans: 50` |
| Attribute match | Retain traces from important tenants/services | `key: tenant` / `values: ["vip"]` |
| Rate limiting | Cap throughput to limit resource usage | `spans_per_second: 2000` |
| Rate allocation | Sample a percentage of remaining traces | `percentage: 5` |
* The status code policy retains traces containing errors.
* The latency policy retains traces slower than 1200 ms.
* The spans count policy retains traces with many spans (e.g., >= 50).
* The attribute policy retains traces containing `tenant: "vip"`.
* The rate-limiting policy caps throughput (e.g., 2000 spans/sec).
* The rate allocation policy samples a percentage of traces that didn't match earlier rules (e.g., 5%).
Set an appropriate `decision_wait` (for example, `decision_wait: 5s`) to balance waiting for late spans against export latency. Monitor late-span patterns and tune this value to match your environment.
Trade-offs of tail sampling
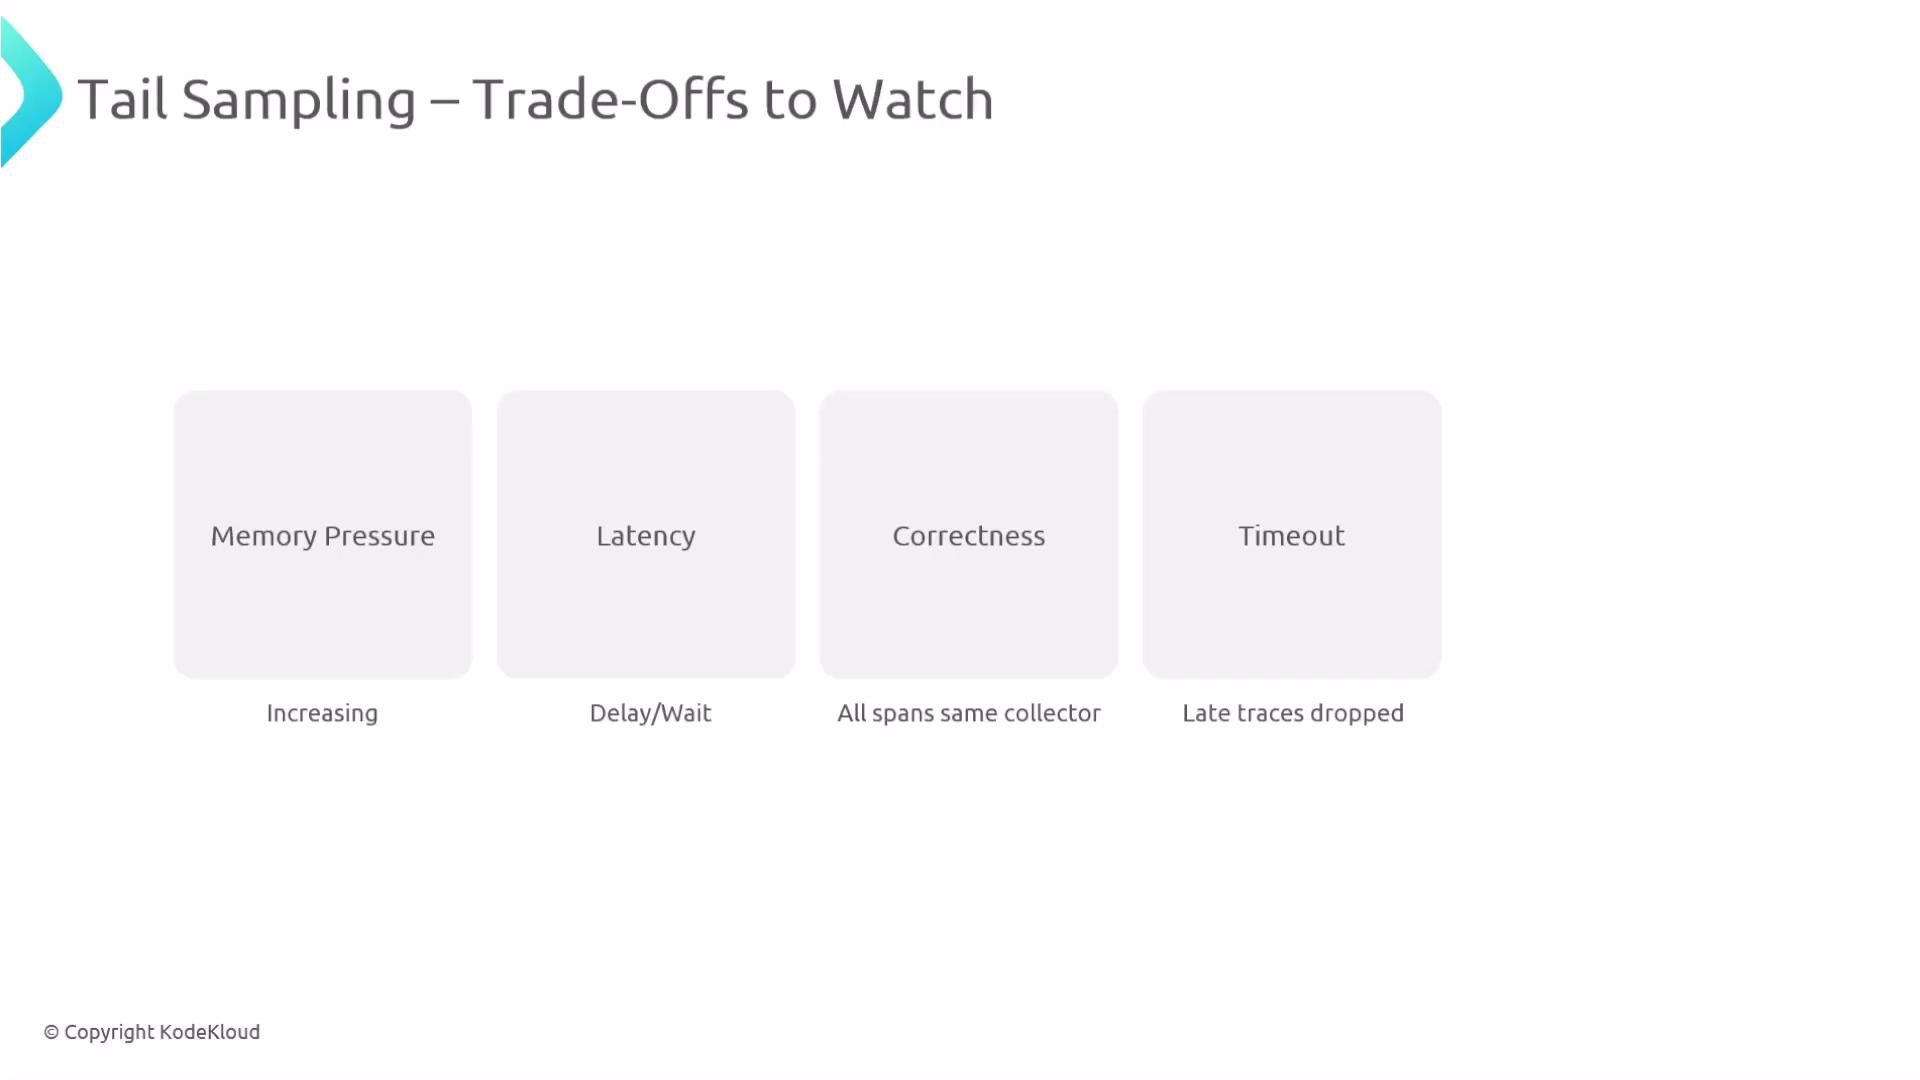
Tail sampling is powerful for retaining outcome-relevant traces, but it introduces trade-offs you must manage:
| Trade-off | Impact |
| --------------------: | --------------------------------------------------------------------------------------------- |
| Memory pressure | Traces are buffered until completion; memory usage increases with traffic and trace duration. |
| Added latency | Export decisions are delayed until the trace completes (plus `decision_wait`). |
| Correctness | All spans for a trace must reach the same collector for accurate decisions. |
| Late spans / timeouts | Spans arriving after buffer expiry are dropped, potentially causing incomplete traces. |
Monitor collector metrics (buffer sizes, dropped spans, memory usage, sampling decisions) to detect and address these impacts.
Policy examples, `decision_wait`, and behavior
The `decision_wait` parameter controls how long the collector waits for late-arriving spans before making a sampling decision. Typical values are a few seconds (for example, `5s`). Policies are evaluated in the configured order — the first matching policy decides to keep a trace.
Detailed example showing multiple policy types, a decision wait, and rate allocation:
```yaml theme={null}
# collector-config.yaml (detailed tail-sampling example)
processors:
tail_sampling:
decision_wait: 5s
policies:
- status_code:
status_codes: ["ERROR"]
- latency:
threshold_ms: 1200
- spans_count:
min_spans: 50
- string_attribute:
key: tenant
values: ["vip"]
- rate_limiting:
spans_per_second: 2000
rate_allocation:
policies:
- name: remaining
percentage: 5
```
Common policy types and when to use them:
| Policy Type | Purpose | Example snippet |
| --------------- | --------------------------------------------- | --------------------------------- |
| Status code | Retain traces with error/failed status | `status_codes: ["ERROR"]` |
| Latency | Capture slow requests exceeding a threshold | `threshold_ms: 1200` |
| Spans count | Keep high-complexity traces with many spans | `min_spans: 50` |
| Attribute match | Retain traces from important tenants/services | `key: tenant` / `values: ["vip"]` |
| Rate limiting | Cap throughput to limit resource usage | `spans_per_second: 2000` |
| Rate allocation | Sample a percentage of remaining traces | `percentage: 5` |
* The status code policy retains traces containing errors.
* The latency policy retains traces slower than 1200 ms.
* The spans count policy retains traces with many spans (e.g., >= 50).
* The attribute policy retains traces containing `tenant: "vip"`.
* The rate-limiting policy caps throughput (e.g., 2000 spans/sec).
* The rate allocation policy samples a percentage of traces that didn't match earlier rules (e.g., 5%).
Set an appropriate `decision_wait` (for example, `decision_wait: 5s`) to balance waiting for late spans against export latency. Monitor late-span patterns and tune this value to match your environment.
Trade-offs of tail sampling
Tail sampling is powerful for retaining outcome-relevant traces, but it introduces trade-offs you must manage:
| Trade-off | Impact |
| --------------------: | --------------------------------------------------------------------------------------------- |
| Memory pressure | Traces are buffered until completion; memory usage increases with traffic and trace duration. |
| Added latency | Export decisions are delayed until the trace completes (plus `decision_wait`). |
| Correctness | All spans for a trace must reach the same collector for accurate decisions. |
| Late spans / timeouts | Spans arriving after buffer expiry are dropped, potentially causing incomplete traces. |
Monitor collector metrics (buffer sizes, dropped spans, memory usage, sampling decisions) to detect and address these impacts.
 Scaling: combine head and tail sampling
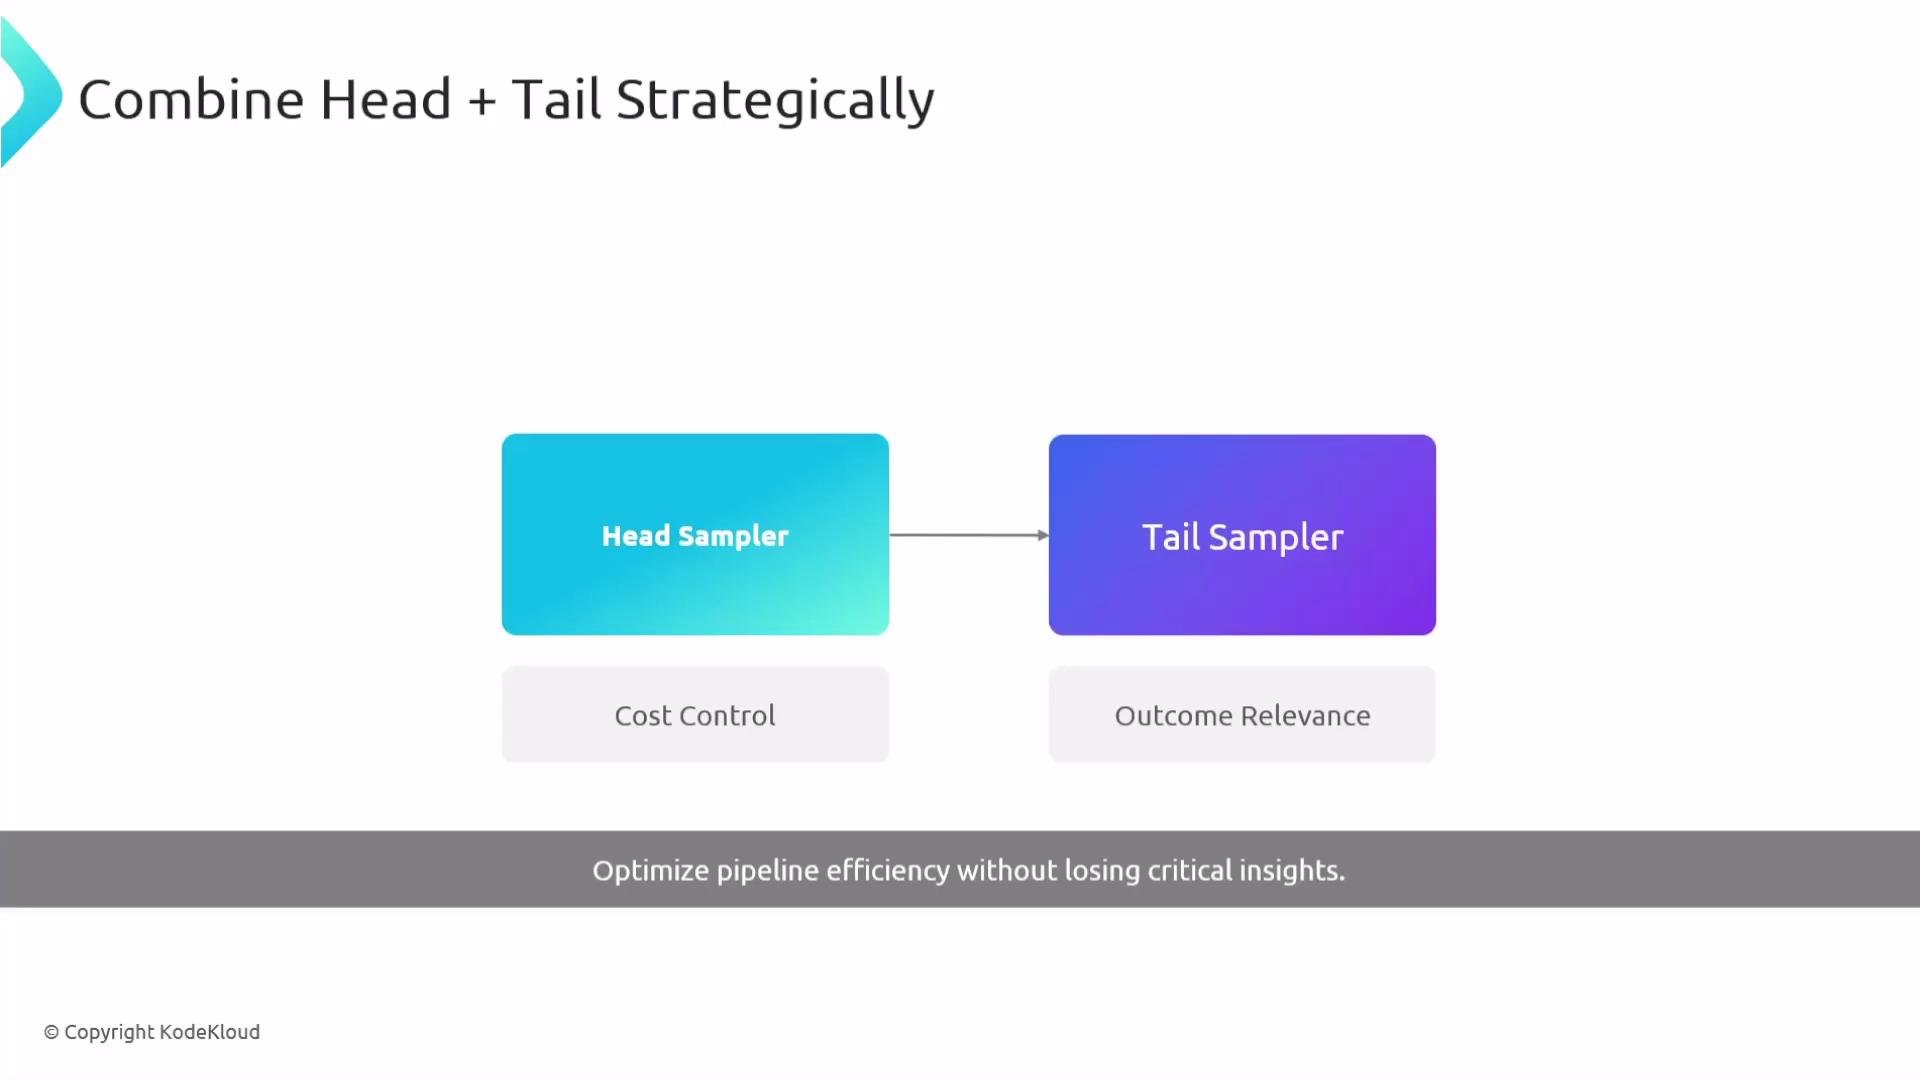
For high-volume environments, combine head (early) and tail (late) sampling:
* Head sampler (application or edge collector): perform early probabilistic sampling to reduce telemetry volume and cost.
* Tail sampler (downstream collector): retain outcome-relevant traces such as errors, slow traces, or traces from important tenants or services.
This hybrid approach balances cost control with the ability to preserve high-value traces for debugging and analysis.
Scaling: combine head and tail sampling
For high-volume environments, combine head (early) and tail (late) sampling:
* Head sampler (application or edge collector): perform early probabilistic sampling to reduce telemetry volume and cost.
* Tail sampler (downstream collector): retain outcome-relevant traces such as errors, slow traces, or traces from important tenants or services.
This hybrid approach balances cost control with the ability to preserve high-value traces for debugging and analysis.
 Distributed collectors and consistent hashing
When collectors are horizontally scaled, spans for the same trace can be routed to different collector instances. For correct tail sampling, ensure all spans for a given trace are routed to the same downstream collector. A common pattern:
* Deploy a first layer of stateless collectors (or edge collectors).
* Use a load-balancing exporter with consistent hashing (trace ID as the routing key) to route spans for the same trace to the same downstream stateful collector instance (e.g., a StatefulSet).
* The downstream collectors perform tail sampling on complete traces.
If a single collector handles all traffic, extra routing is not required. At scale, also add memory limiting and batching processors to stabilize resource usage:
```yaml theme={null}
# processors for resource control and batching
processors:
memory_limiter:
check_interval: 1s
limit_mib: 3500
spike_limit_mib: 500
batch:
send_batch_size: 2000
timeout: 2s
```
Monitor collector metrics (dropped spans, memory usage, sampling decisions, buffer sizes) and tune `memory_limiter`, `batch`, and `decision_wait` accordingly.
If spans for a trace are routed to different collectors, tail sampling decisions will be inaccurate. Use consistent hashing (trace ID) in the load-balancing exporter to maintain trace integrity.
Summary and best practices
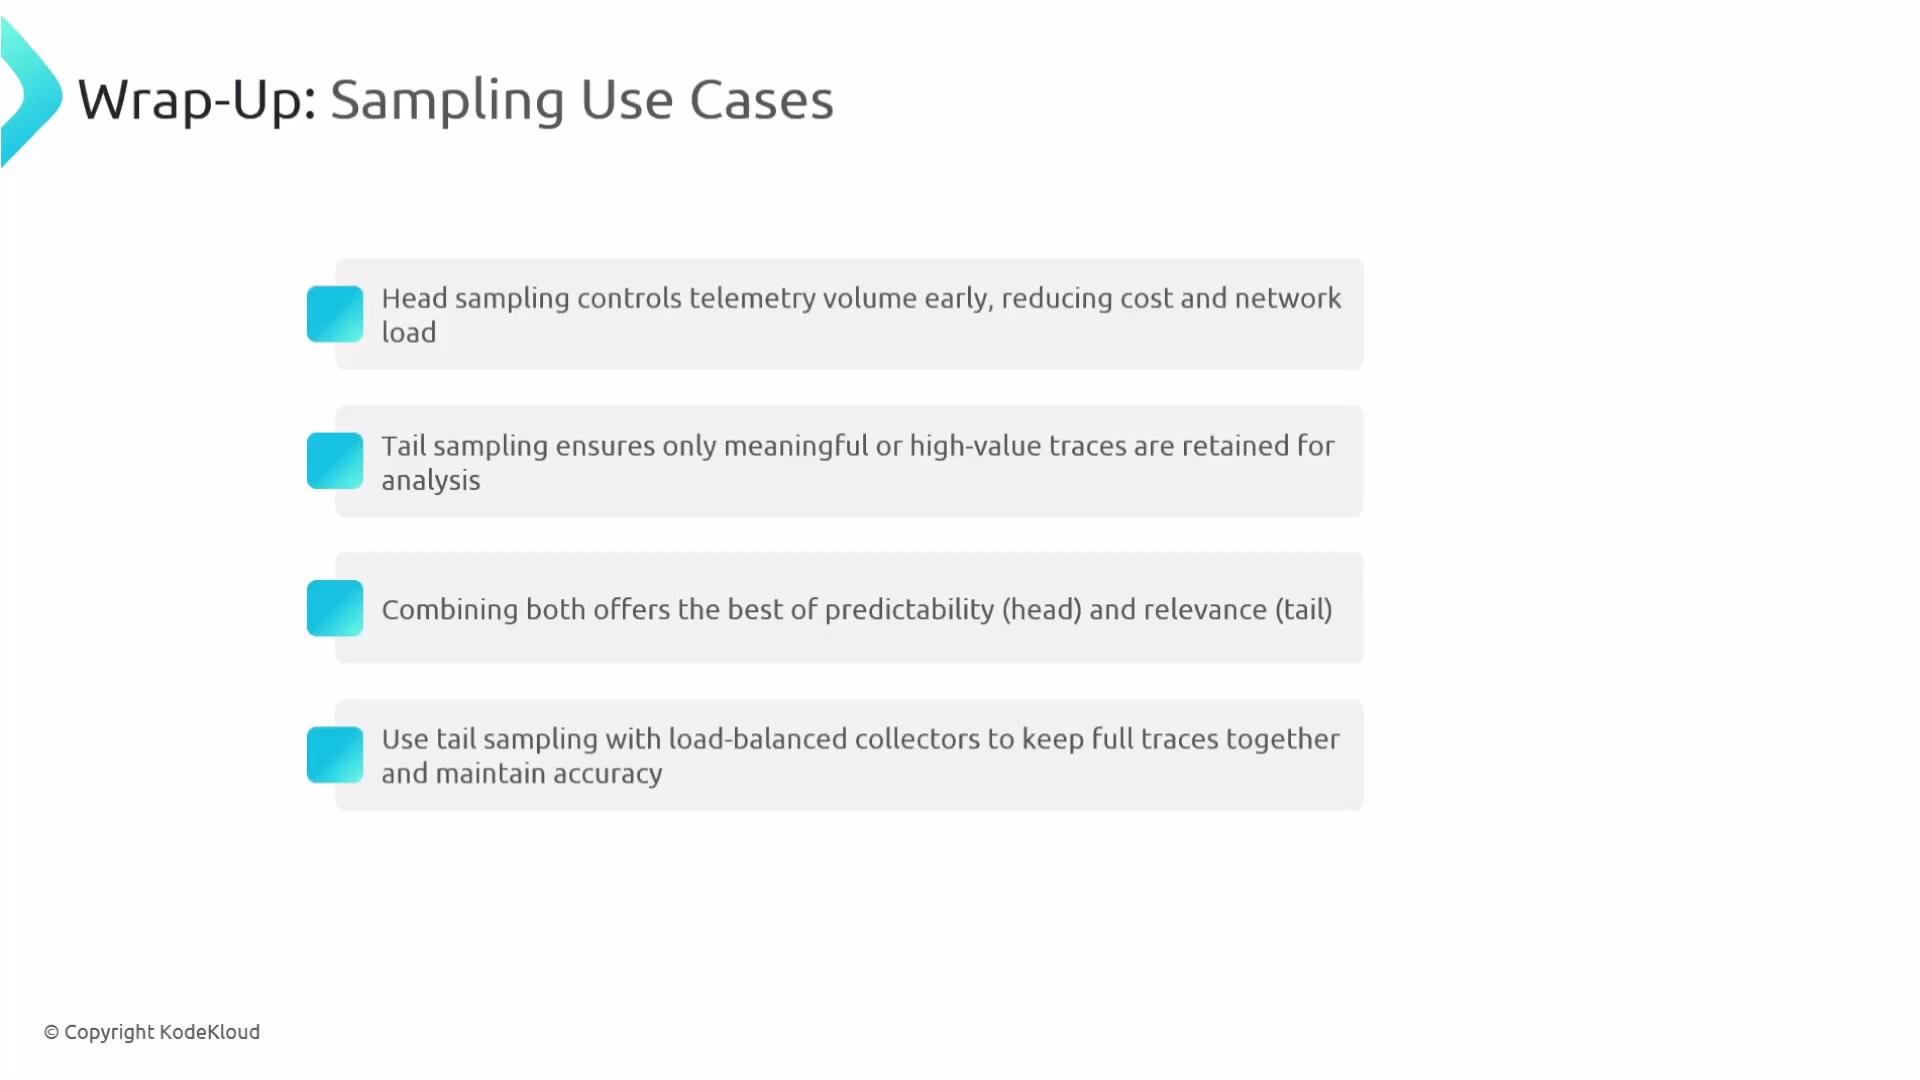
* Use head sampling to control telemetry volume early and reduce costs; use tail sampling to retain traces that matter based on full trace outcomes.
* Tail sampling is especially valuable where retaining all traces is infeasible but outcome-relevant traces must be preserved.
* For correct tail sampling at scale, route all spans of a trace to the same collector using consistent hashing on the trace ID.
* Monitor and tune: `decision_wait`, `memory_limiter`, and batching parameters to balance memory usage, latency, and sampling accuracy.
* Consider hybrid architectures (head + tail) to achieve both cost efficiency and diagnostic fidelity.
Distributed collectors and consistent hashing
When collectors are horizontally scaled, spans for the same trace can be routed to different collector instances. For correct tail sampling, ensure all spans for a given trace are routed to the same downstream collector. A common pattern:
* Deploy a first layer of stateless collectors (or edge collectors).
* Use a load-balancing exporter with consistent hashing (trace ID as the routing key) to route spans for the same trace to the same downstream stateful collector instance (e.g., a StatefulSet).
* The downstream collectors perform tail sampling on complete traces.
If a single collector handles all traffic, extra routing is not required. At scale, also add memory limiting and batching processors to stabilize resource usage:
```yaml theme={null}
# processors for resource control and batching
processors:
memory_limiter:
check_interval: 1s
limit_mib: 3500
spike_limit_mib: 500
batch:
send_batch_size: 2000
timeout: 2s
```
Monitor collector metrics (dropped spans, memory usage, sampling decisions, buffer sizes) and tune `memory_limiter`, `batch`, and `decision_wait` accordingly.
If spans for a trace are routed to different collectors, tail sampling decisions will be inaccurate. Use consistent hashing (trace ID) in the load-balancing exporter to maintain trace integrity.
Summary and best practices
* Use head sampling to control telemetry volume early and reduce costs; use tail sampling to retain traces that matter based on full trace outcomes.
* Tail sampling is especially valuable where retaining all traces is infeasible but outcome-relevant traces must be preserved.
* For correct tail sampling at scale, route all spans of a trace to the same collector using consistent hashing on the trace ID.
* Monitor and tune: `decision_wait`, `memory_limiter`, and batching parameters to balance memory usage, latency, and sampling accuracy.
* Consider hybrid architectures (head + tail) to achieve both cost efficiency and diagnostic fidelity.
 This means every trace must be routed (via consistent hashing on trace ID) to the same downstream collector so tail-based sampling decisions are accurate and trace integrity is preserved.
Links and references
* OpenTelemetry Collector documentation: [https://opentelemetry.io/docs/collector/](https://opentelemetry.io/docs/collector/)
* Consistent hashing overview: [https://en.wikipedia.org/wiki/Consistent\_hashing](https://en.wikipedia.org/wiki/Consistent_hashing)
* OpenTelemetry sampling concepts: [https://opentelemetry.io/docs/concepts/sampling/](https://opentelemetry.io/docs/concepts/sampling/)
This means every trace must be routed (via consistent hashing on trace ID) to the same downstream collector so tail-based sampling decisions are accurate and trace integrity is preserved.
Links and references
* OpenTelemetry Collector documentation: [https://opentelemetry.io/docs/collector/](https://opentelemetry.io/docs/collector/)
* Consistent hashing overview: [https://en.wikipedia.org/wiki/Consistent\_hashing](https://en.wikipedia.org/wiki/Consistent_hashing)
* OpenTelemetry sampling concepts: [https://opentelemetry.io/docs/concepts/sampling/](https://opentelemetry.io/docs/concepts/sampling/)