> ## Documentation Index
> Fetch the complete documentation index at: https://notes.kodekloud.com/llms.txt
> Use this file to discover all available pages before exploring further.
# Alertmanager Demo
> Guide to creating Prometheus alerting rules and configuring Alertmanager to route and group alerts with Slack notifications and practical examples
This walkthrough demonstrates creating Prometheus alerting rules and configuring Alertmanager to route notifications to Slack. The demo assumes Prometheus and Alertmanager are installed and running on the same host (they can run on separate hosts in production).
## Verify Alertmanager is running
Check Alertmanager's systemd status:
```bash theme={null}
sudo systemctl status alertmanager
```
Example output:
```bash theme={null}
alertmanager.service - Alert Manager
Loaded: loaded (/etc/systemd/system/alertmanager.service; enabled; vendor preset: enabled)
Active: active (running) since Sun 2022-11-27 18:34:40 EST; 3min 59s ago
Main PID: 375825 (alertmanager)
Tasks: 6 (limit: 9457)
Memory: 15.1M
CPU: 270ms
CGroup: /system.slice/alertmanager.service
└─375825 /usr/local/bin/alertmanager --config.file=/etc/alertmanager/alertmanager.yml --storage.path=/var/lib/alertmanager
```
## Create Prometheus alerting rules
Create `/etc/prometheus/rules.yaml` and define your alert groups. Below is a minimal example for detecting a node being down:
```yaml theme={null}
groups:
- name: my-alerts
interval: 15s
rules:
- alert: NodeDown
expr: up{job="node"} == 0
for: 2m
labels:
team: infra
env: prod
annotations:
message: "{{ .Labels.instance }} is currently down"
```
Full example with three alerts (node plus two database jobs). Save as `/etc/prometheus/rules.yaml`:
```yaml theme={null}
groups:
- name: my-alerts
interval: 15s
rules:
- alert: NodeDown
expr: up{job="node"} == 0
for: 0m
labels:
team: infra
env: prod
annotations:
message: "{{ .Labels.instance }} is currently down"
- alert: DatabaseDown
expr: up{job="db1"} == 0
for: 0m
labels:
team: database
env: prod
annotations:
message: "{{ .Labels.instance }} is currently down"
- alert: DatabaseDown-dev
expr: up{job="db2"} == 0
for: 0m
labels:
team: database
env: dev
annotations:
message: "{{ .Labels.instance }} is currently down"
```
Rule `labels` are critical: they enable Alertmanager to match, group, and route alerts. Use `annotations` for human-readable alert text and details.
Important rule fields (quick reference):
| Field | Purpose | Example |
| ------------- | -------------------------------------------------- | ----------------------------------------------------- |
| `expr` | PromQL expression tested each evaluation | `up{job="node"} == 0` |
| `for` | How long expression must be true before firing | `0m` (immediate) or `2m` (delay) |
| `labels` | Metadata used for grouping/routing in Alertmanager | `team: infra`, `env: prod` |
| `annotations` | Human-readable info for notifications | `message: "{{ .Labels.instance }} is currently down"` |
After saving rules, restart Prometheus:
```bash theme={null}
sudo systemctl restart prometheus
```
Open the Prometheus web UI and check the Alerts page to confirm the rules loaded:
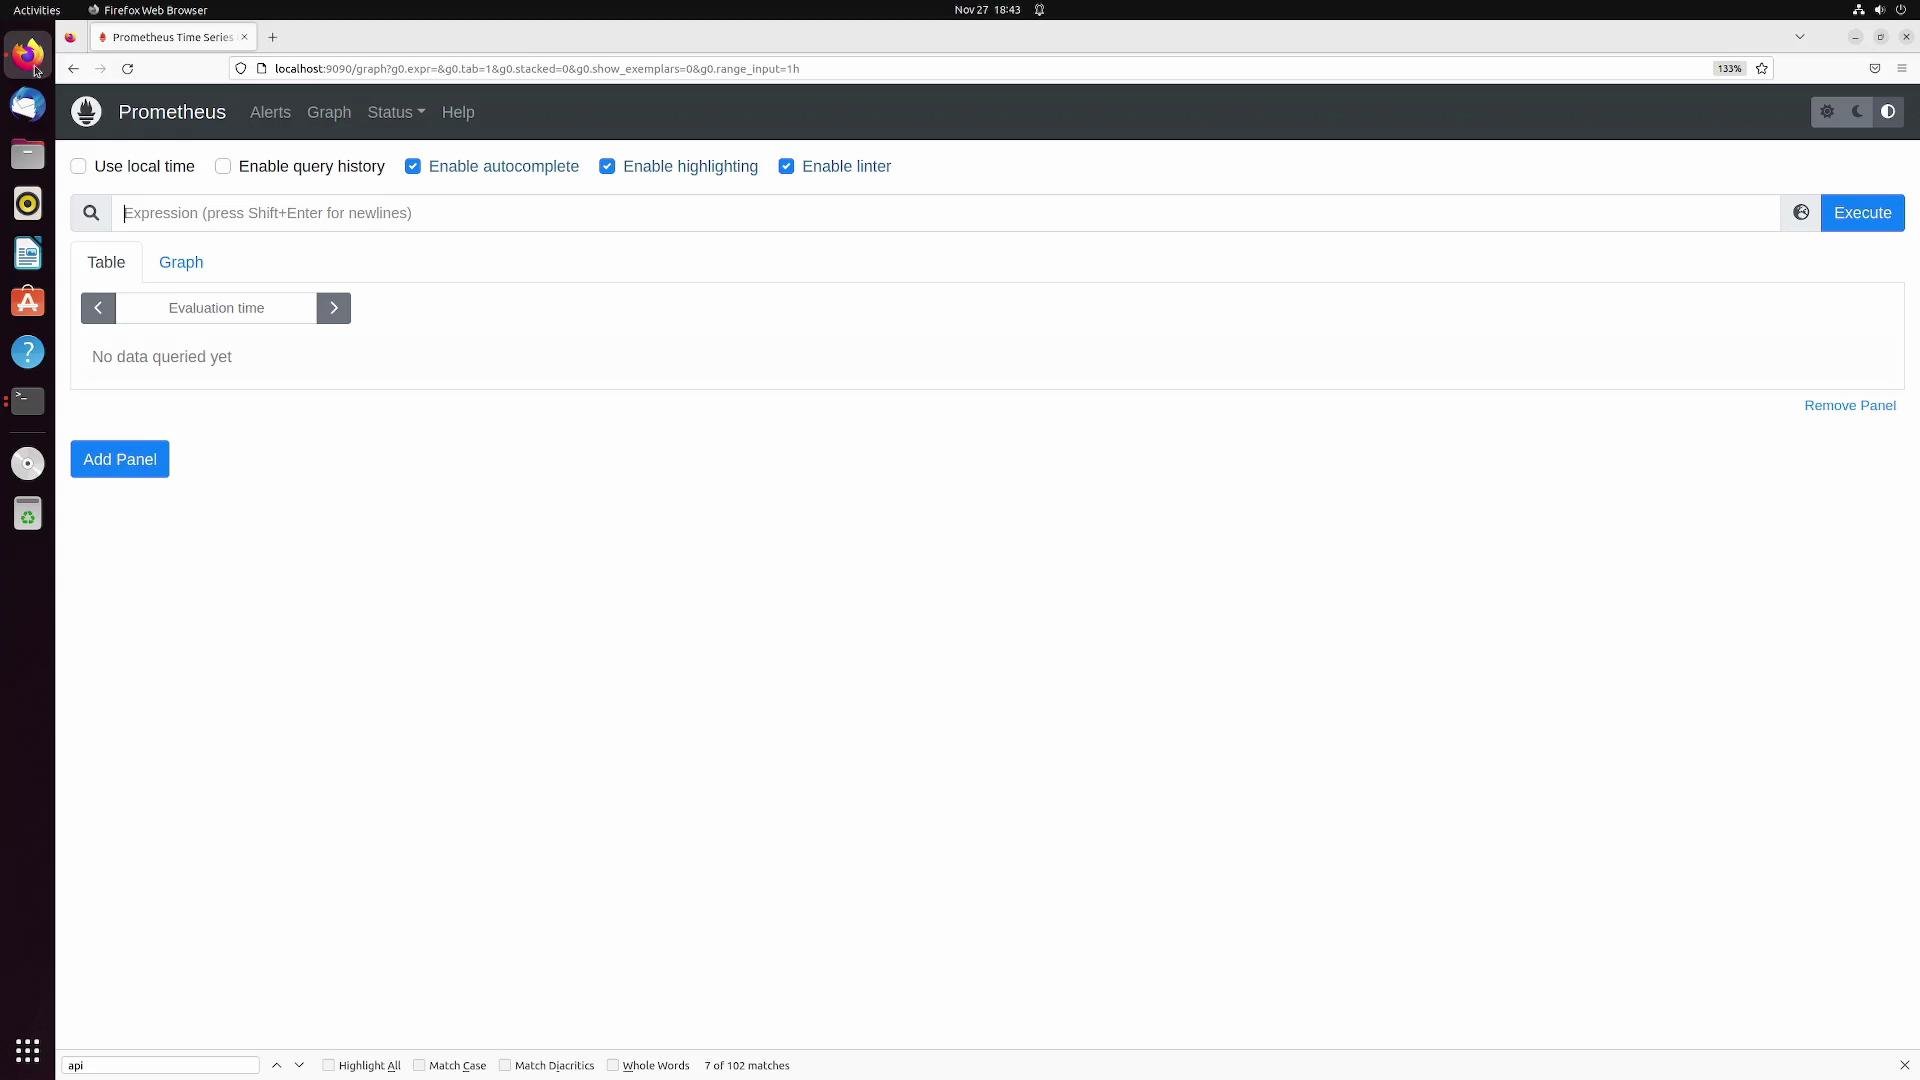 If Prometheus does not see your rules, ensure your `prometheus.yml` includes the `rule_files` entry and your scrape targets.
Example `/etc/prometheus/prometheus.yml`:
```yaml theme={null}
global:
scrape_interval: 15s
scrape_timeout: 10s
rule_files:
- "rules.yaml"
scrape_configs:
- job_name: "prometheus"
static_configs:
- targets: ["localhost:9090"]
- job_name: "node"
static_configs:
- targets: ["192.168.1.168:9100"]
- job_name: "db1"
static_configs:
- targets: ["192.168.1.168:9200"]
- job_name: "db2"
static_configs:
- targets: ["192.168.1.168:9300", "192.168.1.168:9400"]
```
Restart Prometheus if you edit this file:
```bash theme={null}
sudo systemctl restart prometheus
```
When rules are loaded but not triggered, the Alerts page will show them as inactive (green). When conditions are true, alerts move to Pending and then Firing based on `for`.
## Triggering alerts and how `for` works
Prometheus evaluates alert expressions on its schedule. Alerts follow this lifecycle:
* Pending: expression is true but `for` duration not yet reached.
* Firing: expression remained true for the full `for` duration.
Example showing a longer `for` delay:
```yaml theme={null}
groups:
- name: my-alerts
interval: 15s
rules:
- alert: NodeDown
expr: up{job="node"} == 0
for: 9m
labels:
team: infra
env: prod
annotations:
message: "{{ .Labels.instance }} is currently down"
```
With `for: 0m` alerts become firing immediately. With `for: 1m` or higher, Prometheus waits before transitioning to firing.
## Configure Prometheus to send alerts to Alertmanager
Tell Prometheus where Alertmanager is by adding an `alerting` section to `/etc/prometheus/prometheus.yml`:
```yaml theme={null}
alerting:
alertmanagers:
- static_configs:
- targets: ["localhost:9093"]
```
Restart Prometheus:
```bash theme={null}
sudo systemctl restart prometheus
```
Open Alertmanager at [http://localhost:9093](http://localhost:9093). You should begin to see alerts arrive there:
If Prometheus does not see your rules, ensure your `prometheus.yml` includes the `rule_files` entry and your scrape targets.
Example `/etc/prometheus/prometheus.yml`:
```yaml theme={null}
global:
scrape_interval: 15s
scrape_timeout: 10s
rule_files:
- "rules.yaml"
scrape_configs:
- job_name: "prometheus"
static_configs:
- targets: ["localhost:9090"]
- job_name: "node"
static_configs:
- targets: ["192.168.1.168:9100"]
- job_name: "db1"
static_configs:
- targets: ["192.168.1.168:9200"]
- job_name: "db2"
static_configs:
- targets: ["192.168.1.168:9300", "192.168.1.168:9400"]
```
Restart Prometheus if you edit this file:
```bash theme={null}
sudo systemctl restart prometheus
```
When rules are loaded but not triggered, the Alerts page will show them as inactive (green). When conditions are true, alerts move to Pending and then Firing based on `for`.
## Triggering alerts and how `for` works
Prometheus evaluates alert expressions on its schedule. Alerts follow this lifecycle:
* Pending: expression is true but `for` duration not yet reached.
* Firing: expression remained true for the full `for` duration.
Example showing a longer `for` delay:
```yaml theme={null}
groups:
- name: my-alerts
interval: 15s
rules:
- alert: NodeDown
expr: up{job="node"} == 0
for: 9m
labels:
team: infra
env: prod
annotations:
message: "{{ .Labels.instance }} is currently down"
```
With `for: 0m` alerts become firing immediately. With `for: 1m` or higher, Prometheus waits before transitioning to firing.
## Configure Prometheus to send alerts to Alertmanager
Tell Prometheus where Alertmanager is by adding an `alerting` section to `/etc/prometheus/prometheus.yml`:
```yaml theme={null}
alerting:
alertmanagers:
- static_configs:
- targets: ["localhost:9093"]
```
Restart Prometheus:
```bash theme={null}
sudo systemctl restart prometheus
```
Open Alertmanager at [http://localhost:9093](http://localhost:9093). You should begin to see alerts arrive there:
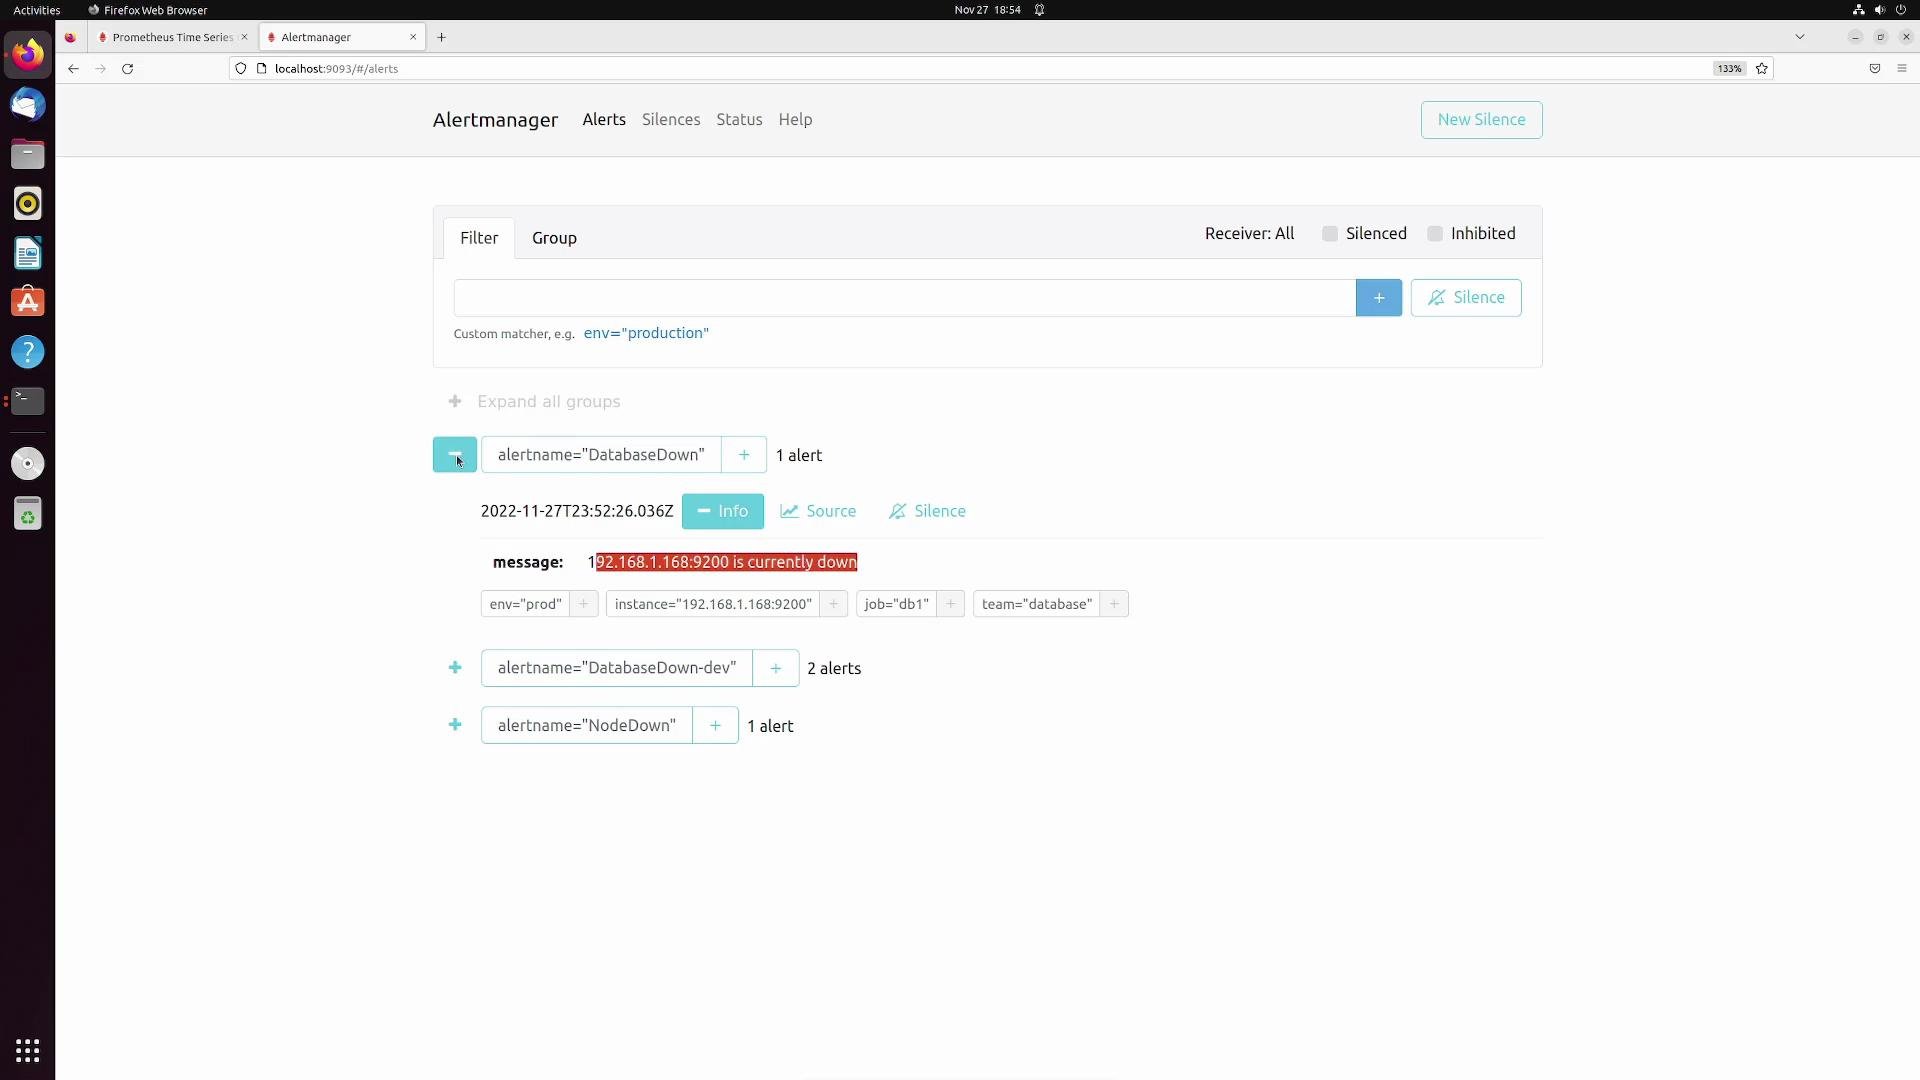 By default, Alertmanager groups by `alertname` and sends to the default receiver. To group or route alerts differently (for example by `team` and `env`), edit Alertmanager's config at `/etc/alertmanager/alertmanager.yml`.
## Alertmanager routing and Slack receiver
This example Alertmanager configuration:
* Matches alerts from specific jobs using `match_re`,
* Groups alerts by `team` and `env`,
* Sends notifications to a Slack webhook receiver.
Edit `/etc/alertmanager/alertmanager.yml`:
```yaml theme={null}
route:
group_by: ['alertname']
group_wait: 30s
group_interval: 1m
repeat_interval: 2m
receiver: 'web.hook'
routes:
- match_re:
job: '(node|db1|db2)'
group_by: ['team', 'env']
receiver: slack
receivers:
- name: 'web.hook'
webhook_configs:
- url: 'http://127.0.0.1:5001/'
- name: slack
slack_configs:
- api_url: 'https://hooks.slack.com/services/T04DB7ZS9PS/B04CMGVTYF4/KQy6AyXbfSwc43qAKFzYxJR'
channel: '#alerts'
title: '{{ .GroupLabels.team }} has alerts in env: {{ .GroupLabels.env }}'
text: '{{ range .Alerts }}{{ .Annotations.message }}{{ "\n" }}{{ end }}'
```
Routing configuration quick reference:
| Setting | Purpose |
| ----------------- | ---------------------------------------------------------- |
| `group_by` | Keys used to combine alerts into a single notification |
| `group_wait` | Time to wait to collect alerts before first notification |
| `group_interval` | How long to wait to form the next batch for the same group |
| `repeat_interval` | How often to resend alerts if they remain firing |
| `match_re` | Regex-based matching of alert labels (e.g., `job`) |
Key notes:
* `match_re` selects alerts by label using regular expressions.
* `group_by: ['team', 'env']` bundles alerts that share those label values into a single message.
* Slack receiver templates use `.GroupLabels` for group-level info and iterate over `.Alerts` to include each alert's `.Annotations.message`.
Grouping by labels such as `team` and `env` reduces notification noise by bundling related alerts into one message per label combination.
Restart Alertmanager after saving the config:
```bash theme={null}
sudo systemctl restart alertmanager
```
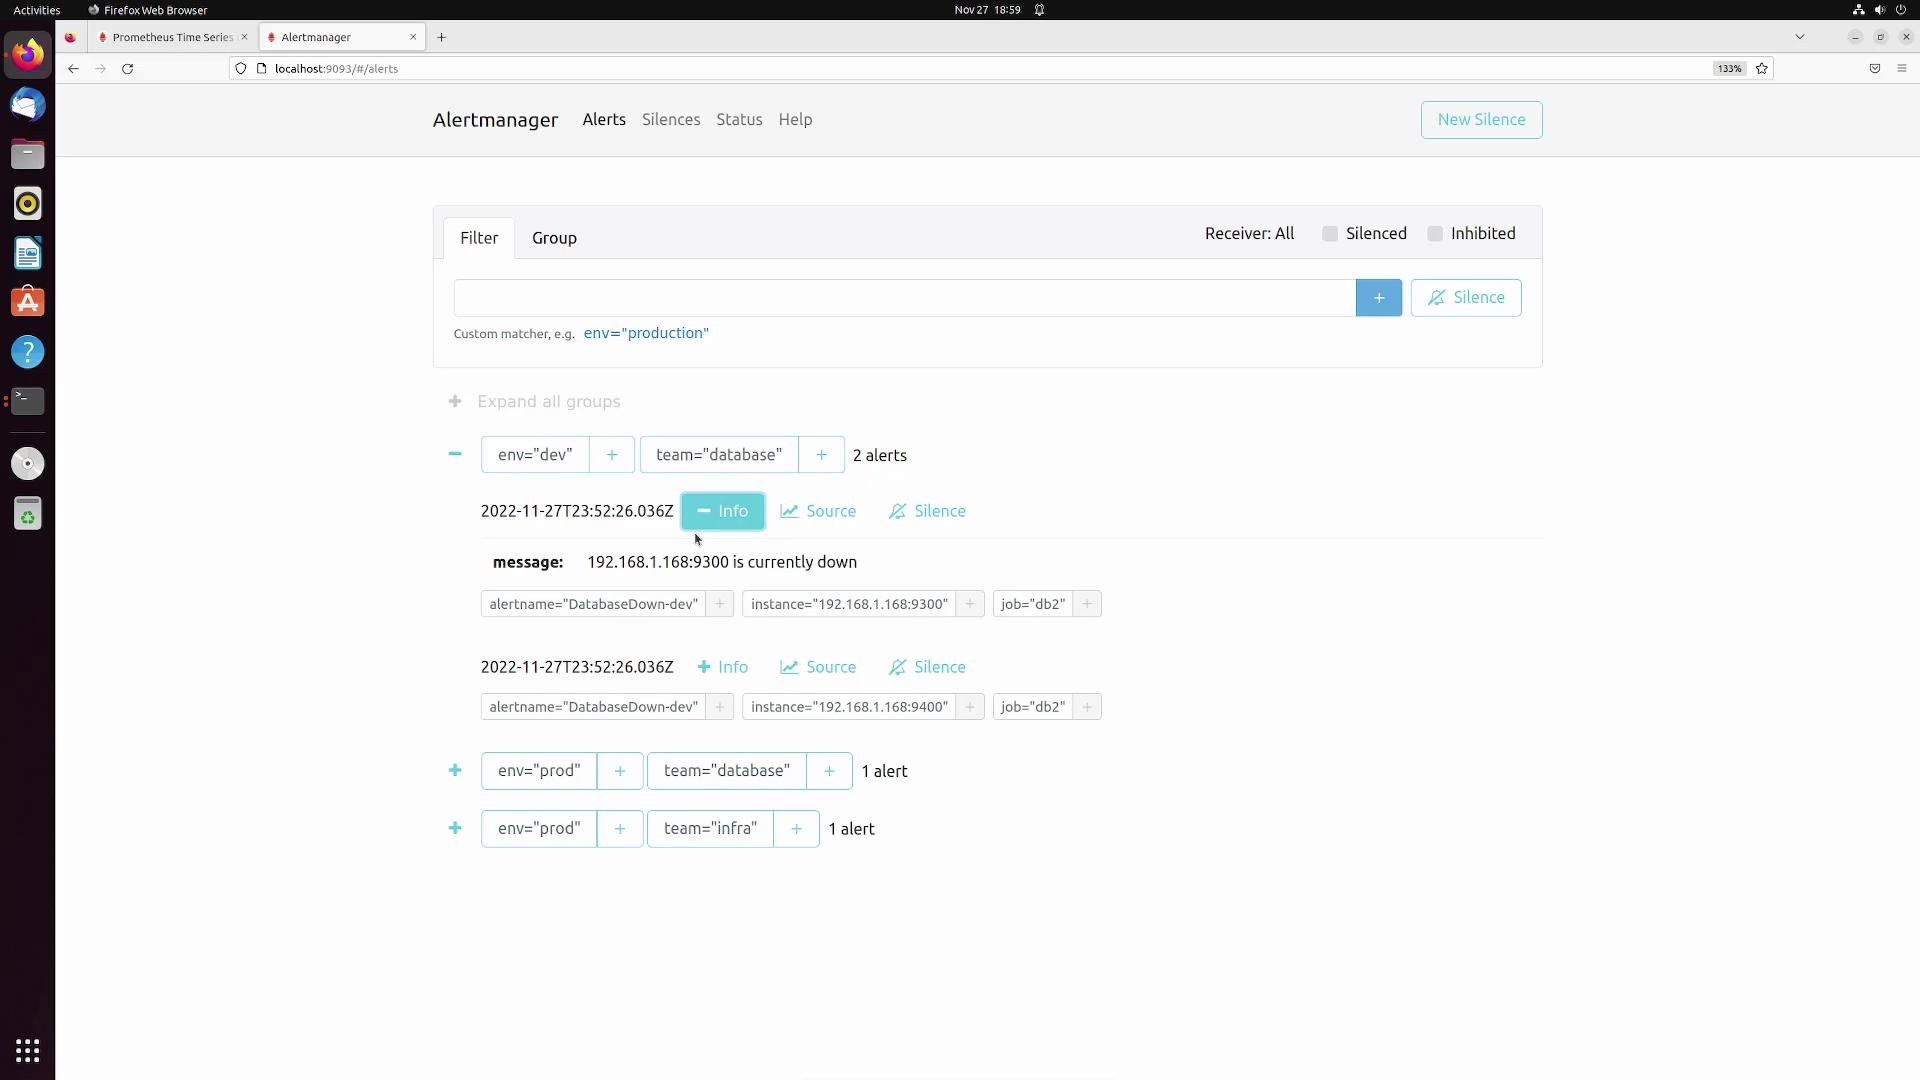
Refresh the Alertmanager UI — alerts should now be grouped by `team` and `env`. Expand groups to see individual alerts and annotations:
By default, Alertmanager groups by `alertname` and sends to the default receiver. To group or route alerts differently (for example by `team` and `env`), edit Alertmanager's config at `/etc/alertmanager/alertmanager.yml`.
## Alertmanager routing and Slack receiver
This example Alertmanager configuration:
* Matches alerts from specific jobs using `match_re`,
* Groups alerts by `team` and `env`,
* Sends notifications to a Slack webhook receiver.
Edit `/etc/alertmanager/alertmanager.yml`:
```yaml theme={null}
route:
group_by: ['alertname']
group_wait: 30s
group_interval: 1m
repeat_interval: 2m
receiver: 'web.hook'
routes:
- match_re:
job: '(node|db1|db2)'
group_by: ['team', 'env']
receiver: slack
receivers:
- name: 'web.hook'
webhook_configs:
- url: 'http://127.0.0.1:5001/'
- name: slack
slack_configs:
- api_url: 'https://hooks.slack.com/services/T04DB7ZS9PS/B04CMGVTYF4/KQy6AyXbfSwc43qAKFzYxJR'
channel: '#alerts'
title: '{{ .GroupLabels.team }} has alerts in env: {{ .GroupLabels.env }}'
text: '{{ range .Alerts }}{{ .Annotations.message }}{{ "\n" }}{{ end }}'
```
Routing configuration quick reference:
| Setting | Purpose |
| ----------------- | ---------------------------------------------------------- |
| `group_by` | Keys used to combine alerts into a single notification |
| `group_wait` | Time to wait to collect alerts before first notification |
| `group_interval` | How long to wait to form the next batch for the same group |
| `repeat_interval` | How often to resend alerts if they remain firing |
| `match_re` | Regex-based matching of alert labels (e.g., `job`) |
Key notes:
* `match_re` selects alerts by label using regular expressions.
* `group_by: ['team', 'env']` bundles alerts that share those label values into a single message.
* Slack receiver templates use `.GroupLabels` for group-level info and iterate over `.Alerts` to include each alert's `.Annotations.message`.
Grouping by labels such as `team` and `env` reduces notification noise by bundling related alerts into one message per label combination.
Restart Alertmanager after saving the config:
```bash theme={null}
sudo systemctl restart alertmanager
```
Refresh the Alertmanager UI — alerts should now be grouped by `team` and `env`. Expand groups to see individual alerts and annotations:
 ## Verify Slack notifications
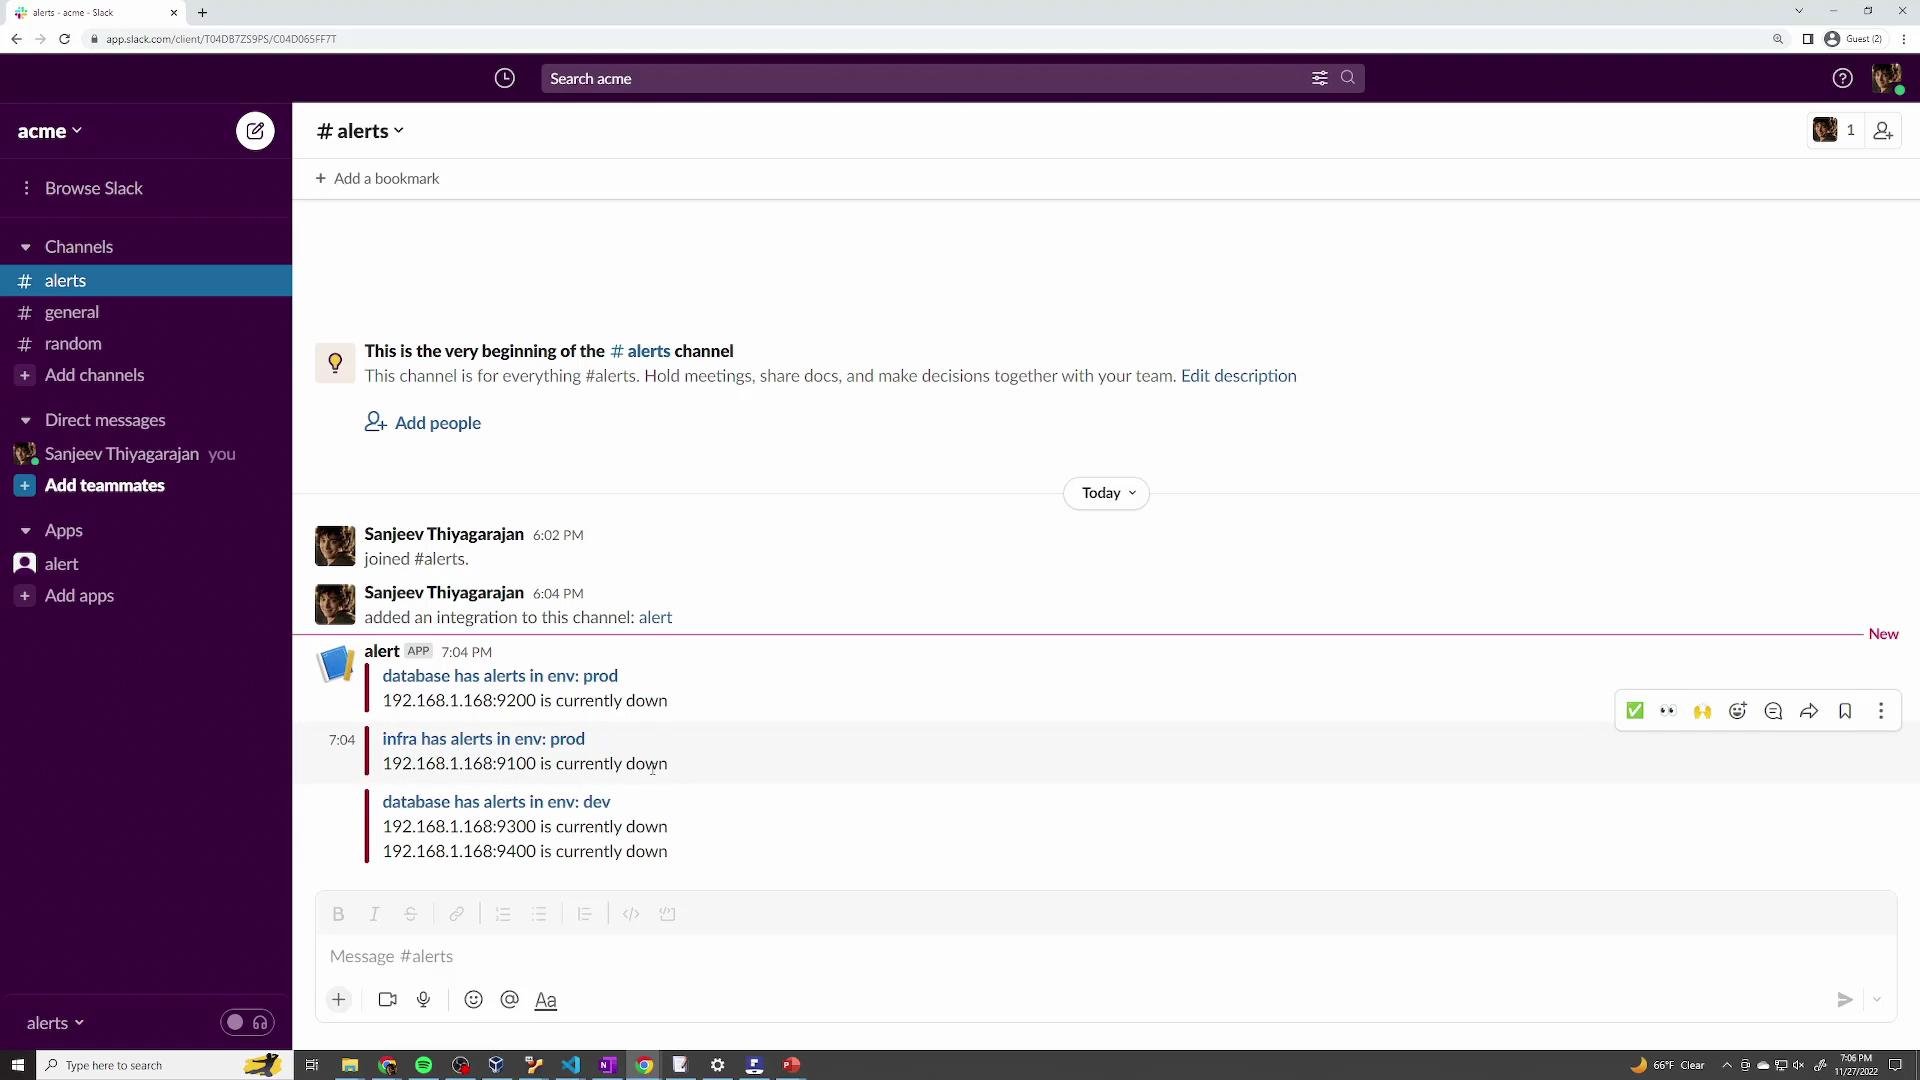
If the Slack webhook and channel are configured correctly, Alertmanager will post grouped messages to the specified Slack channel. Example formatted messages for this demo:
```text theme={null}
database has alerts in env: prod
192.168.1.168:9200 is currently down
infra has alerts in env: prod
192.168.1.168:9100 is currently down
database has alerts in env: dev
192.168.1.168:9300 is currently down
192.168.1.168:9400 is currently down
```
You should see the Slack channel showing these notifications:
## Verify Slack notifications
If the Slack webhook and channel are configured correctly, Alertmanager will post grouped messages to the specified Slack channel. Example formatted messages for this demo:
```text theme={null}
database has alerts in env: prod
192.168.1.168:9200 is currently down
infra has alerts in env: prod
192.168.1.168:9100 is currently down
database has alerts in env: dev
192.168.1.168:9300 is currently down
192.168.1.168:9400 is currently down
```
You should see the Slack channel showing these notifications:
 ## Final notes and links
* The same routing/grouping concepts apply to other integrations such as PagerDuty or Microsoft Teams; replace `slack_configs` with the appropriate receiver config.
* Validate Alertmanager config before deploying changes; for complex templates test in a staging environment first.
* Use labels consistently across rules and targets (e.g., `team`, `env`, `job`) to simplify grouping and routing.
Helpful references:
* Prometheus docs: [https://prometheus.io/docs/](https://prometheus.io/docs/)
* Alertmanager docs: [https://prometheus.io/docs/alerting/latest/alertmanager/](https://prometheus.io/docs/alerting/latest/alertmanager/)
* Slack incoming webhooks: [https://api.slack.com/messaging/webhooks](https://api.slack.com/messaging/webhooks)
* PagerDuty + Prometheus: [https://support.pagerduty.com/docs/prometheus](https://support.pagerduty.com/docs/prometheus)
* Microsoft Teams webhooks: [https://learn.microsoft.com/microsoftteams/platform/webhooks-and-connectors/how-to/add-incoming-webhook](https://learn.microsoft.com/microsoftteams/platform/webhooks-and-connectors/how-to/add-incoming-webhook)
## Final notes and links
* The same routing/grouping concepts apply to other integrations such as PagerDuty or Microsoft Teams; replace `slack_configs` with the appropriate receiver config.
* Validate Alertmanager config before deploying changes; for complex templates test in a staging environment first.
* Use labels consistently across rules and targets (e.g., `team`, `env`, `job`) to simplify grouping and routing.
Helpful references:
* Prometheus docs: [https://prometheus.io/docs/](https://prometheus.io/docs/)
* Alertmanager docs: [https://prometheus.io/docs/alerting/latest/alertmanager/](https://prometheus.io/docs/alerting/latest/alertmanager/)
* Slack incoming webhooks: [https://api.slack.com/messaging/webhooks](https://api.slack.com/messaging/webhooks)
* PagerDuty + Prometheus: [https://support.pagerduty.com/docs/prometheus](https://support.pagerduty.com/docs/prometheus)
* Microsoft Teams webhooks: [https://learn.microsoft.com/microsoftteams/platform/webhooks-and-connectors/how-to/add-incoming-webhook](https://learn.microsoft.com/microsoftteams/platform/webhooks-and-connectors/how-to/add-incoming-webhook)