> ## Documentation Index
> Fetch the complete documentation index at: https://notes.kodekloud.com/llms.txt
> Use this file to discover all available pages before exploring further.
# Introduction
> Explains Prometheus alerting using PromQL, alert rule structure, lifecycle states, and Alertmanager's role in grouping routing and delivering notifications.
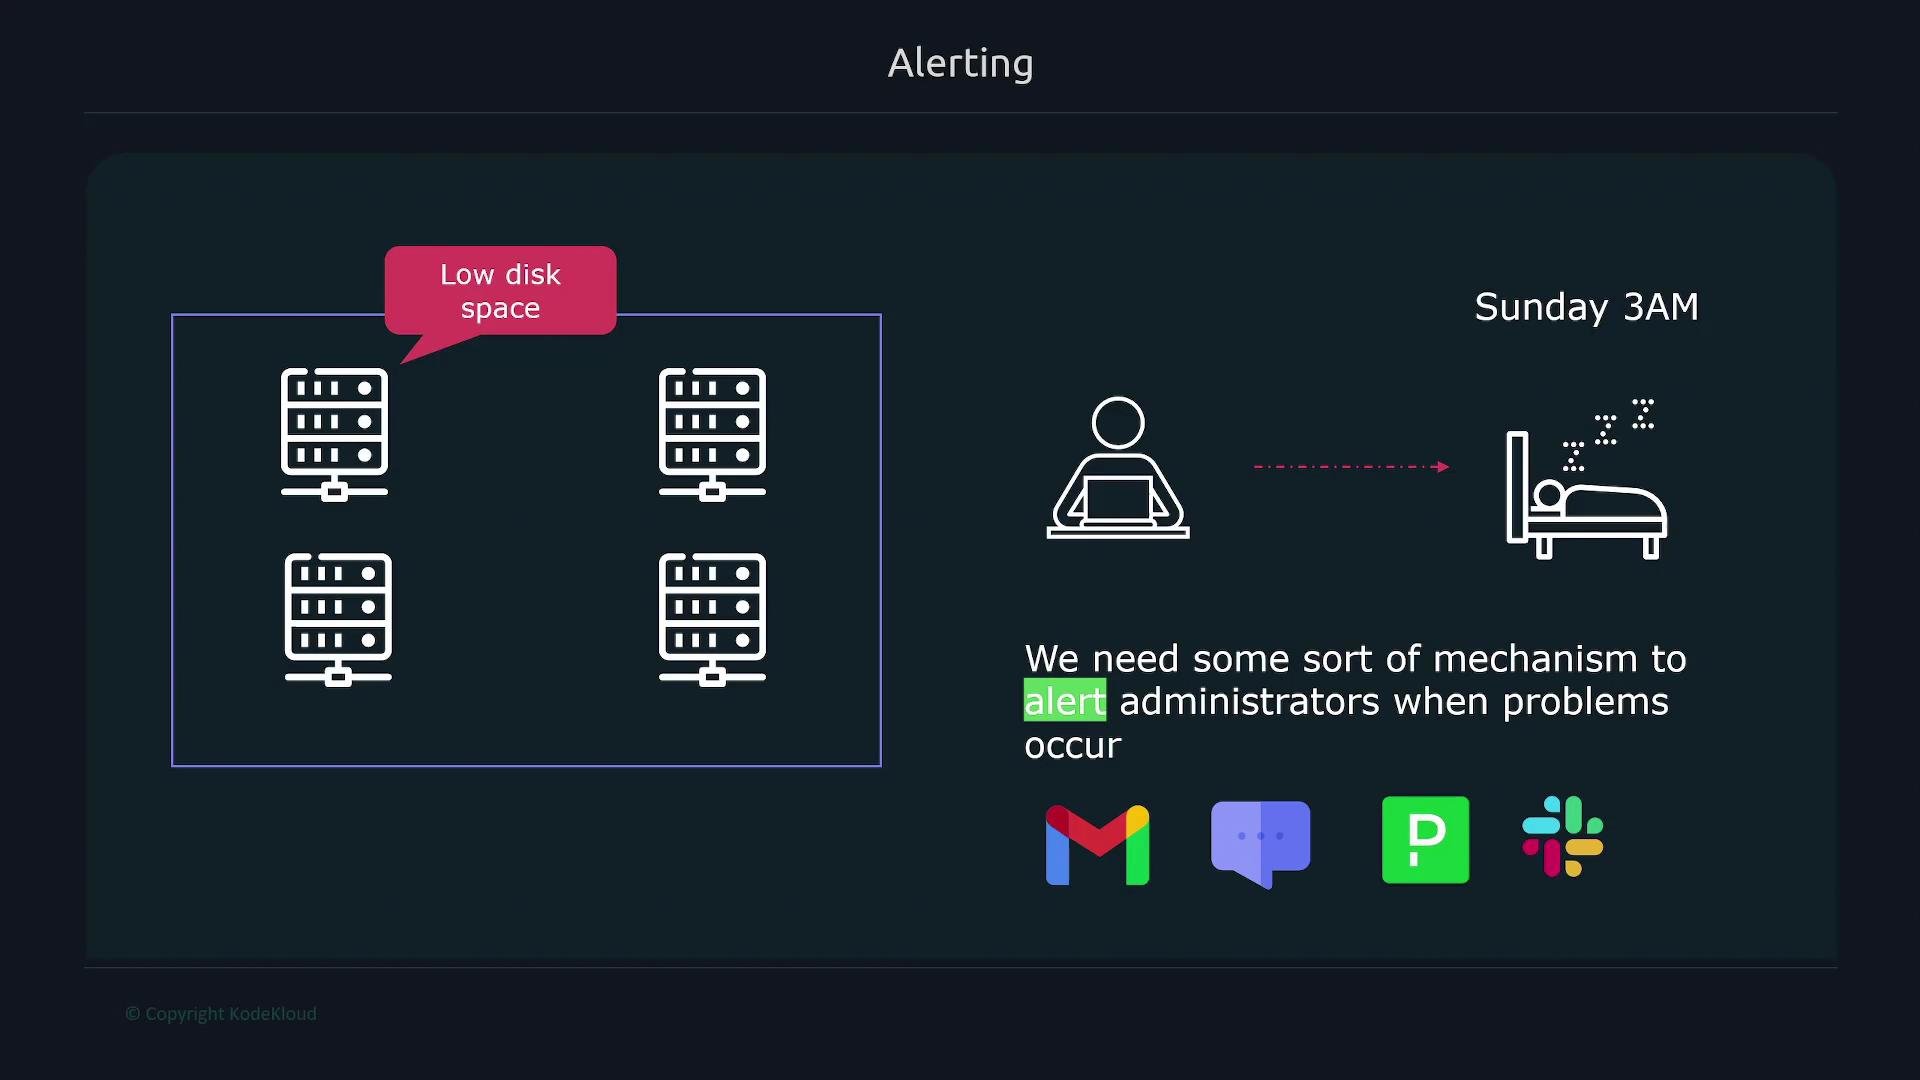
In this lesson we'll cover Prometheus alerting: how to define alerting conditions with PromQL, how Prometheus generates alerts, and how Alertmanager handles routing and notifications. Alerting is critical for production systems — it ensures teams are notified of issues (disk full, node down, high latency) even when nobody is actively watching dashboards.
 Prometheus alerting works by evaluating PromQL expressions. When an expression returns one or more vectors, Prometheus generates an alert instance for each matching timeseries.
Example: alert when a filesystem has less than 1000 bytes available:
```promql theme={null}
node_filesystem_avail_bytes < 1000
```
If this query returns a vector such as:
```promql theme={null}
node_filesystem_avail_bytes{device="tmpfs", instance="node1", mountpoint="/run/lock"} 547
```
Prometheus creates one alert instance for that filesystem (because it has only 547 bytes available). If the query returns multiple vectors, each matching timeseries becomes a separate alert instance:
```promql theme={null}
# First query result
node_filesystem_avail_bytes{device="tmpfs", instance="node1", mountpoint="/run/lock"} 547
# A broader query returning two results
node_filesystem_avail_bytes < 2000
# returns:
node_filesystem_avail_bytes{device="tmpfs", instance="node1", mountpoint="/run/lock"} 547
node_filesystem_avail_bytes{device="/dev/sda2", instance="node1", mountpoint="/"} 1228
```
The second query produces two results, so Prometheus would produce two alert instances — one per filesystem.
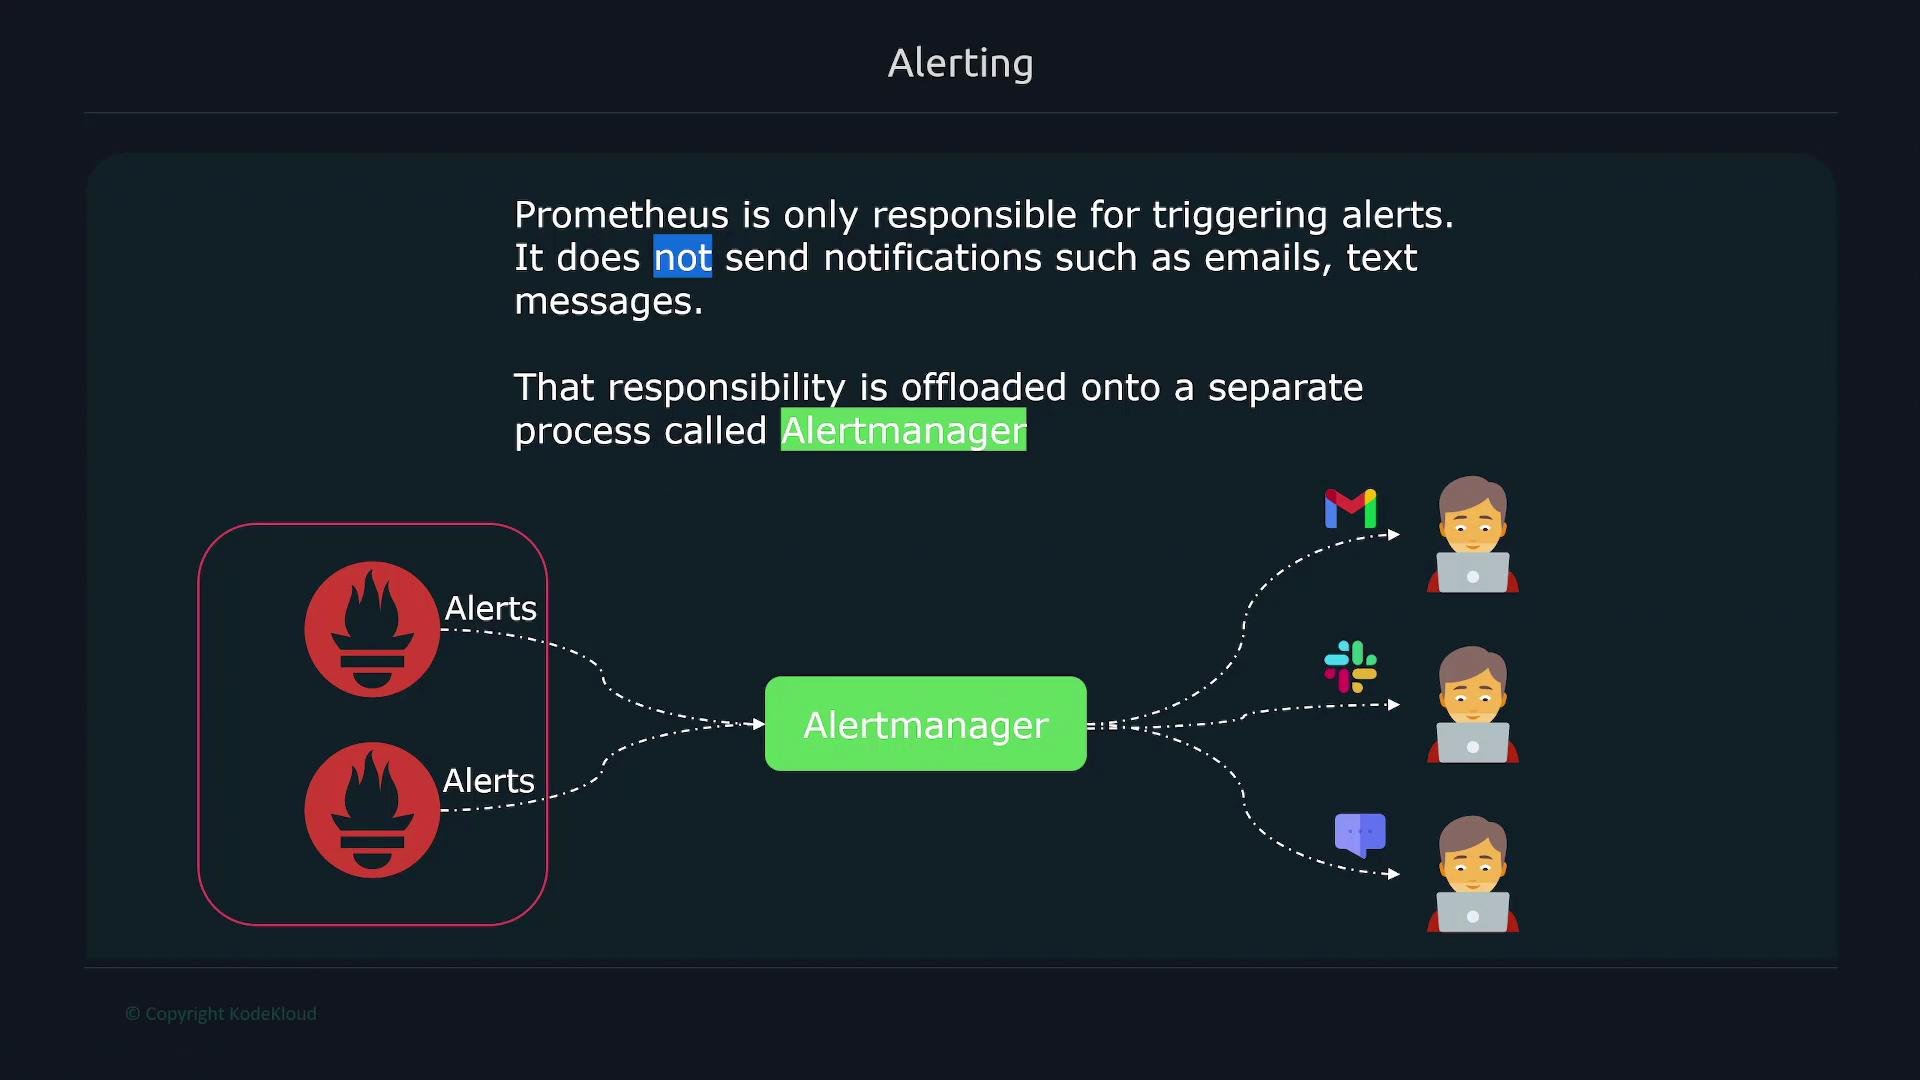
Prometheus evaluates alert expressions and generates alert instances, but it does not deliver notifications (email, SMS, Slack). That responsibility belongs to Alertmanager, which receives alerts from Prometheus and handles deduplication, grouping, silencing, and routing to external channels.
Prometheus alerting works by evaluating PromQL expressions. When an expression returns one or more vectors, Prometheus generates an alert instance for each matching timeseries.
Example: alert when a filesystem has less than 1000 bytes available:
```promql theme={null}
node_filesystem_avail_bytes < 1000
```
If this query returns a vector such as:
```promql theme={null}
node_filesystem_avail_bytes{device="tmpfs", instance="node1", mountpoint="/run/lock"} 547
```
Prometheus creates one alert instance for that filesystem (because it has only 547 bytes available). If the query returns multiple vectors, each matching timeseries becomes a separate alert instance:
```promql theme={null}
# First query result
node_filesystem_avail_bytes{device="tmpfs", instance="node1", mountpoint="/run/lock"} 547
# A broader query returning two results
node_filesystem_avail_bytes < 2000
# returns:
node_filesystem_avail_bytes{device="tmpfs", instance="node1", mountpoint="/run/lock"} 547
node_filesystem_avail_bytes{device="/dev/sda2", instance="node1", mountpoint="/"} 1228
```
The second query produces two results, so Prometheus would produce two alert instances — one per filesystem.
Prometheus evaluates alert expressions and generates alert instances, but it does not deliver notifications (email, SMS, Slack). That responsibility belongs to Alertmanager, which receives alerts from Prometheus and handles deduplication, grouping, silencing, and routing to external channels.
 ## Alert rules and rule files
Alert rules are defined in the same rule format as recording rules. The main difference is the presence of the `alert` key for alerting rules, while recording rules use `record`. Both rule types can live in the same rule group.
Example rule group containing a recording rule and an alert:
```yaml theme={null}
groups:
- name: node
interval: 15s
rules:
- record: node_memory_memFree_percent
expr: 100 * node_memory_MemFree_bytes{job="node"} / node_memory_MemTotal_bytes{job="node"}
- alert: LowMemory
expr: node_memory_memFree_percent < 20
for: 3m
```
In this example:
* `node_memory_memFree_percent` is a recording rule used to precompute a metric.
* `LowMemory` is an alert that fires when `node_memory_memFree_percent < 20` has held true for 3 minutes.
Another common alert is detecting targets that are down. The `up` metric returns 0 for unreachable targets:
```yaml theme={null}
groups:
- name: node
rules:
- alert: NodeDown
expr: up{job="node"} == 0
for: 5m
```
The `for` clause delays the alert transition to firing until the expression has been true for the given duration. This prevents alerts from firing on transient scrape failures or brief network blips.
Use `for` to avoid false positives for sustained conditions (e.g., sustained high CPU). For extremely urgent conditions (e.g., data corruption, loss of control plane) keep `for` short or omit it to allow faster notifications.
## Example alerts file
Prometheus reads rule files (commonly placed under `/etc/prometheus/rules.yml` or a rules directory). Example snippet:
```yaml theme={null}
groups:
- name: node
rules:
- alert: LowMemory
expr: node_memory_memFree_percent{job="node"} < 20
for: 3m
- alert: NodeDown
expr: up{job="node"} == 0
for: 3m
```
When you open the Alerts tab in the Prometheus UI you'll see these alerts and their current states.
## Alert lifecycle and states
Prometheus alerts go through three states:
| State | Description |
| -------- | --------------------------------------------------------------------------------------------------------- |
| Inactive | The expression returns no results (condition not present). |
| Pending | The expression returned results but the `for` duration has not yet elapsed; alert is awaiting transition. |
| Firing | The expression has been true for at least the `for` duration; Prometheus sends the alert to Alertmanager. |
## Quick reference: alert rule fields
| Field | Purpose | Example |
| ------------- | --------------------------------------------------------- | ---------------------------------------------- |
| `alert` | Name of the alert | `LowMemory` |
| `expr` | PromQL expression that defines the alert condition | `node_memory_memFree_percent{job="node"} < 20` |
| `for` | Delay before alert becomes `firing` | `3m` |
| `labels` | Add or override labels for the alert instance | `severity: "critical"` |
| `annotations` | Human-readable information shown in UIs and notifications | `summary: "Node memory low"` |
## Putting it together: Prometheus + Alertmanager
* Prometheus evaluates alerting rules and creates alert instances when expressions match timeseries.
* Prometheus sends alerts to one or more Alertmanager instances.
* Alertmanager handles deduplication, grouping, silencing, and routing notifications to integrations such as email, Slack, PagerDuty, or webhooks.
* A single Alertmanager can receive alerts from multiple Prometheus servers across environments.
This separation of concerns creates a reliable alerting pipeline: Prometheus for evaluation, Alertmanager for delivery and routing.
## Links and references
* [Prometheus Alerting Rules](https://prometheus.io/docs/prometheus/latest/configuration/alerting_rules/)
* [Alertmanager Documentation](https://prometheus.io/docs/alerting/latest/alertmanager/)
* [PromQL Basics](https://prometheus.io/docs/prometheus/latest/querying/basics/)
## Alert rules and rule files
Alert rules are defined in the same rule format as recording rules. The main difference is the presence of the `alert` key for alerting rules, while recording rules use `record`. Both rule types can live in the same rule group.
Example rule group containing a recording rule and an alert:
```yaml theme={null}
groups:
- name: node
interval: 15s
rules:
- record: node_memory_memFree_percent
expr: 100 * node_memory_MemFree_bytes{job="node"} / node_memory_MemTotal_bytes{job="node"}
- alert: LowMemory
expr: node_memory_memFree_percent < 20
for: 3m
```
In this example:
* `node_memory_memFree_percent` is a recording rule used to precompute a metric.
* `LowMemory` is an alert that fires when `node_memory_memFree_percent < 20` has held true for 3 minutes.
Another common alert is detecting targets that are down. The `up` metric returns 0 for unreachable targets:
```yaml theme={null}
groups:
- name: node
rules:
- alert: NodeDown
expr: up{job="node"} == 0
for: 5m
```
The `for` clause delays the alert transition to firing until the expression has been true for the given duration. This prevents alerts from firing on transient scrape failures or brief network blips.
Use `for` to avoid false positives for sustained conditions (e.g., sustained high CPU). For extremely urgent conditions (e.g., data corruption, loss of control plane) keep `for` short or omit it to allow faster notifications.
## Example alerts file
Prometheus reads rule files (commonly placed under `/etc/prometheus/rules.yml` or a rules directory). Example snippet:
```yaml theme={null}
groups:
- name: node
rules:
- alert: LowMemory
expr: node_memory_memFree_percent{job="node"} < 20
for: 3m
- alert: NodeDown
expr: up{job="node"} == 0
for: 3m
```
When you open the Alerts tab in the Prometheus UI you'll see these alerts and their current states.
## Alert lifecycle and states
Prometheus alerts go through three states:
| State | Description |
| -------- | --------------------------------------------------------------------------------------------------------- |
| Inactive | The expression returns no results (condition not present). |
| Pending | The expression returned results but the `for` duration has not yet elapsed; alert is awaiting transition. |
| Firing | The expression has been true for at least the `for` duration; Prometheus sends the alert to Alertmanager. |
## Quick reference: alert rule fields
| Field | Purpose | Example |
| ------------- | --------------------------------------------------------- | ---------------------------------------------- |
| `alert` | Name of the alert | `LowMemory` |
| `expr` | PromQL expression that defines the alert condition | `node_memory_memFree_percent{job="node"} < 20` |
| `for` | Delay before alert becomes `firing` | `3m` |
| `labels` | Add or override labels for the alert instance | `severity: "critical"` |
| `annotations` | Human-readable information shown in UIs and notifications | `summary: "Node memory low"` |
## Putting it together: Prometheus + Alertmanager
* Prometheus evaluates alerting rules and creates alert instances when expressions match timeseries.
* Prometheus sends alerts to one or more Alertmanager instances.
* Alertmanager handles deduplication, grouping, silencing, and routing notifications to integrations such as email, Slack, PagerDuty, or webhooks.
* A single Alertmanager can receive alerts from multiple Prometheus servers across environments.
This separation of concerns creates a reliable alerting pipeline: Prometheus for evaluation, Alertmanager for delivery and routing.
## Links and references
* [Prometheus Alerting Rules](https://prometheus.io/docs/prometheus/latest/configuration/alerting_rules/)
* [Alertmanager Documentation](https://prometheus.io/docs/alerting/latest/alertmanager/)
* [PromQL Basics](https://prometheus.io/docs/prometheus/latest/querying/basics/)