> ## Documentation Index
> Fetch the complete documentation index at: https://notes.kodekloud.com/llms.txt
> Use this file to discover all available pages before exploring further.
# Best Practice
> Best practices for naming and instrumenting metrics for Prometheus, covering naming conventions, units, suffixes, and instrumentation guidance for online, offline, and batch systems.
In this lesson we'll cover best practices for naming and instrumenting metrics so they are predictable, unambiguous, and easy to consume with Prometheus and other monitoring tools.
## Metric naming conventions
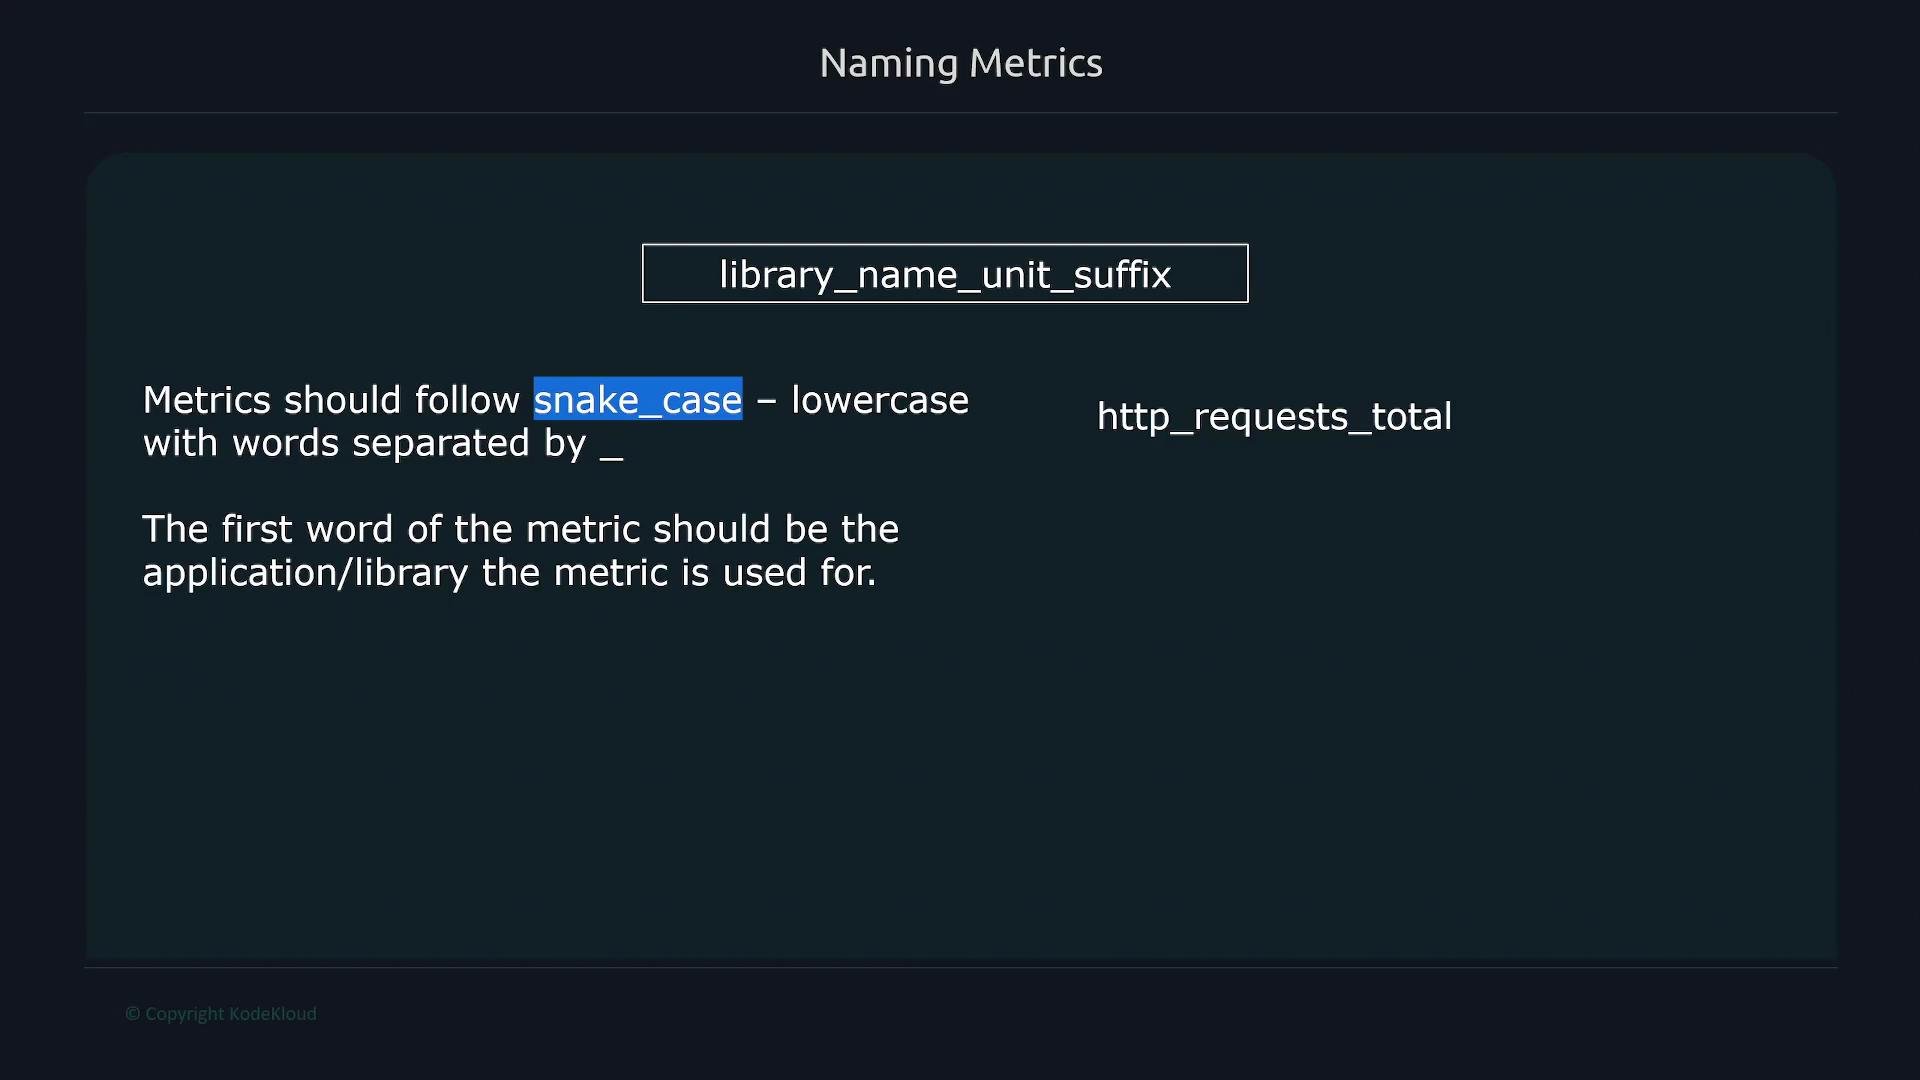
* Use snake\_case for metric names: lowercase words separated by underscores (for example `http_request_total`).
* Prefix metric names with the application or library name to indicate ownership (for example `postgres_` for Postgres-related metrics).
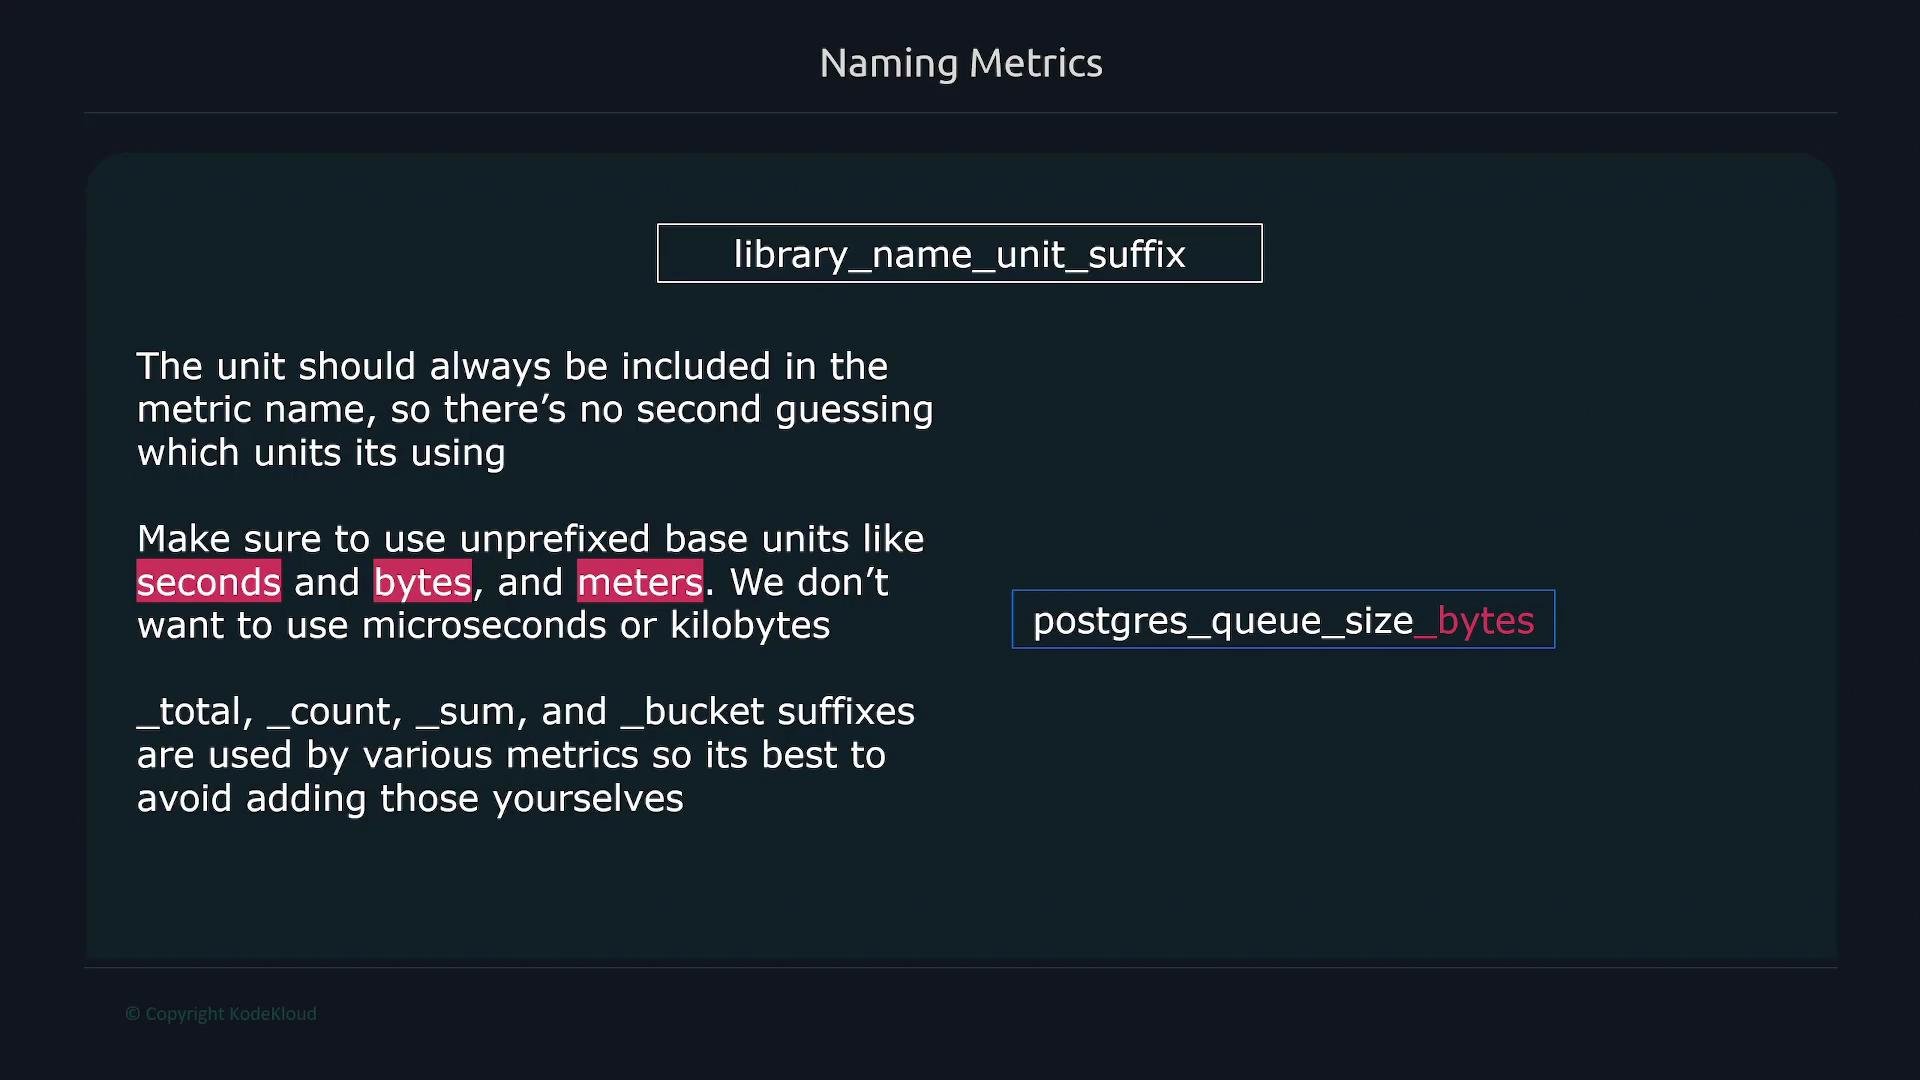
* Always include the unit in the metric name (use base units such as `seconds`, `bytes`, `meters`) rather than prefixed units (`milliseconds`, `kilobytes`).
* Rely on client libraries to produce type-specific suffixes. Counters should end with `_total`; do not manually add `_sum`, `_bucket`, or `_count` for histograms/summaries — client libraries export those.
 For example, metrics related to Postgres should begin with `postgres_`, e.g. `postgres_connection_errors`. After the prefix, use descriptive words (e.g., `queue_size`) and append the unit where applicable (e.g., `_seconds`, `_bytes`).
Units avoid ambiguity about scale (is latency in seconds or milliseconds?). Prometheus client libraries and conventions prefer base units (seconds, bytes).
For example, metrics related to Postgres should begin with `postgres_`, e.g. `postgres_connection_errors`. After the prefix, use descriptive words (e.g., `queue_size`) and append the unit where applicable (e.g., `_seconds`, `_bytes`).
Units avoid ambiguity about scale (is latency in seconds or milliseconds?). Prometheus client libraries and conventions prefer base units (seconds, bytes).
 Counters must end with `_total`. Do not manually add `_sum`, `_bucket`, or `_count` — those are created by client libraries for histogram/summary metric types.
Common recommended structure:
* `___`
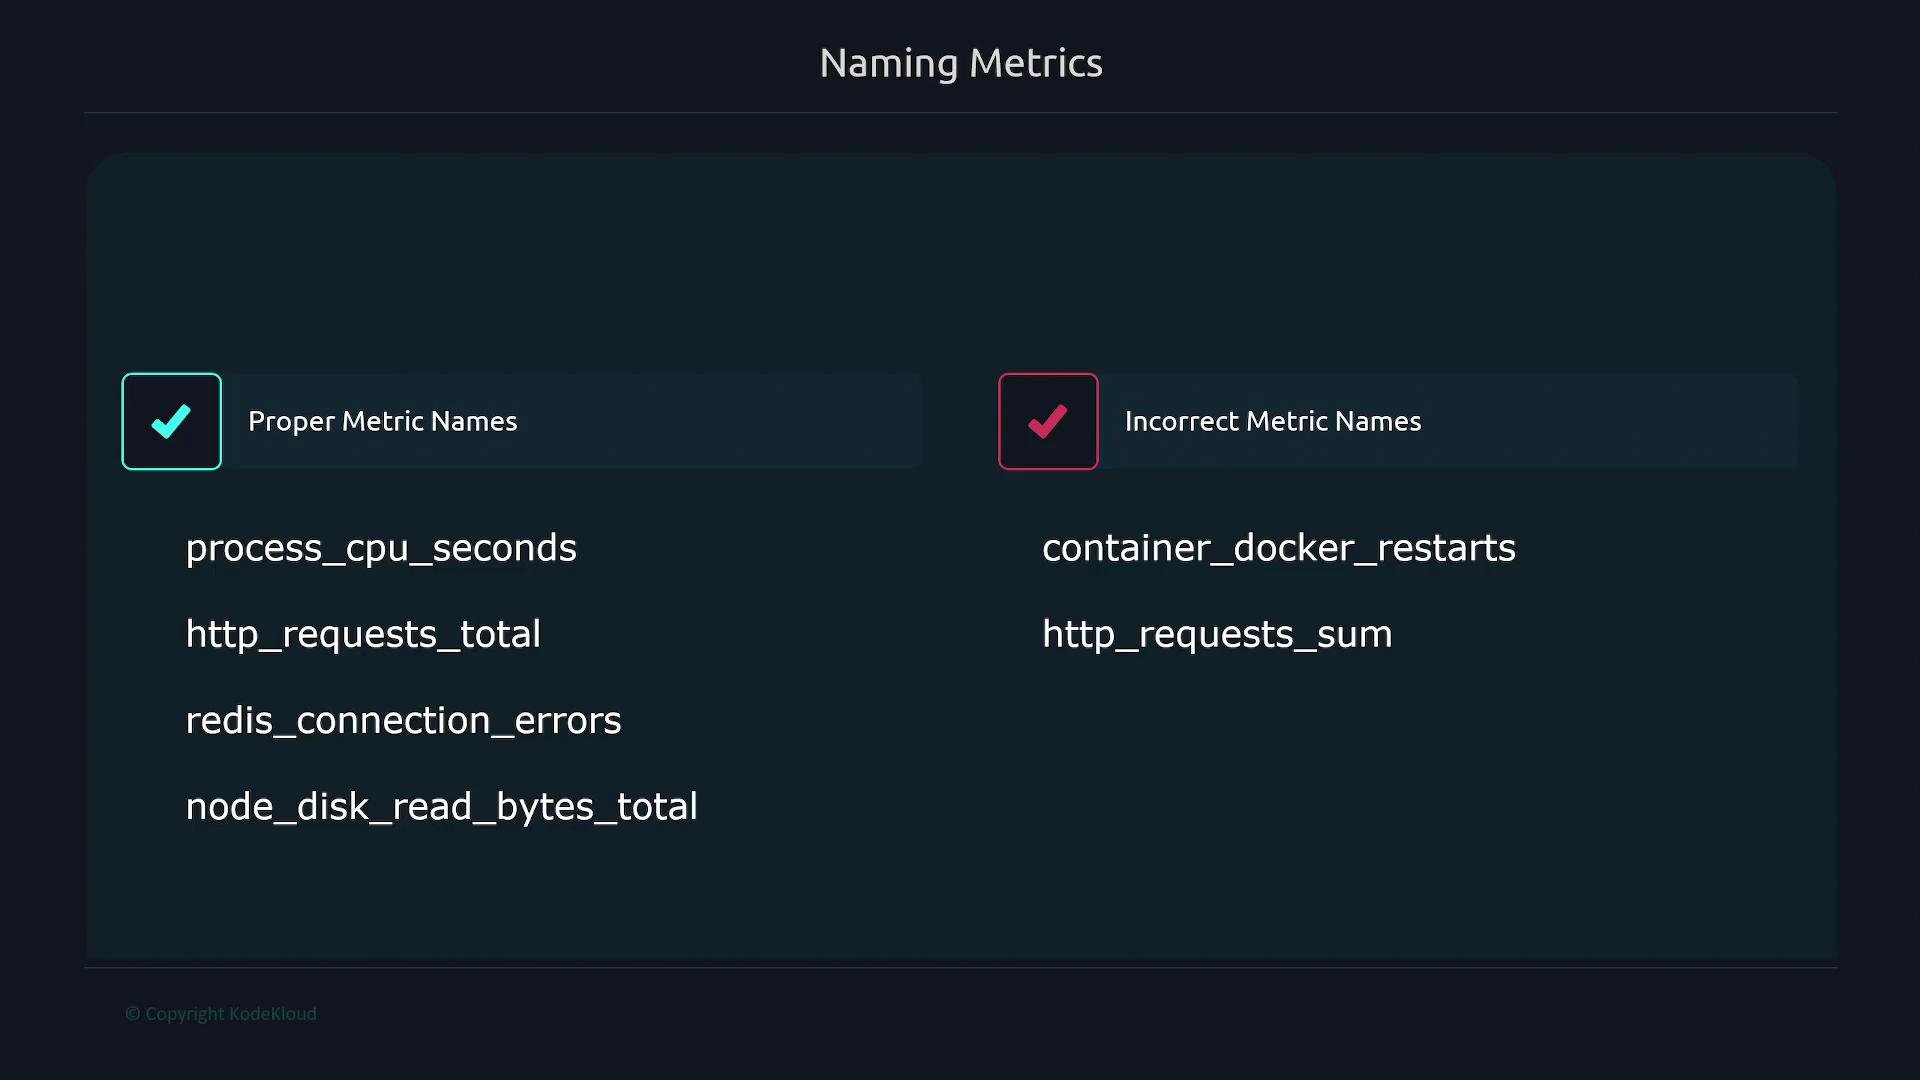
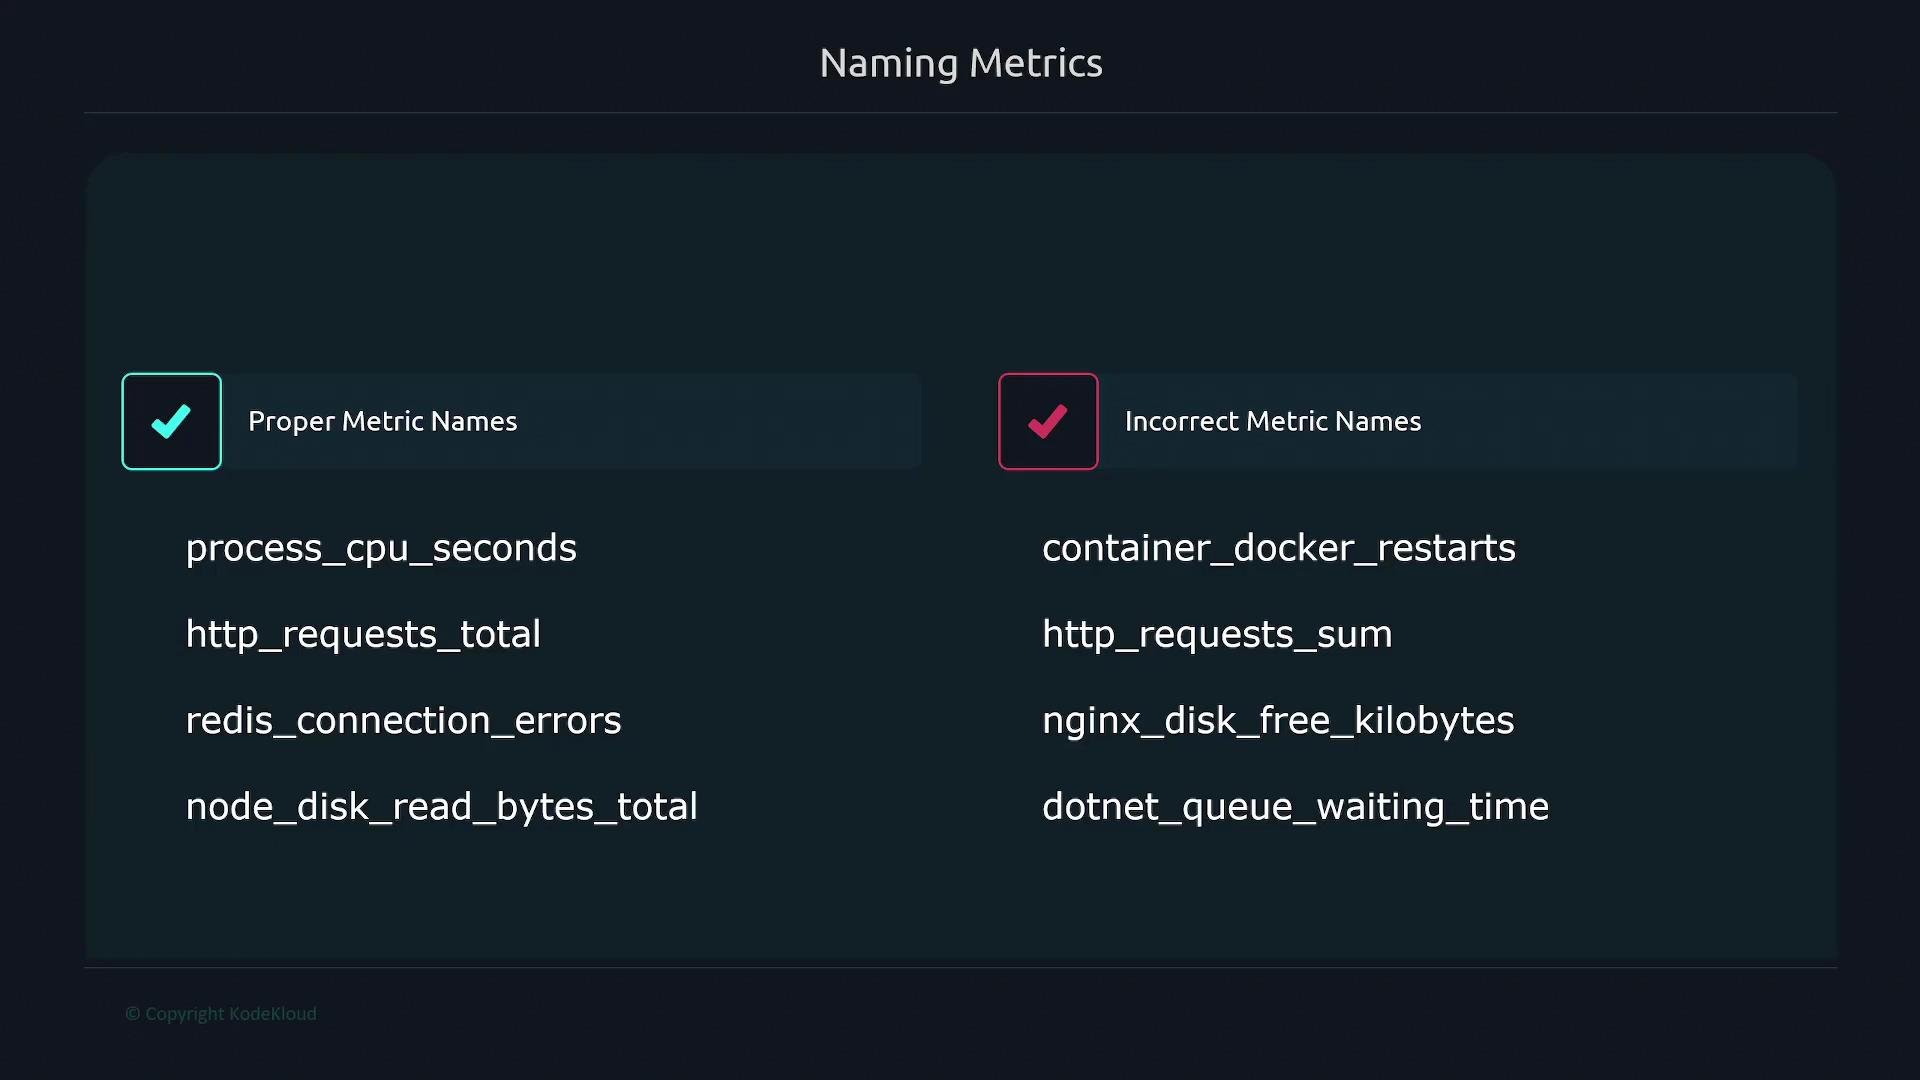
Good examples:
```text theme={null}
process_cpu_seconds
http_requests_total
redis_connection_errors
node_disk_read_bytes_total
```
Bad examples and why they are problematic:
```text theme={null}
container_docker_restarts # library should be 'docker' prefix: docker_container_restarts
http_requests_sum # don't put 'sum' in name — summaries/histograms export _sum automatically
nginx_disk_free_kilobytes # use base units: bytes, not kilobytes
dotnet_queue_waiting_time # missing units: append '_seconds'
```
Counters must end with `_total`. Do not manually add `_sum`, `_bucket`, or `_count` — those are created by client libraries for histogram/summary metric types.
Common recommended structure:
* `___`
Good examples:
```text theme={null}
process_cpu_seconds
http_requests_total
redis_connection_errors
node_disk_read_bytes_total
```
Bad examples and why they are problematic:
```text theme={null}
container_docker_restarts # library should be 'docker' prefix: docker_container_restarts
http_requests_sum # don't put 'sum' in name — summaries/histograms export _sum automatically
nginx_disk_free_kilobytes # use base units: bytes, not kilobytes
dotnet_queue_waiting_time # missing units: append '_seconds'
```
 ### Common suffixes and metric types
| Suffix | Metric type | Notes |
| --------- | ----------------- | ----------------------------------------------------------------------- |
| `_total` | Counter | Cumulative counter value. Use this for monotonically increasing counts. |
| `_count` | Histogram/Summary | Auto-generated by client libraries for count of observations. |
| `_sum` | Histogram/Summary | Auto-generated by client libraries for the sum of observed values. |
| `_bucket` | Histogram | Auto-generated by client libraries for histogram buckets. |
For more details on conventions, see the Prometheus best practices and instrumentation guides:
* [Prometheus documentation: Instrumentation](https://prometheus.io/docs/practices/instrumentation/)
* [Prometheus: Naming and labels](https://prometheus.io/docs/practices/naming/)
## What to instrument
Decide which metrics to collect based on the nature of your application. The three common categories and recommended metrics are:
### 1) Online serving systems
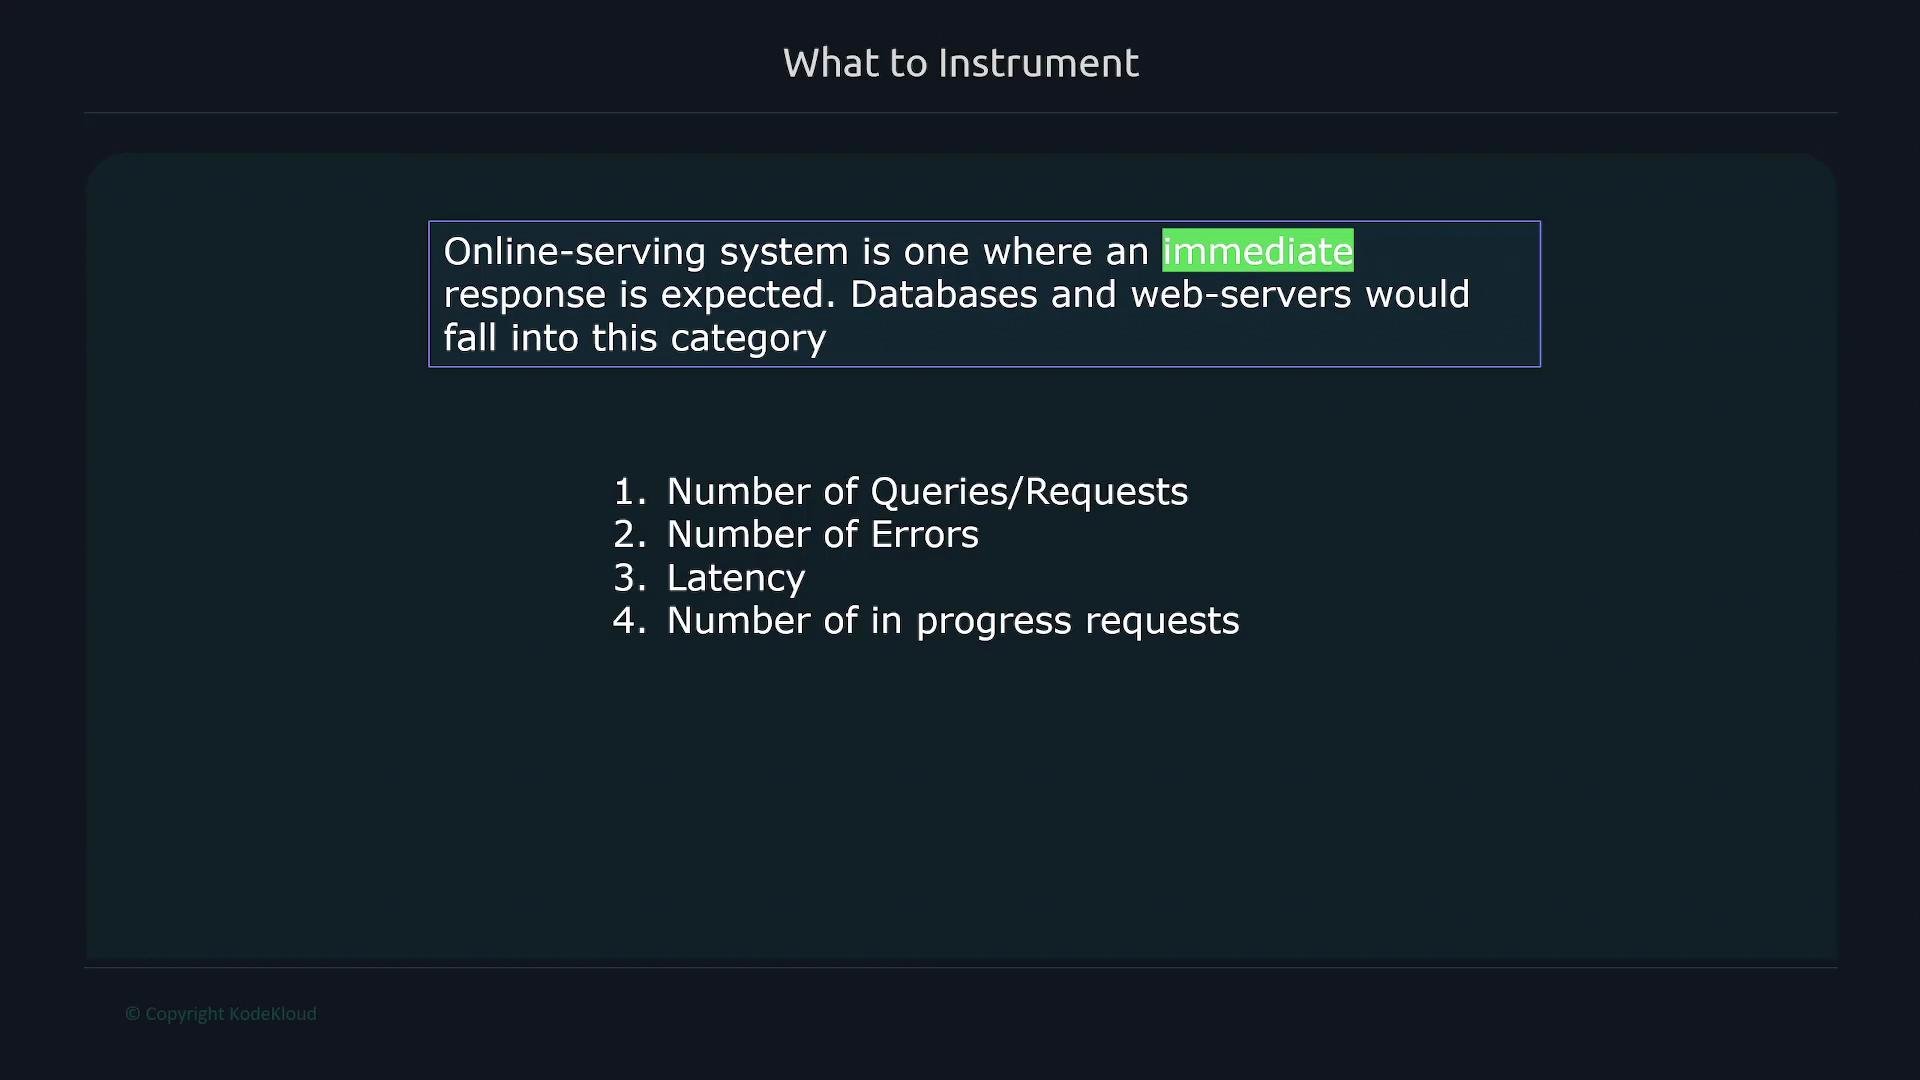
Online systems expect immediate responses (databases, web servers, APIs). Instrument the following:
* Total number of requests/queries (`*_total`)
* Error counts (`*_errors_total`)
* Request latency (`*_seconds`, often as histograms or summaries)
* Number of in-progress requests (gauge)
### Common suffixes and metric types
| Suffix | Metric type | Notes |
| --------- | ----------------- | ----------------------------------------------------------------------- |
| `_total` | Counter | Cumulative counter value. Use this for monotonically increasing counts. |
| `_count` | Histogram/Summary | Auto-generated by client libraries for count of observations. |
| `_sum` | Histogram/Summary | Auto-generated by client libraries for the sum of observed values. |
| `_bucket` | Histogram | Auto-generated by client libraries for histogram buckets. |
For more details on conventions, see the Prometheus best practices and instrumentation guides:
* [Prometheus documentation: Instrumentation](https://prometheus.io/docs/practices/instrumentation/)
* [Prometheus: Naming and labels](https://prometheus.io/docs/practices/naming/)
## What to instrument
Decide which metrics to collect based on the nature of your application. The three common categories and recommended metrics are:
### 1) Online serving systems
Online systems expect immediate responses (databases, web servers, APIs). Instrument the following:
* Total number of requests/queries (`*_total`)
* Error counts (`*_errors_total`)
* Request latency (`*_seconds`, often as histograms or summaries)
* Number of in-progress requests (gauge)
 Suggested metrics for an HTTP server:
```text theme={null}
http_requests_total
http_requests_duration_seconds_bucket # histogram buckets (auto-generated)
http_requests_inprogress # gauge
http_request_errors_total
```
### 2) Offline processing services
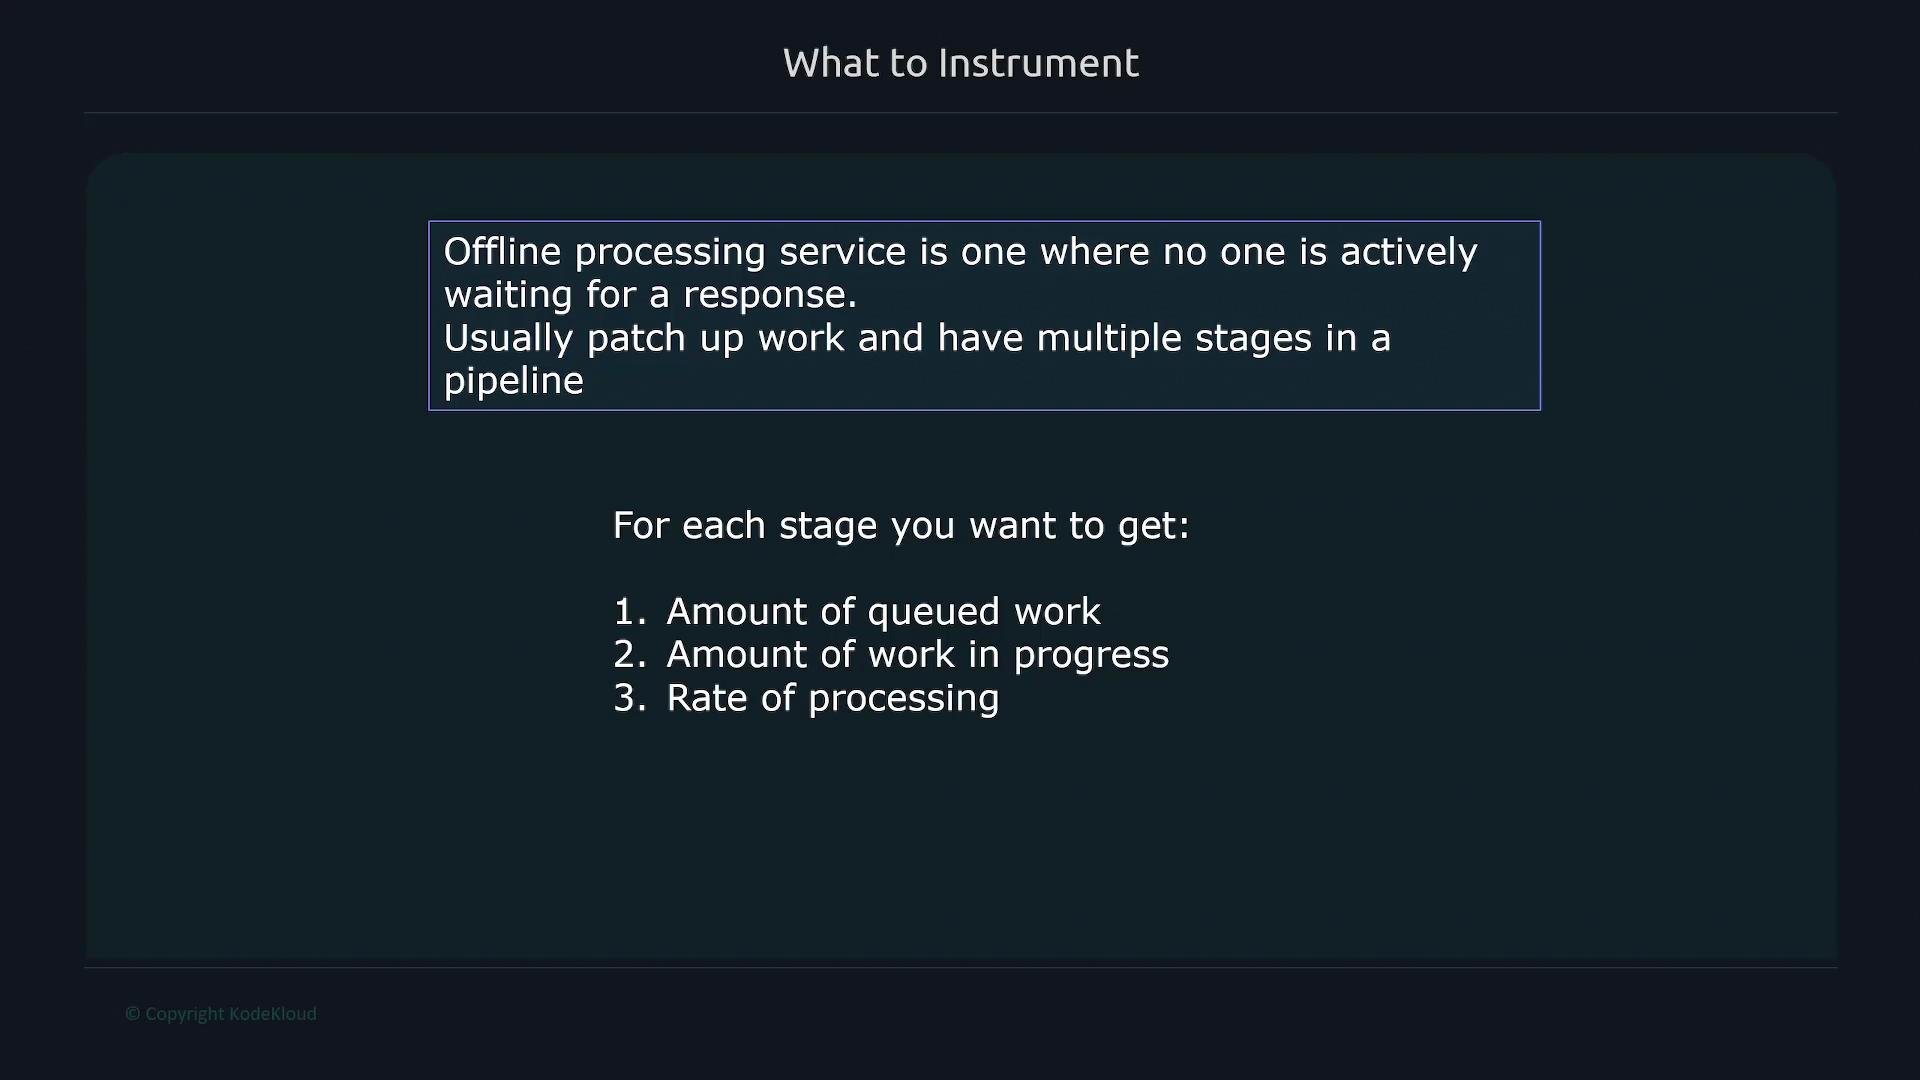
These are long-running background systems with multiple stages. Instrument per-stage and pipeline-level metrics:
* Amount of work processed (counter)
* Queue/backlog size (gauge)
* Work in progress (gauge)
* Processing rate (derived from counters)
* Errors per stage
Suggested metrics for an HTTP server:
```text theme={null}
http_requests_total
http_requests_duration_seconds_bucket # histogram buckets (auto-generated)
http_requests_inprogress # gauge
http_request_errors_total
```
### 2) Offline processing services
These are long-running background systems with multiple stages. Instrument per-stage and pipeline-level metrics:
* Amount of work processed (counter)
* Queue/backlog size (gauge)
* Work in progress (gauge)
* Processing rate (derived from counters)
* Errors per stage
 Example per-stage metrics:
```text theme={null}
worker_stage_items_processed_total
worker_stage_processing_seconds_sum
worker_stage_processing_seconds_count
worker_stage_queue_size
```
### 3) Batch jobs
Batch jobs run on a schedule and are often short-lived. Because Prometheus may not scrape short-lived processes, use a Pushgateway for job-level metrics that must be retained until scraped.
Instrument the following for batch jobs:
* Per-stage processing time (`_seconds`)
* Overall job runtime (`_seconds`)
* Success and failure counts (`myjob_success_total`, `myjob_failure_total`)
* Number of items processed (`*_processed_total`)
* Backlog/queued items before start
Example per-stage metrics:
```text theme={null}
worker_stage_items_processed_total
worker_stage_processing_seconds_sum
worker_stage_processing_seconds_count
worker_stage_queue_size
```
### 3) Batch jobs
Batch jobs run on a schedule and are often short-lived. Because Prometheus may not scrape short-lived processes, use a Pushgateway for job-level metrics that must be retained until scraped.
Instrument the following for batch jobs:
* Per-stage processing time (`_seconds`)
* Overall job runtime (`_seconds`)
* Success and failure counts (`myjob_success_total`, `myjob_failure_total`)
* Number of items processed (`*_processed_total`)
* Backlog/queued items before start
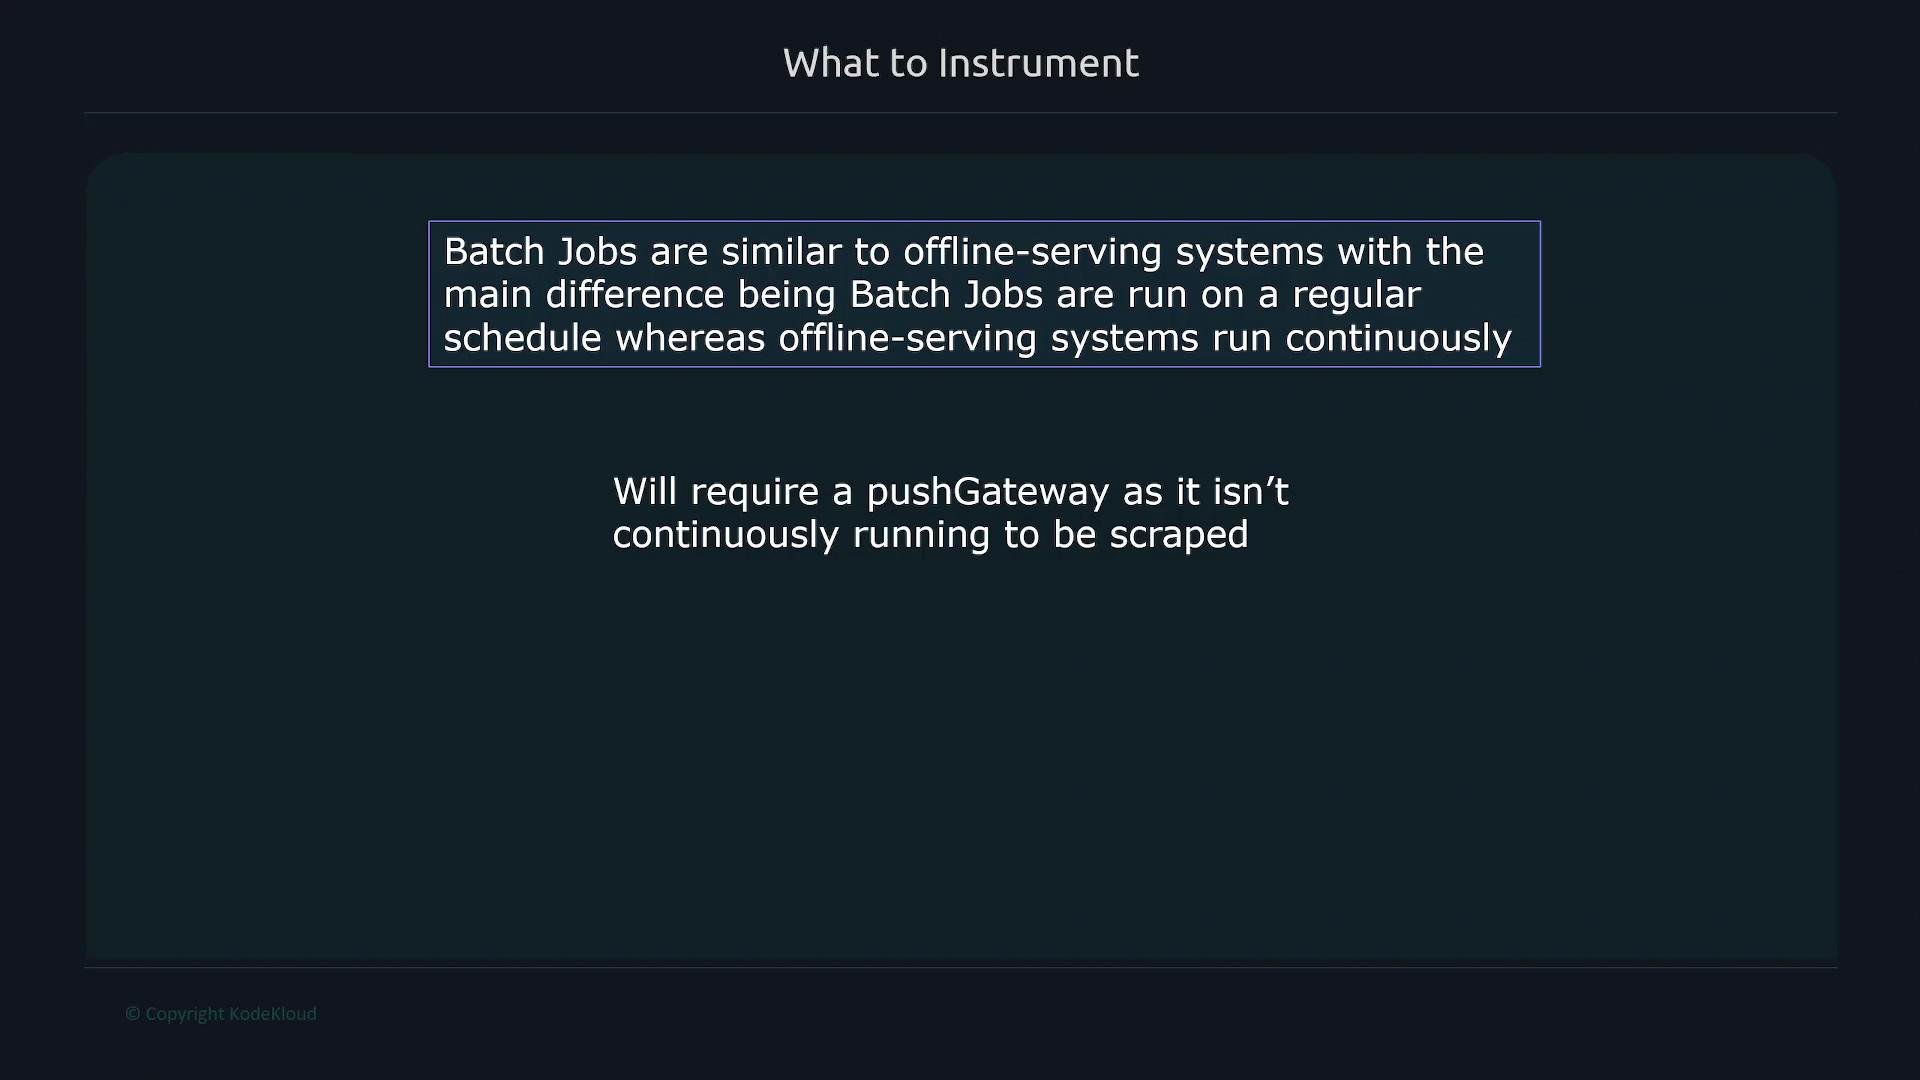 When using a Pushgateway, label pushed metrics clearly (e.g., `job` and instance identifier). Do not use the Pushgateway for ephemeral per-request metrics — it's intended for short-lived batch jobs and service-level metrics.
## Practical tips
* Keep metric names consistent across services to simplify querying and alerting.
* Use labels for dimensions (e.g., `method`, `status_code`, `region`) instead of encoding dimensions into metric names.
* Prefer histograms for latency distributions and counters for cumulative counts.
* Document your metrics (what they measure, units, and labels) so consumers and SREs can use them correctly.
## References
* [Prometheus: Instrumentation best practices](https://prometheus.io/docs/practices/instrumentation/)
* [Prometheus: Naming guidelines](https://prometheus.io/docs/practices/naming/)
When using a Pushgateway, label pushed metrics clearly (e.g., `job` and instance identifier). Do not use the Pushgateway for ephemeral per-request metrics — it's intended for short-lived batch jobs and service-level metrics.
## Practical tips
* Keep metric names consistent across services to simplify querying and alerting.
* Use labels for dimensions (e.g., `method`, `status_code`, `region`) instead of encoding dimensions into metric names.
* Prefer histograms for latency distributions and counters for cumulative counts.
* Document your metrics (what they measure, units, and labels) so consumers and SREs can use them correctly.
## References
* [Prometheus: Instrumentation best practices](https://prometheus.io/docs/practices/instrumentation/)
* [Prometheus: Naming guidelines](https://prometheus.io/docs/practices/naming/)