> ## Documentation Index
> Fetch the complete documentation index at: https://notes.kodekloud.com/llms.txt
> Use this file to discover all available pages before exploring further.
# Introduction
> Explains how to instrument applications with Prometheus client libraries, metric types, Python examples, exposing metrics endpoint and best practices for naming, labels, and latency measurement
We've already set up Prometheus to collect metrics from our infrastructure — from servers (Linux or Windows) to Docker containers and the Docker Engine. But to understand how your application behaves in production, you should instrument the application code itself so it can expose internal metrics (requests, latencies, errors, resource usage, etc.) in a format Prometheus can scrape.
This is the role of Prometheus client libraries.
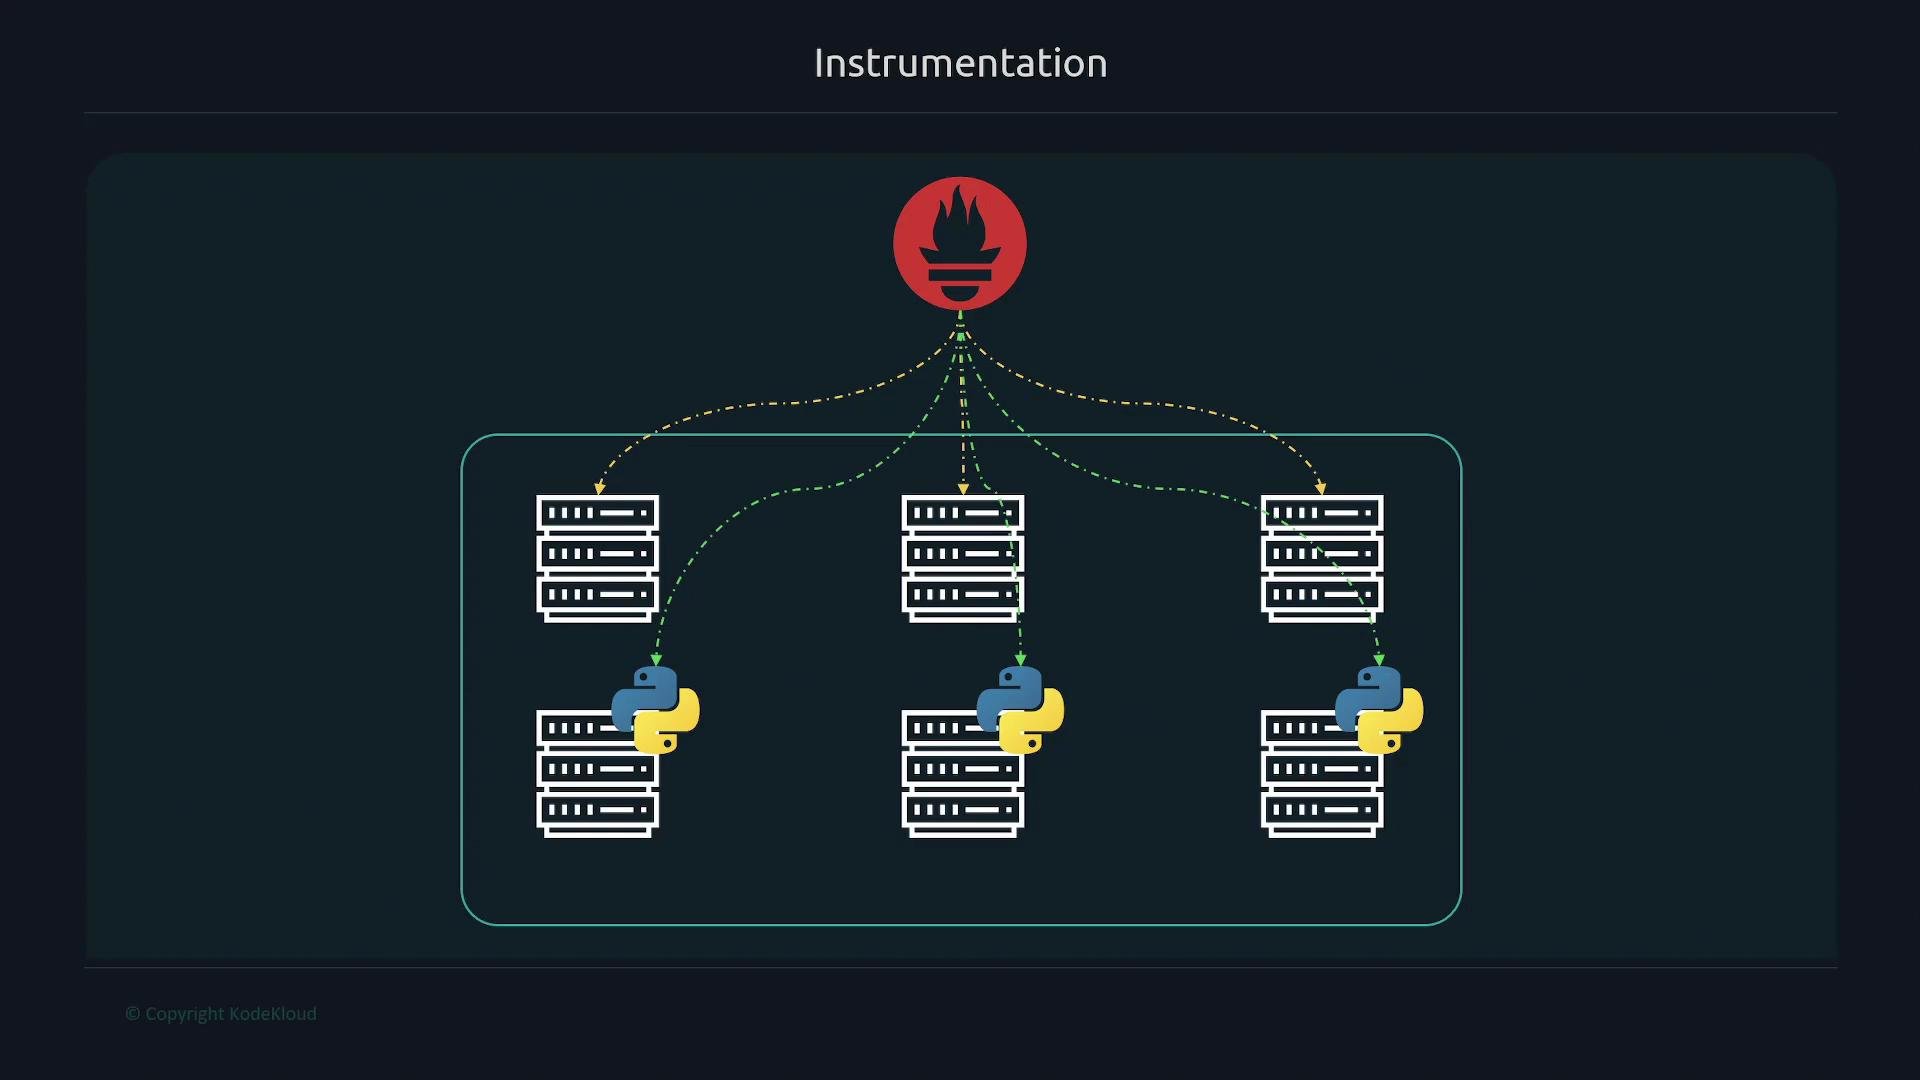 A Prometheus client library makes it straightforward to instrument application code so it produces metrics Prometheus understands. In practice, a client library performs two core functions:
* It provides metric types (counters, gauges, histograms, summaries) and APIs to record values from your code.
* It exposes those metrics in the Prometheus exposition format via an HTTP endpoint (commonly `GET /metrics`) so Prometheus can scrape them.
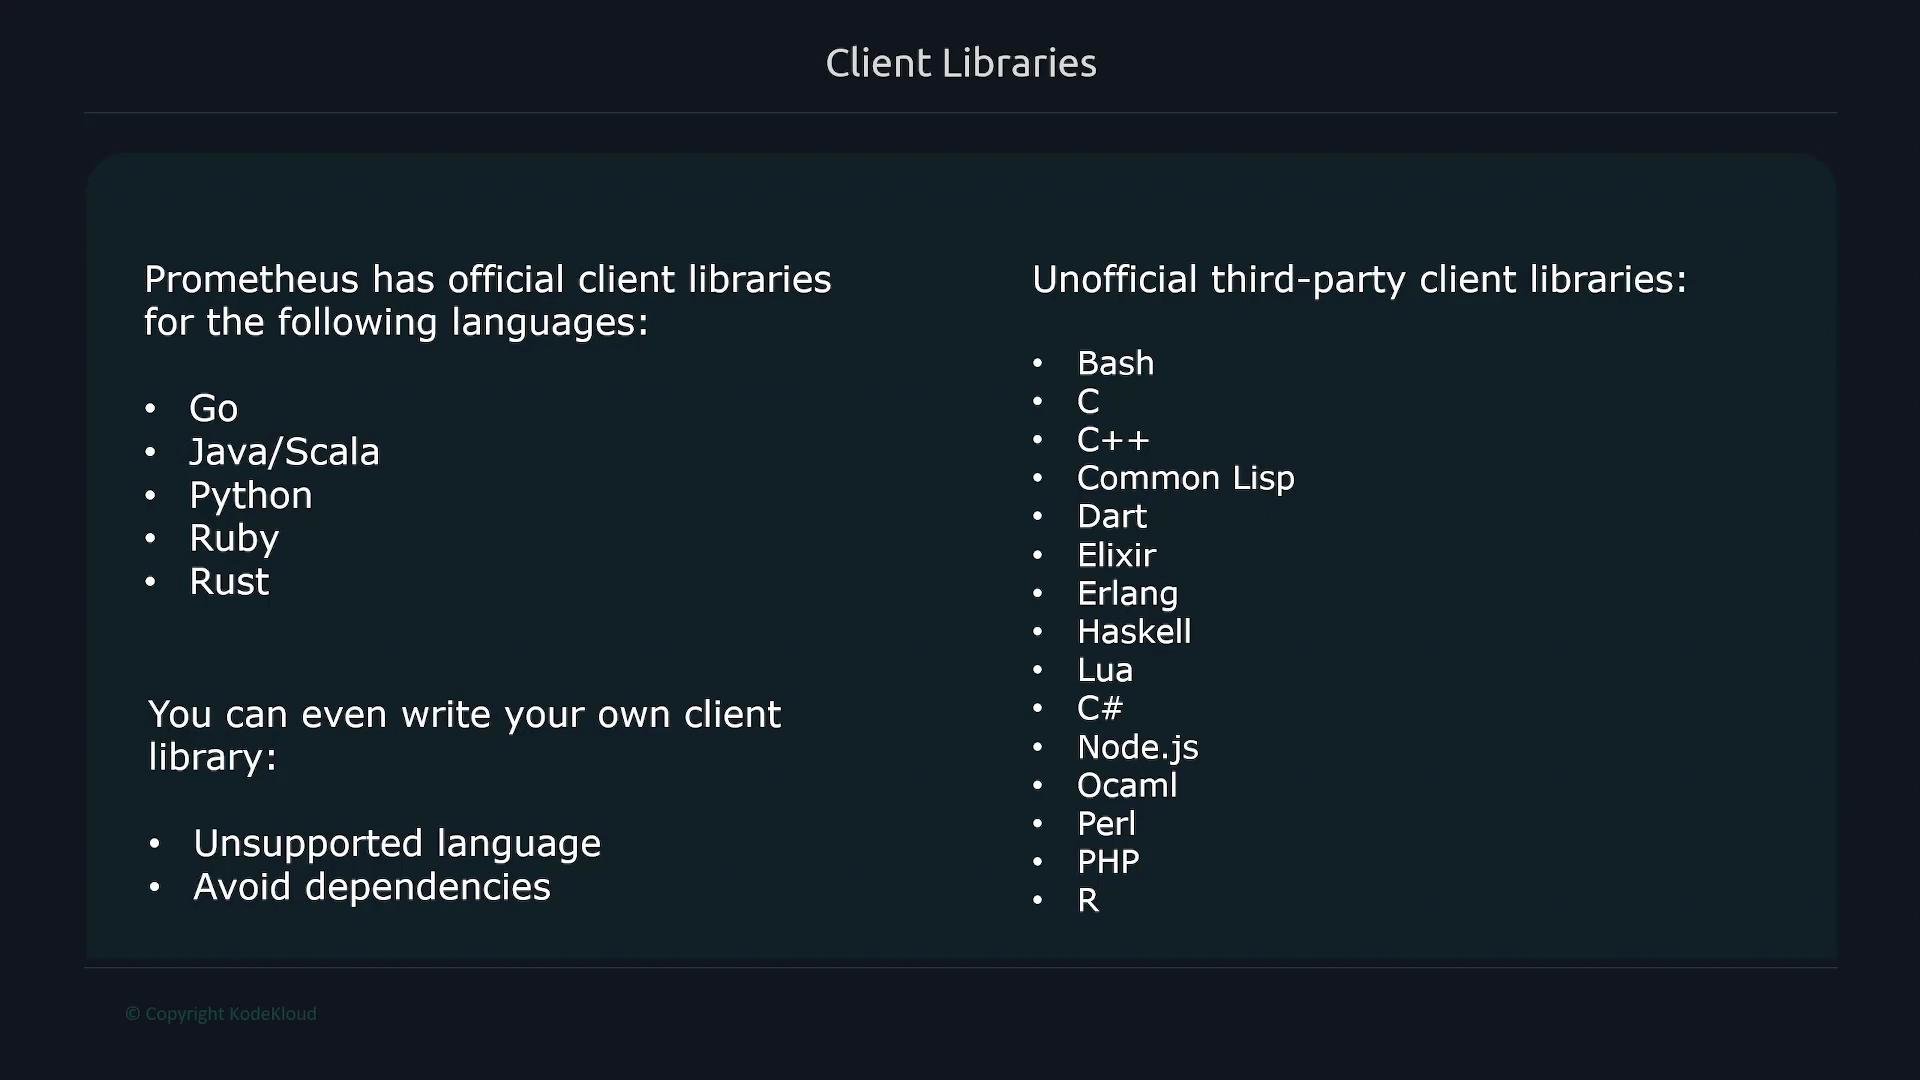
Prometheus maintains official client libraries for several widely used languages and many community libraries for other environments. If your language isn't supported or you want a lightweight integration, you can implement the exposition format yourself.
A Prometheus client library makes it straightforward to instrument application code so it produces metrics Prometheus understands. In practice, a client library performs two core functions:
* It provides metric types (counters, gauges, histograms, summaries) and APIs to record values from your code.
* It exposes those metrics in the Prometheus exposition format via an HTTP endpoint (commonly `GET /metrics`) so Prometheus can scrape them.
Prometheus maintains official client libraries for several widely used languages and many community libraries for other environments. If your language isn't supported or you want a lightweight integration, you can implement the exposition format yourself.
 Focus on what metrics you capture and how you expose them, not the specifics of the language. The concepts (counters, gauges, histograms/summaries, and the `/metrics` endpoint) apply across languages and frameworks.
In the sections below, we demonstrate how to instrument a Python-based API so you can track and expose essential application metrics. The concepts translate directly to other languages supported by Prometheus client libraries.
## Key Prometheus metric types
| Metric type | Purpose | Typical name example |
| ----------- | ---------------------------------------------------------------------------------------- | --------------------------------------- |
| Counter | Monotonically increasing value for counting events (e.g., requests served) | `myapp_requests_total` |
| Gauge | Value that can go up and down (e.g., concurrent sessions, memory usage) | `myapp_active_sessions` |
| Histogram | Buckets request/latency distributions for quantiles/percentiles and sum/count | `myapp_request_duration_seconds_bucket` |
| Summary | Directly observes quantiles for latency (client libraries may differ in recommended use) | `myapp_request_duration_seconds` |
## Quick Python instrumentation example
Below is a compact example showing common patterns when instrumenting a Python web API with the `prometheus_client` library:
* Define metrics (counter, gauge, histogram)
* Increment/observe metrics in your request handlers
* Expose metrics via an HTTP endpoint (e.g., `GET /metrics`) so Prometheus can scrape them
```python theme={null}
from prometheus_client import Counter, Gauge, Histogram, start_http_server
from time import sleep
from random import random
# Define metrics
REQUESTS = Counter('myapp_requests_total', 'Total HTTP requests')
IN_PROGRESS = Gauge('myapp_inprogress_requests', 'In-progress requests')
REQUEST_LATENCY = Histogram('myapp_request_duration_seconds', 'Request latency seconds')
# Start the metrics HTTP server on port 8000 (exposes /metrics)
start_http_server(8000)
def handle_request():
REQUESTS.inc()
IN_PROGRESS.inc()
with REQUEST_LATENCY.time():
# Simulate request processing
sleep(random() * 0.5)
IN_PROGRESS.dec()
if __name__ == '__main__':
while True:
handle_request()
sleep(0.1)
```
Notes:
* In web frameworks (Flask, FastAPI, Django), you typically attach middleware or decorators that update metrics around each request.
* For production, use an appropriate host/port and avoid exposing `/metrics` to the public internet; use network policies or authentication as needed.
## Best practices for application instrumentation
* Name metrics clearly and consistently: use lowercase, underscores, and include units where applicable (e.g., `_seconds`, `_bytes`).
* Use labels sparingly to avoid high cardinality (many unique label combinations). Labels are great for dimensions like `method` or `status_code` but not for unbounded values (e.g., user IDs).
* Prefer histograms for latency distributions and calculating percentiles in Prometheus queries. Use summaries when you need client-side quantiles.
* Expose `/metrics` on a dedicated port or path, and secure access if it includes sensitive information.
* Document what each metric means and how it should be used in dashboards and alerts.
## Official client libraries (examples)
| Language family | Official client library |
| --------------- | ----------------------- |
| Go | `client_golang` |
| Java / Scala | `client_java` |
| Python | `prometheus_client` |
| Ruby | `prometheus-client` |
## Links and references
* [Prometheus: Instrumenting Applications](https://prometheus.io/docs/instrumenting/writing_clientlibs/)
* [prometheus\_client (Python) GitHub repository](https://github.com/prometheus/client_python)
* [Prometheus documentation: Exposition formats](https://prometheus.io/docs/instrumenting/exposition_formats/)
* [Prometheus best practices for naming metrics](https://prometheus.io/docs/practices/naming/)
In the next lesson we'll integrate these metrics into Prometheus scrape configuration and build a few example Grafana dashboards and alerts.
Focus on what metrics you capture and how you expose them, not the specifics of the language. The concepts (counters, gauges, histograms/summaries, and the `/metrics` endpoint) apply across languages and frameworks.
In the sections below, we demonstrate how to instrument a Python-based API so you can track and expose essential application metrics. The concepts translate directly to other languages supported by Prometheus client libraries.
## Key Prometheus metric types
| Metric type | Purpose | Typical name example |
| ----------- | ---------------------------------------------------------------------------------------- | --------------------------------------- |
| Counter | Monotonically increasing value for counting events (e.g., requests served) | `myapp_requests_total` |
| Gauge | Value that can go up and down (e.g., concurrent sessions, memory usage) | `myapp_active_sessions` |
| Histogram | Buckets request/latency distributions for quantiles/percentiles and sum/count | `myapp_request_duration_seconds_bucket` |
| Summary | Directly observes quantiles for latency (client libraries may differ in recommended use) | `myapp_request_duration_seconds` |
## Quick Python instrumentation example
Below is a compact example showing common patterns when instrumenting a Python web API with the `prometheus_client` library:
* Define metrics (counter, gauge, histogram)
* Increment/observe metrics in your request handlers
* Expose metrics via an HTTP endpoint (e.g., `GET /metrics`) so Prometheus can scrape them
```python theme={null}
from prometheus_client import Counter, Gauge, Histogram, start_http_server
from time import sleep
from random import random
# Define metrics
REQUESTS = Counter('myapp_requests_total', 'Total HTTP requests')
IN_PROGRESS = Gauge('myapp_inprogress_requests', 'In-progress requests')
REQUEST_LATENCY = Histogram('myapp_request_duration_seconds', 'Request latency seconds')
# Start the metrics HTTP server on port 8000 (exposes /metrics)
start_http_server(8000)
def handle_request():
REQUESTS.inc()
IN_PROGRESS.inc()
with REQUEST_LATENCY.time():
# Simulate request processing
sleep(random() * 0.5)
IN_PROGRESS.dec()
if __name__ == '__main__':
while True:
handle_request()
sleep(0.1)
```
Notes:
* In web frameworks (Flask, FastAPI, Django), you typically attach middleware or decorators that update metrics around each request.
* For production, use an appropriate host/port and avoid exposing `/metrics` to the public internet; use network policies or authentication as needed.
## Best practices for application instrumentation
* Name metrics clearly and consistently: use lowercase, underscores, and include units where applicable (e.g., `_seconds`, `_bytes`).
* Use labels sparingly to avoid high cardinality (many unique label combinations). Labels are great for dimensions like `method` or `status_code` but not for unbounded values (e.g., user IDs).
* Prefer histograms for latency distributions and calculating percentiles in Prometheus queries. Use summaries when you need client-side quantiles.
* Expose `/metrics` on a dedicated port or path, and secure access if it includes sensitive information.
* Document what each metric means and how it should be used in dashboards and alerts.
## Official client libraries (examples)
| Language family | Official client library |
| --------------- | ----------------------- |
| Go | `client_golang` |
| Java / Scala | `client_java` |
| Python | `prometheus_client` |
| Ruby | `prometheus-client` |
## Links and references
* [Prometheus: Instrumenting Applications](https://prometheus.io/docs/instrumenting/writing_clientlibs/)
* [prometheus\_client (Python) GitHub repository](https://github.com/prometheus/client_python)
* [Prometheus documentation: Exposition formats](https://prometheus.io/docs/instrumenting/exposition_formats/)
* [Prometheus best practices for naming metrics](https://prometheus.io/docs/practices/naming/)
In the next lesson we'll integrate these metrics into Prometheus scrape configuration and build a few example Grafana dashboards and alerts.