> ## Documentation Index
> Fetch the complete documentation index at: https://notes.kodekloud.com/llms.txt
> Use this file to discover all available pages before exploring further.
# Console Templates
> Explains Prometheus console templates for creating custom HTML dashboards using Go templates, embedding PromQL metrics, reusable fragments, and built-in JS helpers to render charts and drilldowns.
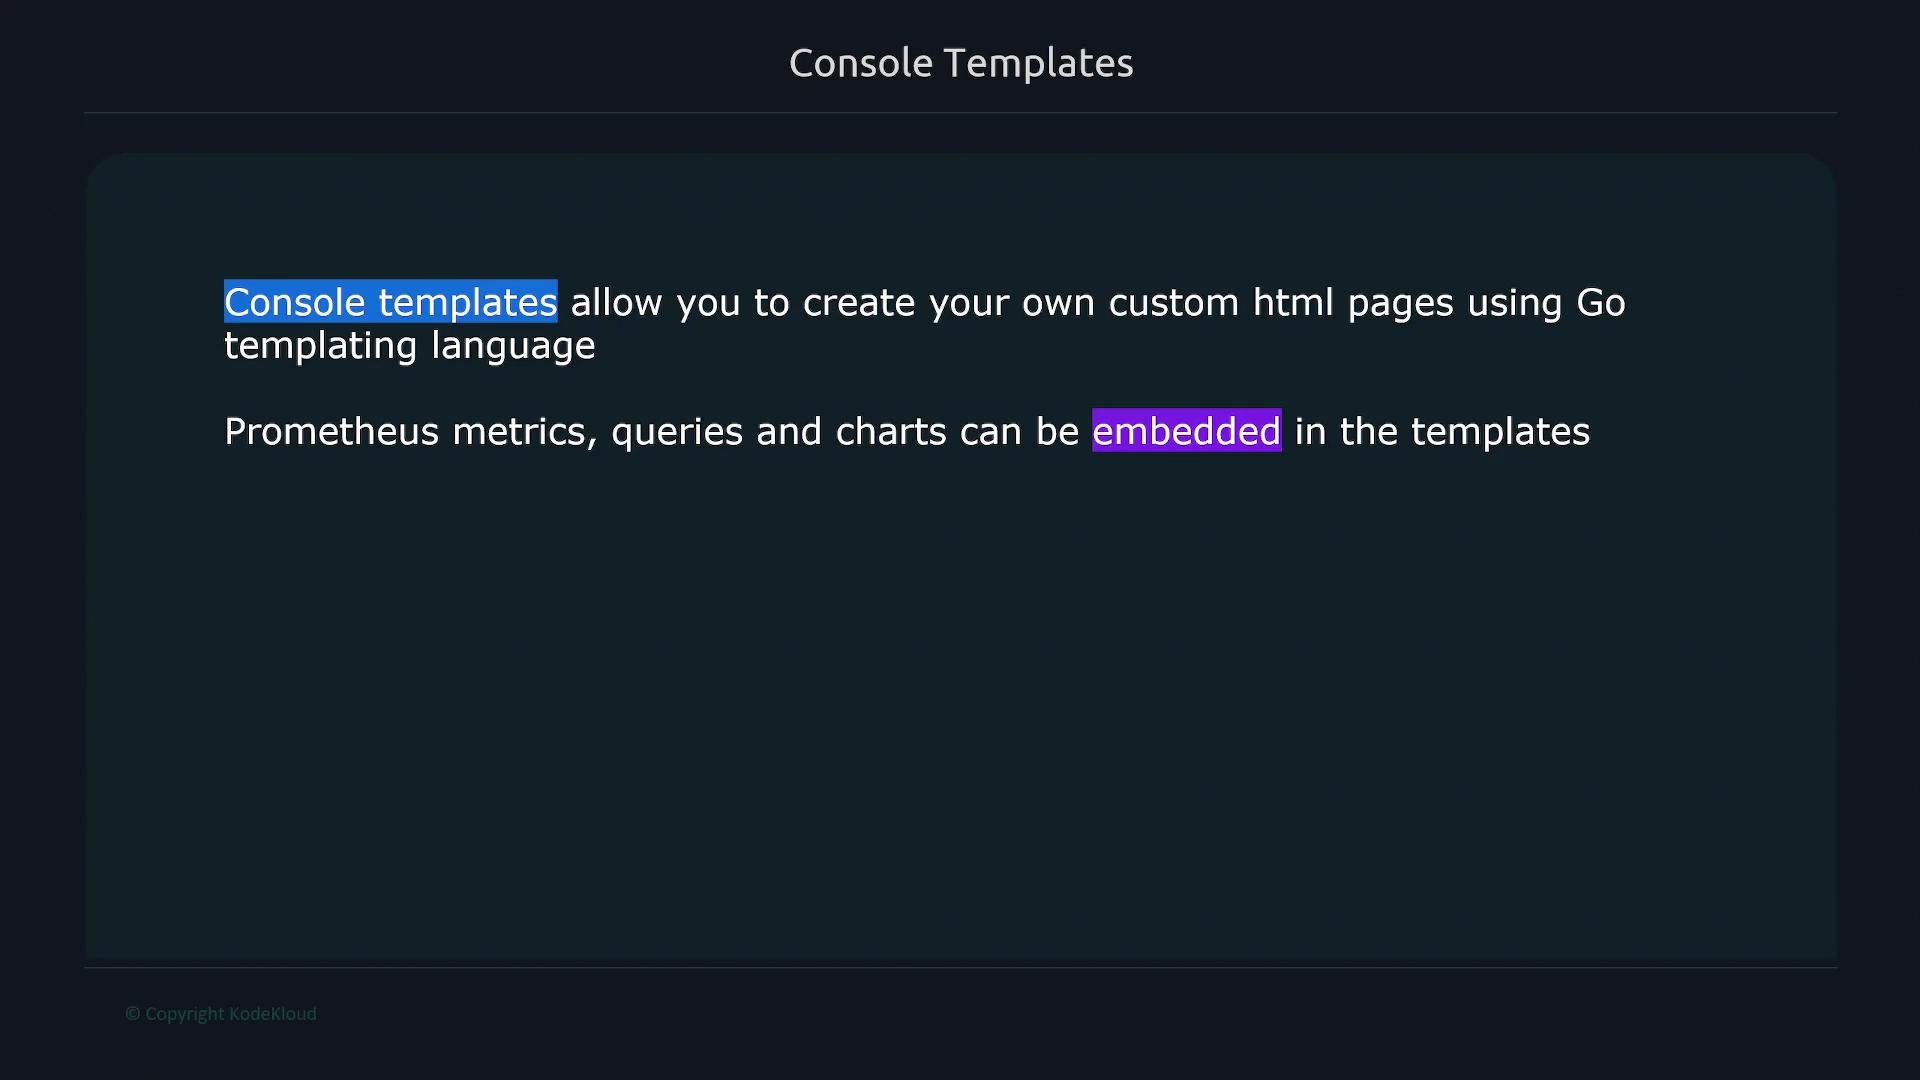
Console templates are Prometheus' built-in way to create small, custom HTML pages using the Go templating language. They let you embed Prometheus metrics, PromQL queries, and interactive charts to build compact dashboards or drill-down views that live on your Prometheus server.
 Key points:
* Console templates are plain HTML files augmented with Go template expressions (`{{ ... }}`).
* Templates can call shared fragments (for consistent header/footer/styles).
* Built-in console JS helpers provide drilldowns and chart rendering.
Location
Typically the built-in console templates are stored in `/etc/prometheus/consoles`. Listing that folder shows several example pages.
| Filename | Description / Purpose |
| -------------------------: | ------------------------------------------------------------ |
| `index.html.example` | Example index that imports fragments and lists console pages |
| `node-cpu.html` | Node CPU charts and queries |
| `node-disk.html` | Disk-related views |
| `node.html` | Node-specific metrics overview |
| `node-overview.html` | Comprehensive node overview with multiple charts |
| `prometheus.html` | Prometheus server metrics |
| `prometheus-overview.html` | Prometheus overview dashboard |
You can also inspect the raw directory contents:
```bash theme={null}
$ ls -l /etc/prometheus/consoles
total 40
-rw-r--r-- 1 prometheus prometheus 616 Nov 12 23:20 index.html.example
-rw-r--r-- 1 prometheus prometheus 2675 Nov 12 23:20 node-cpu.html
-rw-r--r-- 1 prometheus prometheus 3522 Nov 12 23:20 node-disk.html
-rw-r--r-- 1 prometheus prometheus 1453 Nov 12 23:20 node.html
-rw-r--r-- 1 prometheus prometheus 5783 Nov 12 23:20 node-overview.html
-rw-r--r-- 1 prometheus prometheus 1334 Nov 12 23:20 prometheus.html
-rw-r--r-- 1 prometheus prometheus 4103 Nov 12 23:20 prometheus-overview.html
```
The pages are standard HTML mixed with Go template directives. For example, `index.html.example` uses fragments like `head`, `tail`, and `prom_content_tail` to assemble the page layout:
```html theme={null}
{{ template "head" . }}
{{ template "prom_right_table_head" }}
{{ template "prom_right_table_tail" }}
{{ template "prom_content_head" . }}
Key points:
* Console templates are plain HTML files augmented with Go template expressions (`{{ ... }}`).
* Templates can call shared fragments (for consistent header/footer/styles).
* Built-in console JS helpers provide drilldowns and chart rendering.
Location
Typically the built-in console templates are stored in `/etc/prometheus/consoles`. Listing that folder shows several example pages.
| Filename | Description / Purpose |
| -------------------------: | ------------------------------------------------------------ |
| `index.html.example` | Example index that imports fragments and lists console pages |
| `node-cpu.html` | Node CPU charts and queries |
| `node-disk.html` | Disk-related views |
| `node.html` | Node-specific metrics overview |
| `node-overview.html` | Comprehensive node overview with multiple charts |
| `prometheus.html` | Prometheus server metrics |
| `prometheus-overview.html` | Prometheus overview dashboard |
You can also inspect the raw directory contents:
```bash theme={null}
$ ls -l /etc/prometheus/consoles
total 40
-rw-r--r-- 1 prometheus prometheus 616 Nov 12 23:20 index.html.example
-rw-r--r-- 1 prometheus prometheus 2675 Nov 12 23:20 node-cpu.html
-rw-r--r-- 1 prometheus prometheus 3522 Nov 12 23:20 node-disk.html
-rw-r--r-- 1 prometheus prometheus 1453 Nov 12 23:20 node.html
-rw-r--r-- 1 prometheus prometheus 5783 Nov 12 23:20 node-overview.html
-rw-r--r-- 1 prometheus prometheus 1334 Nov 12 23:20 prometheus.html
-rw-r--r-- 1 prometheus prometheus 4103 Nov 12 23:20 prometheus-overview.html
```
The pages are standard HTML mixed with Go template directives. For example, `index.html.example` uses fragments like `head`, `tail`, and `prom_content_tail` to assemble the page layout:
```html theme={null}
{{ template "head" . }}
{{ template "prom_right_table_head" }}
{{ template "prom_right_table_tail" }}
{{ template "prom_content_head" . }}
Overview
These are example consoles for Prometheus.
These consoles expect exporters to have the following job labels:
| Exporter |
Job label |
| Node Exporter |
node |
| Prometheus |
prometheus |
{{ template "prom_content_tail" . }}
{{ template "tail" }}
```
Open these pages in your browser by pointing to the Prometheus server under the `/consoles` path, for example:
`http://:9090/consoles/index.html.example`
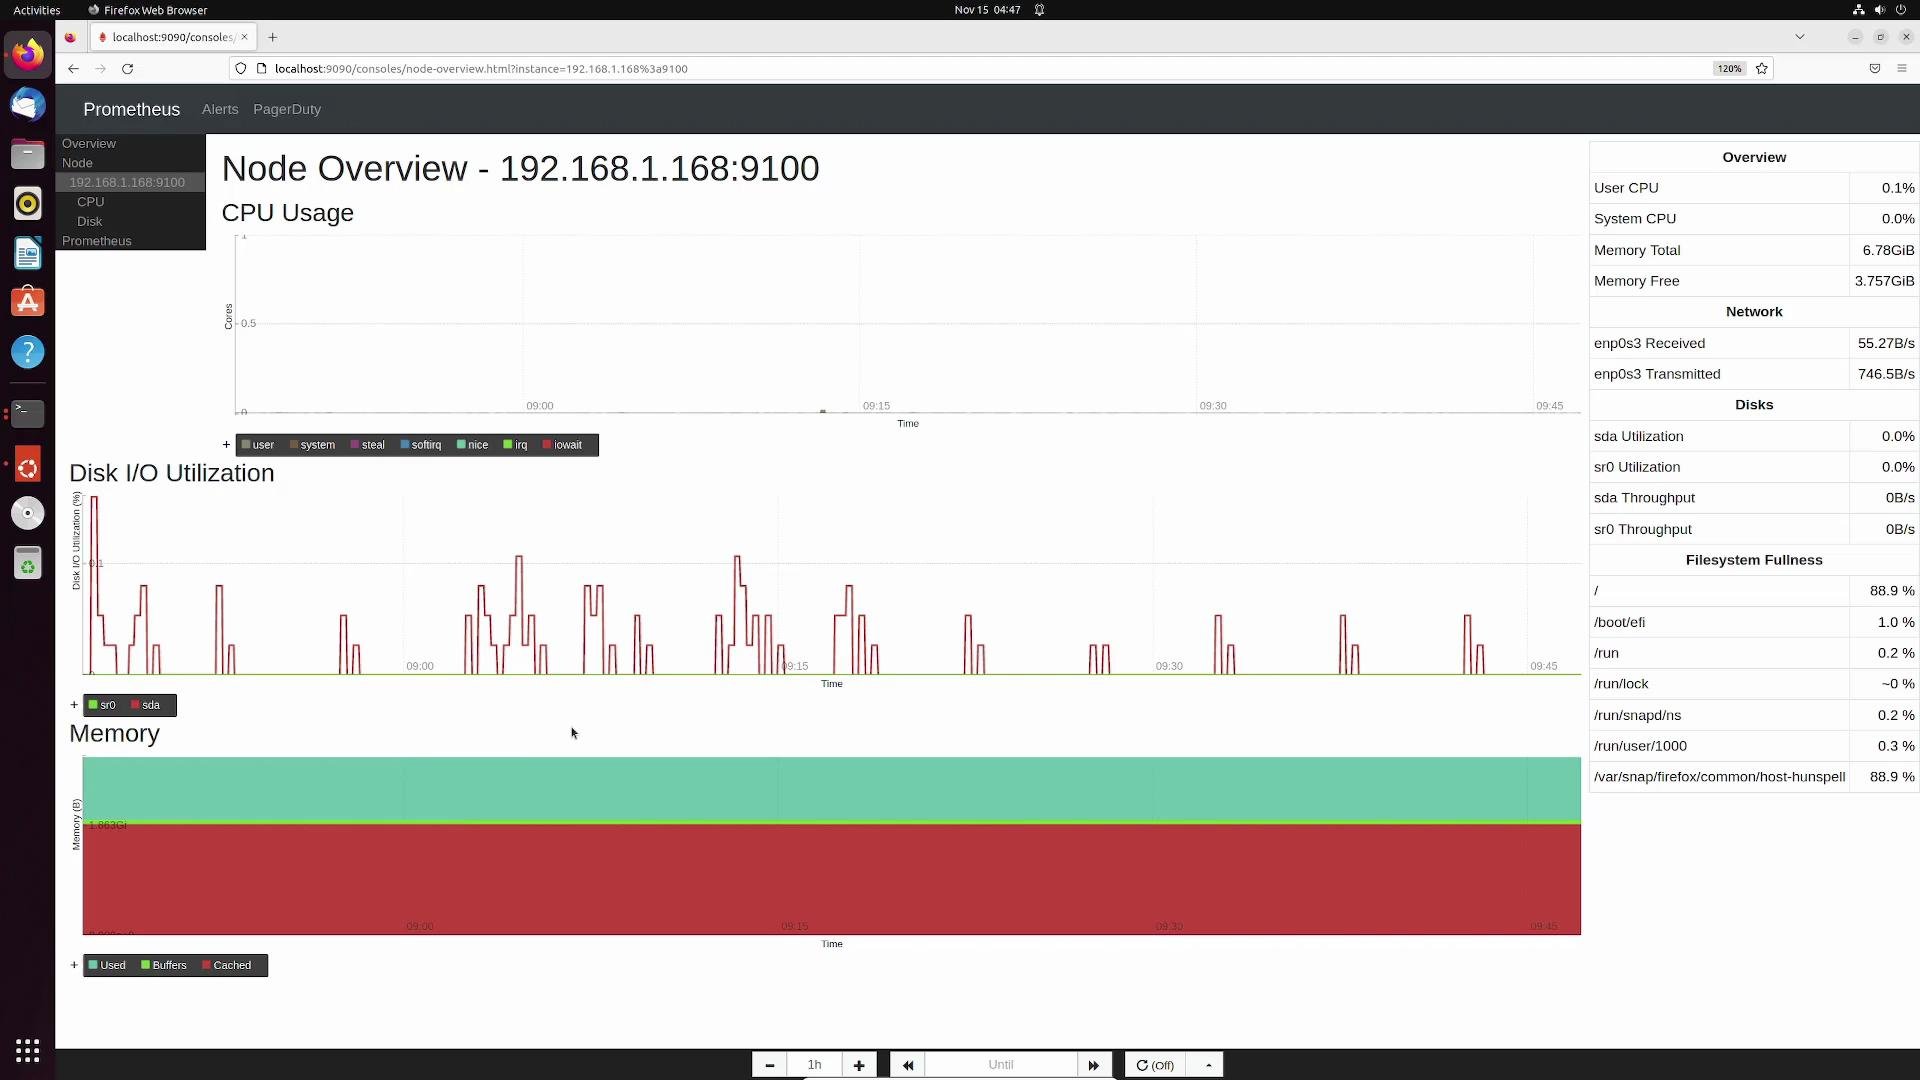
The example pages include job/instance lists, useful charts (CPU, memory, disk, network), and drill-down links for inspecting query expressions.
 Built-in consoles are utilitarian but easy to modify. Below are concise steps to create a simple console page, embed a metric drilldown, and render a chart using the console JS helpers.
Console templates are regular HTML files using Go templates. Reuse provided fragments like `head`, `prom_content_head`, and `tail` for consistent styling and JS helpers. You can embed PromQL expressions and use built-in widgets for drilldowns and graphs.
## Create a simple console (demo.html)
Follow these steps to create a minimal custom console that displays a metric value and a chart.
1. Create the file in the consoles directory:
```bash theme={null}
cd /etc/prometheus/consoles
ls
# you should see the example files listed earlier
sudo vi demo.html
```
2. Use the standard fragments for header and footer. These provide the required CSS/JS and layout:
```html theme={null}
{{ template "head" . }}
{{ template "prom_content_head" . }}
{{ template "prom_content_tail" . }}
{{ template "tail" }}
```
3. Replace the middle area with your page content. Save the following as `/etc/prometheus/consoles/demo.html`. This example:
* Renders a page header,
* Inserts the current value of `node_memory_Active_bytes` as a clickable drilldown,
* Adds a chart that visualizes the same metric.
```html theme={null}
{{ template "head" . }}
{{ template "prom_content_head" . }}
Built-in consoles are utilitarian but easy to modify. Below are concise steps to create a simple console page, embed a metric drilldown, and render a chart using the console JS helpers.
Console templates are regular HTML files using Go templates. Reuse provided fragments like `head`, `prom_content_head`, and `tail` for consistent styling and JS helpers. You can embed PromQL expressions and use built-in widgets for drilldowns and graphs.
## Create a simple console (demo.html)
Follow these steps to create a minimal custom console that displays a metric value and a chart.
1. Create the file in the consoles directory:
```bash theme={null}
cd /etc/prometheus/consoles
ls
# you should see the example files listed earlier
sudo vi demo.html
```
2. Use the standard fragments for header and footer. These provide the required CSS/JS and layout:
```html theme={null}
{{ template "head" . }}
{{ template "prom_content_head" . }}
{{ template "prom_content_tail" . }}
{{ template "tail" }}
```
3. Replace the middle area with your page content. Save the following as `/etc/prometheus/consoles/demo.html`. This example:
* Renders a page header,
* Inserts the current value of `node_memory_Active_bytes` as a clickable drilldown,
* Adds a chart that visualizes the same metric.
```html theme={null}
{{ template "head" . }}
{{ template "prom_content_head" . }}
Memory details
Active memory:
{{ template "prom_query_drilldown" (args "node_memory_Active_bytes") }}
{{ template "prom_content_tail" . }}
{{ template "tail" }}
```
4. Open your new console page in a browser:
`http://:9090/consoles/demo.html`
You should see:
* The header/footer and CSS from the included fragments,
* An H1 "Memory details",
* A rendered metric value for `node_memory_Active_bytes` as a clickable link showing label details and the PromQL expression,
* A chart rendered inside `#graph` showing the metric over time.
Example metric text shown by the drilldown widget:
```text theme={null}
node_memory_Active_bytes{instance="192.168.1.168:9100", job="node"} 9160494976
```
Tips and recommended usage
* Use `{{ template "prom_query_drilldown" (args "") }}` to create clickable metric values that show expression details.
* Use `new PromConsole.Graph({...})` to render interactive charts using the console JS library.
* Reuse fragments such as `head`, `prom_content_head`, `prom_content_tail`, and `tail` to keep consistent layout and load required JS/CSS.
* Combine multiple graphs, tables, and fragments to build richer dashboards or drill-down pages.
Links and References
* Prometheus documentation: [https://prometheus.io/docs/](https://prometheus.io/docs/)
* Go templates (for `{{ ... }}` syntax): [https://pkg.go.dev/text/template](https://pkg.go.dev/text/template)
* Prometheus server web UI and consoles: [https://prometheus.io/docs/visualization/consoles/](https://prometheus.io/docs/visualization/consoles/)