> ## Documentation Index
> Fetch the complete documentation index at: https://notes.kodekloud.com/llms.txt
> Use this file to discover all available pages before exploring further.
# Course Introduction
> Hands-on course teaching Prometheus fundamentals, instrumentation, alerting, scaling, and observability practices with labs, examples, and real world exercises to prepare for certification
Welcome to the Prometheus Certified Associate course.
If you're here, you already know observability is essential in today's cloud-native world. Prometheus is the de facto standard for monitoring and alerting—used across organizations such as Google, Red Hat, and GitLab—and demand for Prometheus expertise continues to grow.
This course is practical and hands-on. Each topic includes labs, command-line exercises, and real-world examples so you learn by doing and build skills that transfer to production.
I'm Sanjeev, your instructor. I'll guide you through Prometheus, observability concepts, and the tooling you need to operate reliable monitoring at scale.
How this course is structured
* We follow a progressive, task-focused path: foundations → Prometheus fundamentals → instrumentation and metrics → alerting and operations → scaling and long-term storage.
* Every module includes examples and lab exercises so you can practice the concepts immediately.
Course modules at-a-glance
| Module | What you'll learn | Example / Commands |
| --------------------------------------- | ---------------------------------------------------------------------------------------------------------------------------------------------- | ------------------------------------------------------------------------------------------- |
| Foundations | Observability fundamentals: what observability means, why it matters, and how SLOs, SLAs, and SLIs help measure and ensure system reliability. | Concepts, measurement approaches, and SLO examples. |
| Prometheus fundamentals | Prometheus use cases, core concepts, architecture, and installation options (packages, systemd, Docker, etc.). | Install and run Prometheus; learning architecture patterns. |
| Node Exporter & system metrics | Install and run `node_exporter` to collect host-level metrics and run it as a `systemd` service. | Edit the unit file: sudo vi /etc/systemd/system/node\_exporter.service |
| Example systemd unit for node\_exporter | Service unit to run node\_exporter as a systemd-managed process. | See unit below. |
| Configuring Prometheus | How scraping, relabeling, auth/encryption for remote endpoints, and dynamic config reloads work. | `prometheus --config.file=/etc/prometheus/prometheus.yml` and SIGHUP/`/-/reload` endpoints. |
| Metrics & data model | Prometheus metric format, labels, and cardinality best practices. | Example metric: node\_cpu\_seconds\_total{cpu="0",mode="idle"} 258277.86 |
| PromQL | Selectors, matchers, operators, vector matching, aggregation, and subqueries. | Build queries for alerting and dashboard panels. |
| Visualization & dashboards | Using the Prometheus expression browser, console templates, and dashboard tooling. | Grafana panels, Prometheus console templates. |
| Application instrumentation | Instrument apps using Prometheus client libraries and follow best practices. | Example Flask app exposing an endpoint (below). |
| Service discovery | Static, cloud, and Kubernetes service discovery; file-based SD, relabeling, and dynamic config updates. | Example static scrape config (below). |
| Pushgateway & short-lived jobs | Patterns for capturing metrics from short-lived batch jobs using Pushgateway. | Example push using `curl` (below). |
| Alerting & Alertmanager | Writing alerting rules, Alertmanager configuration, notification routing, silences, and deduplication. | Alerting flow diagram and examples below. |
| Kubernetes monitoring | Deploying Prometheus on Kubernetes (including Helm charts), monitoring workloads, and dynamic scrape config in clusters. | `PrometheusRule` CRD example (below). |
| Scaling & long-term storage | Horizontal scaling patterns, remote write/receive, and integrations with Thanos, Cortex, and other long-term stores. | Architecture patterns and retention strategies. |
| Community & continued learning | Connect with peers, join forums, and leverage community resources to accelerate your learning. | KodeKloud forums and community labs. |
Node Exporter systemd unit example
```ini theme={null}
[Unit]
Description=Node Exporter
Wants=network-online.target
After=network-online.target
[Service]
User=node_exporter
Group=node_exporter
Type=simple
ExecStart=/usr/local/bin/node_exporter
[Install]
WantedBy=multi-user.target
```
Metrics example
* Prometheus records metrics in a text exposition format. Example sample:
`node_cpu_seconds_total{cpu="0",mode="idle"} 258277.86`
Prometheus configuration example (static targets)
```yaml theme={null}
scrape_configs:
- job_name: "web"
static_configs:
- targets: ["localhost:9090"]
- job_name: "node"
static_configs:
- targets: ["192.168.1.168:9100"]
- job_name: "docker"
static_configs:
- targets: ["localhost:9323"]
```
Application instrumentation example (Flask)
```python theme={null}
from flask import Flask, jsonify
app = Flask(__name__)
@app.get("/cars")
def get_cars():
return jsonify(["toyota", "honda", "mazda", "lexus"])
if __name__ == '__main__':
app.run(port=5001)
```
Pushgateway example (curl)
```bash theme={null}
echo "example_metric 4421" | curl --data-binary @- http://pushgateway:9091/metrics/job/db_backup
```
Alerting: Prometheus vs Alertmanager
* Prometheus evaluates alerting rules and emits alerts.
* Alertmanager receives those alerts and handles notification delivery (email, Slack, PagerDuty, etc.), grouping, inhibition, and silencing.
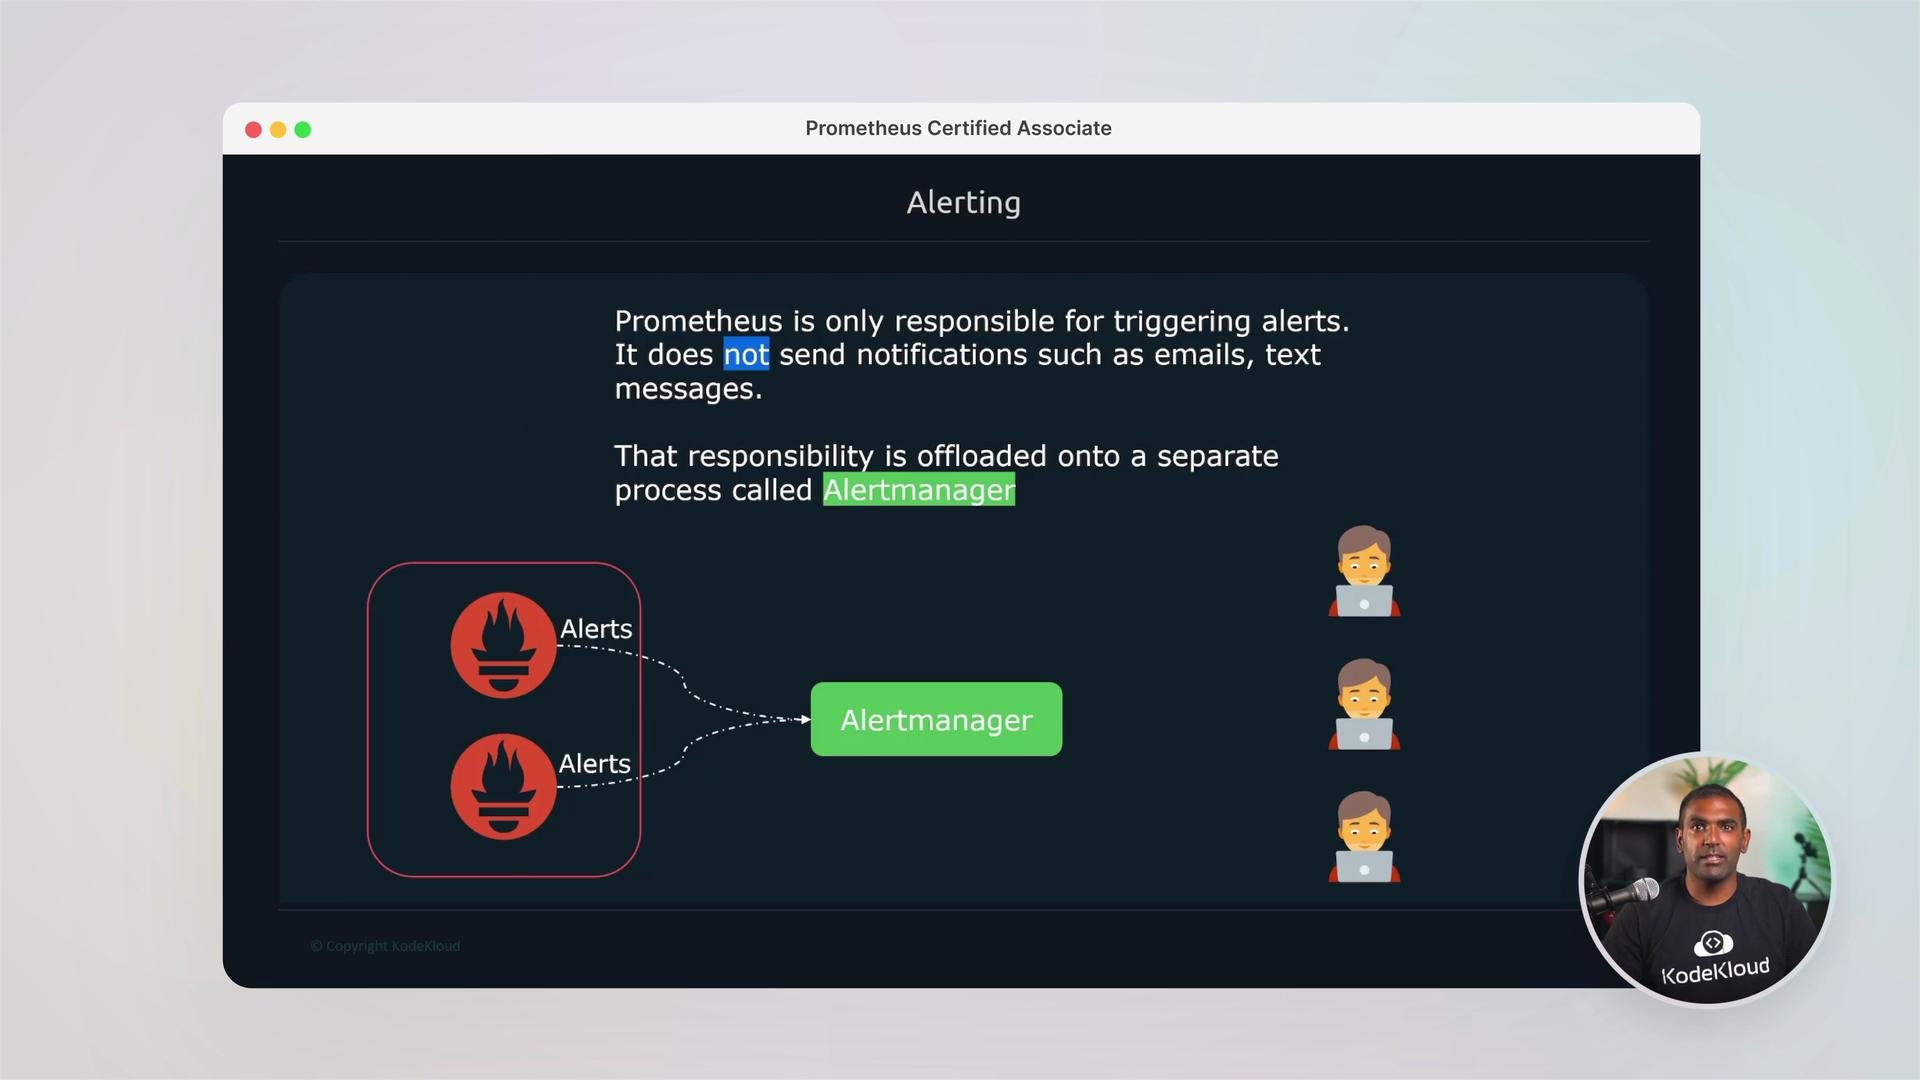 Prometheus evaluates alerting rules and emits alerts. Delivery of those alerts (email, Slack, PagerDuty, etc.) is handled by Alertmanager.
Kubernetes PrometheusRule example (Kubernetes CRD)
```yaml theme={null}
apiVersion: monitoring.coreos.com/v1
kind: PrometheusRule
metadata:
name: api-rules
labels:
release: prometheus
spec:
groups:
- name: api
rules:
- alert: down
expr: up == 0
for: 0m
labels:
severity: critical
annotations:
summary: Prometheus target missing {{ $labels.instance }}
```
Scaling and long-term storage
* Learn remote write/receive, how Thanos and Cortex provide horizontally scalable storage and long-term retention, and strategies for retention vs. cost trade-offs.
Community learning and next steps
* Join KodeKloud forums to connect with peers, practice labs, ask questions, and collaborate on challenges.
* Work through the labs in sequence and use the community to accelerate learning.
Links and references
* Prometheus: [https://prometheus.io](https://prometheus.io)
* PromQL basics: [https://prometheus.io/docs/prometheus/latest/querying/basics/](https://prometheus.io/docs/prometheus/latest/querying/basics/)
* Node Exporter: [https://github.com/prometheus/node\_exporter](https://github.com/prometheus/node_exporter)
* Pushgateway: [https://github.com/prometheus/pushgateway](https://github.com/prometheus/pushgateway)
* Alertmanager: [https://prometheus.io/docs/alerting/latest/alertmanager/](https://prometheus.io/docs/alerting/latest/alertmanager/)
* Kubernetes: [https://kubernetes.io](https://kubernetes.io)
* Helm: [https://helm.sh](https://helm.sh)
* Thanos: [https://thanos.io](https://thanos.io)
* Cortex: [https://cortexmetrics.io](https://cortexmetrics.io)
Together we'll tackle real-world monitoring challenges and build Prometheus skills you can apply in production.
Prometheus evaluates alerting rules and emits alerts. Delivery of those alerts (email, Slack, PagerDuty, etc.) is handled by Alertmanager.
Kubernetes PrometheusRule example (Kubernetes CRD)
```yaml theme={null}
apiVersion: monitoring.coreos.com/v1
kind: PrometheusRule
metadata:
name: api-rules
labels:
release: prometheus
spec:
groups:
- name: api
rules:
- alert: down
expr: up == 0
for: 0m
labels:
severity: critical
annotations:
summary: Prometheus target missing {{ $labels.instance }}
```
Scaling and long-term storage
* Learn remote write/receive, how Thanos and Cortex provide horizontally scalable storage and long-term retention, and strategies for retention vs. cost trade-offs.
Community learning and next steps
* Join KodeKloud forums to connect with peers, practice labs, ask questions, and collaborate on challenges.
* Work through the labs in sequence and use the community to accelerate learning.
Links and references
* Prometheus: [https://prometheus.io](https://prometheus.io)
* PromQL basics: [https://prometheus.io/docs/prometheus/latest/querying/basics/](https://prometheus.io/docs/prometheus/latest/querying/basics/)
* Node Exporter: [https://github.com/prometheus/node\_exporter](https://github.com/prometheus/node_exporter)
* Pushgateway: [https://github.com/prometheus/pushgateway](https://github.com/prometheus/pushgateway)
* Alertmanager: [https://prometheus.io/docs/alerting/latest/alertmanager/](https://prometheus.io/docs/alerting/latest/alertmanager/)
* Kubernetes: [https://kubernetes.io](https://kubernetes.io)
* Helm: [https://helm.sh](https://helm.sh)
* Thanos: [https://thanos.io](https://thanos.io)
* Cortex: [https://cortexmetrics.io](https://cortexmetrics.io)
Together we'll tackle real-world monitoring challenges and build Prometheus skills you can apply in production.