> ## Documentation Index
> Fetch the complete documentation index at: https://notes.kodekloud.com/llms.txt
> Use this file to discover all available pages before exploring further.
# Prometheus Configuration
> Explains Helm installed Prometheus configuration, Kubernetes service discovery roles, and relabeling rules used to select scrape targets and configure TLS and authorization.
Now that you can connect to your Prometheus server, this article inspects the default configuration the Helm chart installs and explains how Kubernetes service discovery (SD) is used to dynamically discover scrape targets.
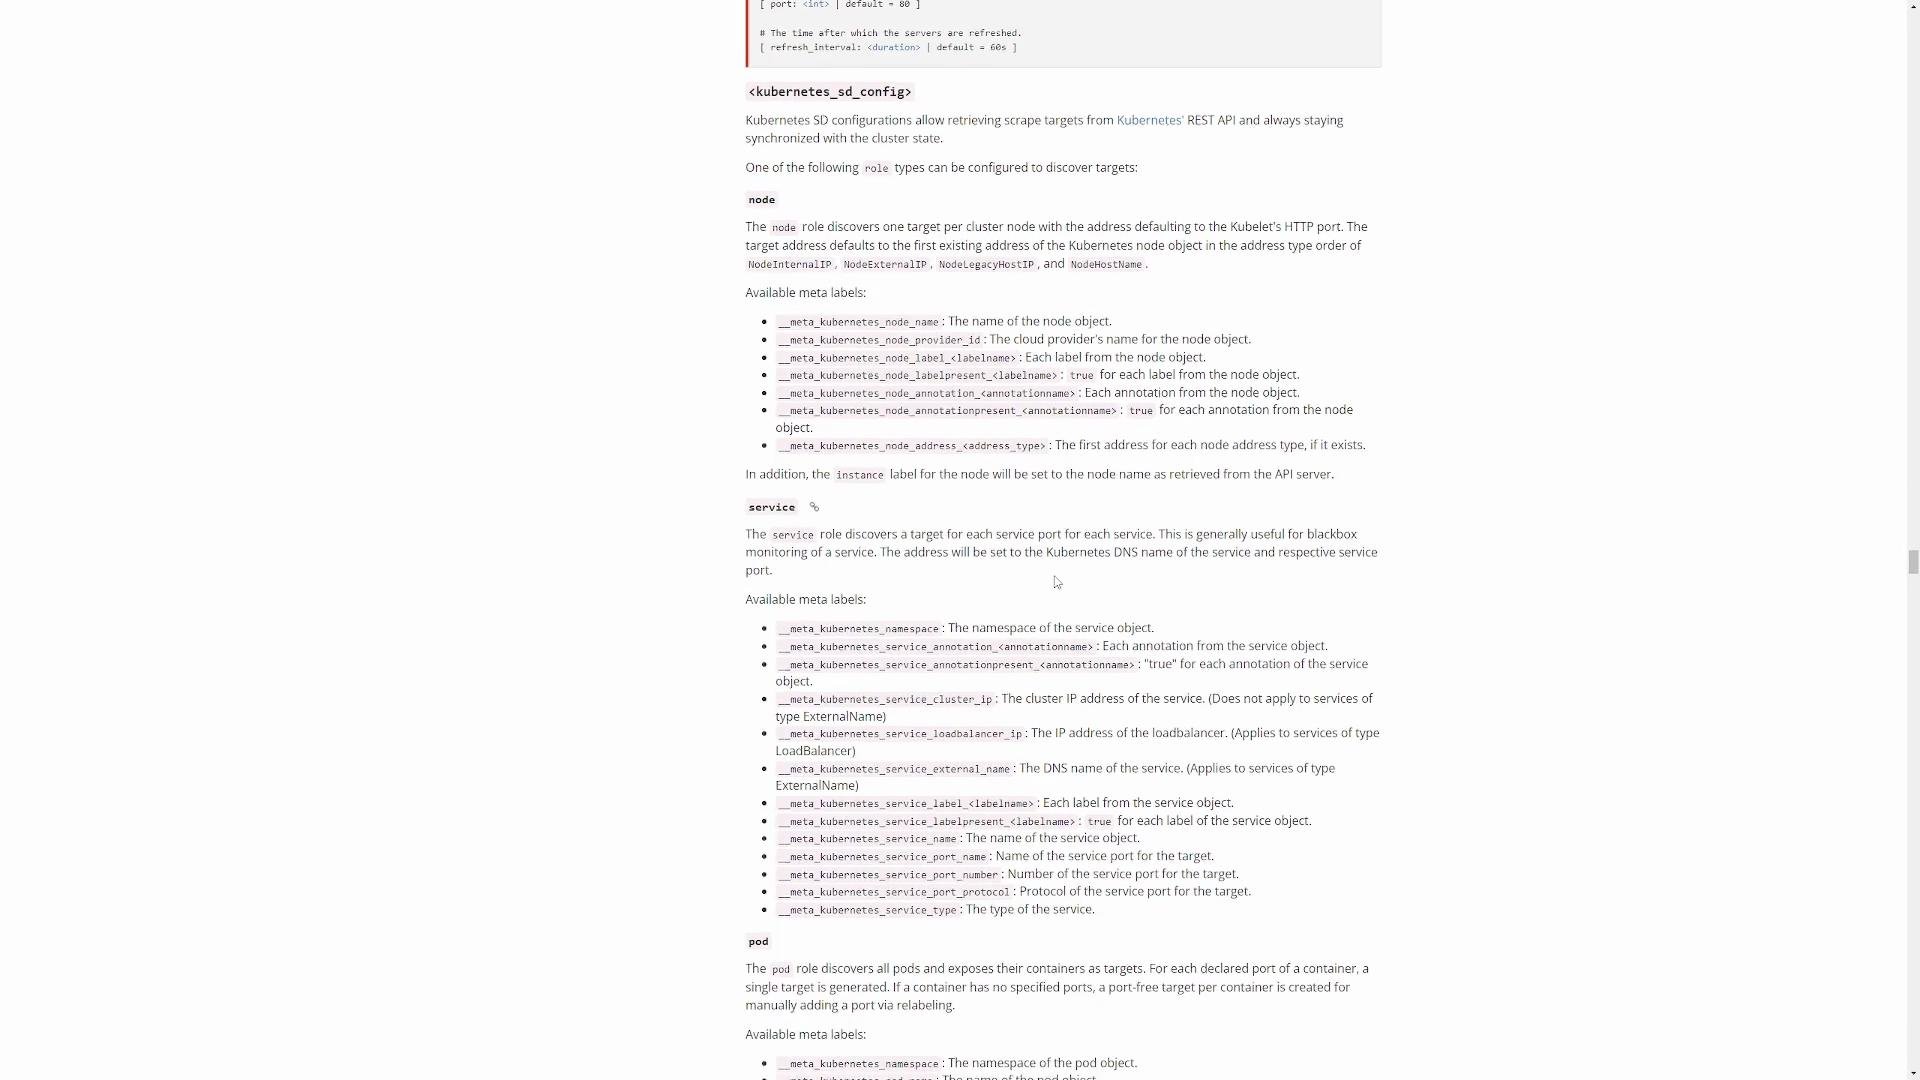
Kubernetes exposes multiple SD roles that Prometheus can use to discover targets. Each role returns different metadata that you can filter using relabeling rules.
| SD Role | What it discovers | Typical metadata / use |
| --------- | ------------------------------------------------- | -------------------------------------------------------------------------------------------------------------------------------------- |
| node | All nodes in the cluster | Node name, IP, labels — useful for node-exporter or kubelet scraping |
| service | Kubernetes Services and their ports | Service name, labels, ports — useful for Service-level targeting |
| pod | Pods directly | Pod name, labels, pod IP — useful to target a pod's metrics endpoint |
| endpoints | Individual endpoints (IP + port) backing Services | Most flexible: enumerates every IP:port in the cluster (Pods, Nodes, external endpoints) and exposes endpoint + service + pod metadata |
The Helm charts commonly use the `endpoints` role for Kubernetes SD. Because `endpoints` enumerates IP:port pairs for Services, Pods, and Nodes, relabeling rules then narrow that large set to the exact targets you want to scrape.
Inspecting the generated configuration
* In the Prometheus web UI go to Status → Configuration to view the generated `prometheus.yml`.
* The important section is `scrape_configs` — this is where SD and relabeling determine which endpoints Prometheus scrapes.
* Helm-generated configs typically create many `scrape_configs` (one per ServiceMonitor/PodMonitor, or per built-in component), each using `kubernetes_sd_configs` with `role: endpoints`.
Representative scrape config (cleaned) that a Helm chart uses to find Alertmanager endpoints. Notice `kubernetes_sd_configs` with `role: endpoints` and relabel rules that keep only the Alertmanager Service and its `web` port:
```yaml theme={null}
scrape_configs:
- job_name: "serviceMonitor/default/prometheus-kube-prometheus-alertmanager"
honor_labels: true
metrics_path: /metrics
scrape_interval: 30s
scrape_timeout: 10s
scheme: http
follow_redirects: true
kubernetes_sd_configs:
- role: endpoints
kubeconfig_file: ""
follow_redirects: true
enable_http2: true
relabel_configs:
- source_labels: [__meta_kubernetes_service_name]
separator: ;
regex: prometheus-kube-prometheus-alertmanager
action: keep
- source_labels: [__meta_kubernetes_endpoint_port_name]
separator: ;
regex: web
action: keep
```
How relabeling restricts what Prometheus scrapes
* Kubernetes SD returns a broad set of endpoint entries. Prometheus relies on relabeling rules to include or exclude targets by matching metadata exposed by the SD.
* Common metadata keys you’ll see in relabeling rules:
* `__meta_kubernetes_service_name`
* `__meta_kubernetes_endpoint_port_name`
* `__meta_kubernetes_service_label_
 Inspecting the generated configuration
* In the Prometheus web UI go to Status → Configuration to view the generated `prometheus.yml`.
* The important section is `scrape_configs` — this is where SD and relabeling determine which endpoints Prometheus scrapes.
* Helm-generated configs typically create many `scrape_configs` (one per ServiceMonitor/PodMonitor, or per built-in component), each using `kubernetes_sd_configs` with `role: endpoints`.
Representative scrape config (cleaned) that a Helm chart uses to find Alertmanager endpoints. Notice `kubernetes_sd_configs` with `role: endpoints` and relabel rules that keep only the Alertmanager Service and its `web` port:
```yaml theme={null}
scrape_configs:
- job_name: "serviceMonitor/default/prometheus-kube-prometheus-alertmanager"
honor_labels: true
metrics_path: /metrics
scrape_interval: 30s
scrape_timeout: 10s
scheme: http
follow_redirects: true
kubernetes_sd_configs:
- role: endpoints
kubeconfig_file: ""
follow_redirects: true
enable_http2: true
relabel_configs:
- source_labels: [__meta_kubernetes_service_name]
separator: ;
regex: prometheus-kube-prometheus-alertmanager
action: keep
- source_labels: [__meta_kubernetes_endpoint_port_name]
separator: ;
regex: web
action: keep
```
How relabeling restricts what Prometheus scrapes
* Kubernetes SD returns a broad set of endpoint entries. Prometheus relies on relabeling rules to include or exclude targets by matching metadata exposed by the SD.
* Common metadata keys you’ll see in relabeling rules:
* `__meta_kubernetes_service_name`
* `__meta_kubernetes_endpoint_port_name`
* `__meta_kubernetes_service_label_
Inspecting the generated configuration
* In the Prometheus web UI go to Status → Configuration to view the generated `prometheus.yml`.
* The important section is `scrape_configs` — this is where SD and relabeling determine which endpoints Prometheus scrapes.
* Helm-generated configs typically create many `scrape_configs` (one per ServiceMonitor/PodMonitor, or per built-in component), each using `kubernetes_sd_configs` with `role: endpoints`.
Representative scrape config (cleaned) that a Helm chart uses to find Alertmanager endpoints. Notice `kubernetes_sd_configs` with `role: endpoints` and relabel rules that keep only the Alertmanager Service and its `web` port:
```yaml theme={null}
scrape_configs:
- job_name: "serviceMonitor/default/prometheus-kube-prometheus-alertmanager"
honor_labels: true
metrics_path: /metrics
scrape_interval: 30s
scrape_timeout: 10s
scheme: http
follow_redirects: true
kubernetes_sd_configs:
- role: endpoints
kubeconfig_file: ""
follow_redirects: true
enable_http2: true
relabel_configs:
- source_labels: [__meta_kubernetes_service_name]
separator: ;
regex: prometheus-kube-prometheus-alertmanager
action: keep
- source_labels: [__meta_kubernetes_endpoint_port_name]
separator: ;
regex: web
action: keep
```
How relabeling restricts what Prometheus scrapes
* Kubernetes SD returns a broad set of endpoint entries. Prometheus relies on relabeling rules to include or exclude targets by matching metadata exposed by the SD.
* Common metadata keys you’ll see in relabeling rules:
* `__meta_kubernetes_service_name`
* `__meta_kubernetes_endpoint_port_name`
* `__meta_kubernetes_service_label_