> ## Documentation Index
> Fetch the complete documentation index at: https://notes.kodekloud.com/llms.txt
> Use this file to discover all available pages before exploring further.
# Service Monitors
> Explains using ServiceMonitor CRD with Prometheus Operator to declaratively configure Kubernetes scrape targets, selectors, and resulting Prometheus scrape configs and relabeling.
In this lesson we’ll learn how to add scrape targets to Prometheus by using the ServiceMonitor custom resource provided by the Prometheus Operator. ServiceMonitors let you declare Prometheus scrape configuration in Kubernetes objects instead of editing Prometheus config files directly.
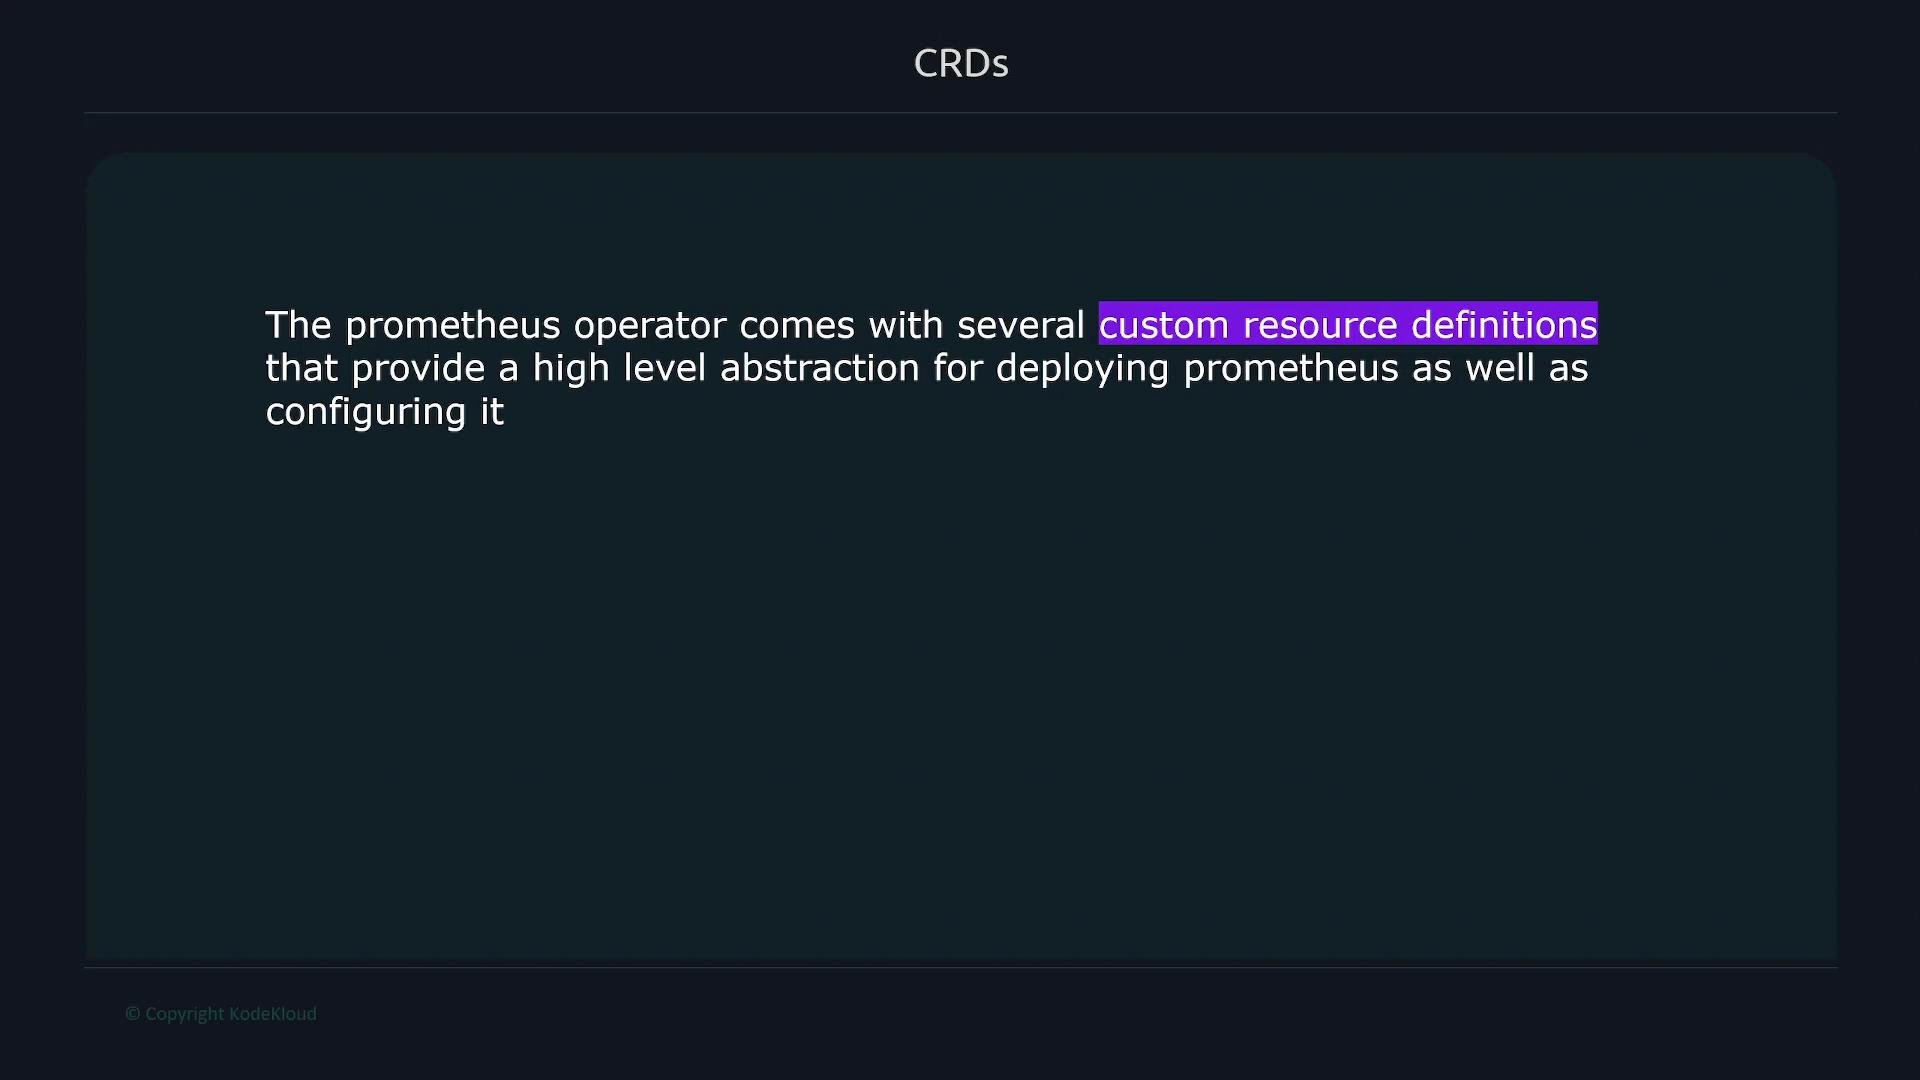
The Prometheus Operator installs several Custom Resource Definitions (CRDs) that provide higher-level abstractions for deploying and configuring Prometheus components (Prometheus instances, Alertmanagers, ServiceMonitors, PodMonitors, etc.).
 List the installed CRDs:
```bash theme={null}
kubectl get crd
```
Example truncated output:
```text theme={null}
NAME CREATED AT
alertmanagerconfigs.monitoring.coreos.com 2022-11-18T01:18:55Z
alertmanagers.monitoring.coreos.com 2022-11-18T01:18:55Z
podmonitors.monitoring.coreos.com 2022-11-18T01:18:56Z
prometheuses.monitoring.coreos.com 2022-11-18T01:18:56Z
prometheusrules.monitoring.coreos.com 2022-11-18T01:18:56Z
servicemonitors.monitoring.coreos.com 2022-11-18T01:18:57Z
thanosrulers.monitoring.coreos.com 2022-11-18T01:18:57Z
```
Key CRDs and their use cases:
| Resource Type | Use Case | Example |
| -------------- | ------------------------------------ | --------------------------------------- |
| Alertmanager | Manage Alertmanager instances | `alertmanagers.monitoring.coreos.com` |
| Prometheus | Manage Prometheus instances | `prometheuses.monitoring.coreos.com` |
| ServiceMonitor | Declare service-level scrape targets | `servicemonitors.monitoring.coreos.com` |
| PodMonitor | Declare pod-level scrape targets | `podmonitors.monitoring.coreos.com` |
| PrometheusRule | Define alerting and recording rules | `prometheusrules.monitoring.coreos.com` |
What is a ServiceMonitor?
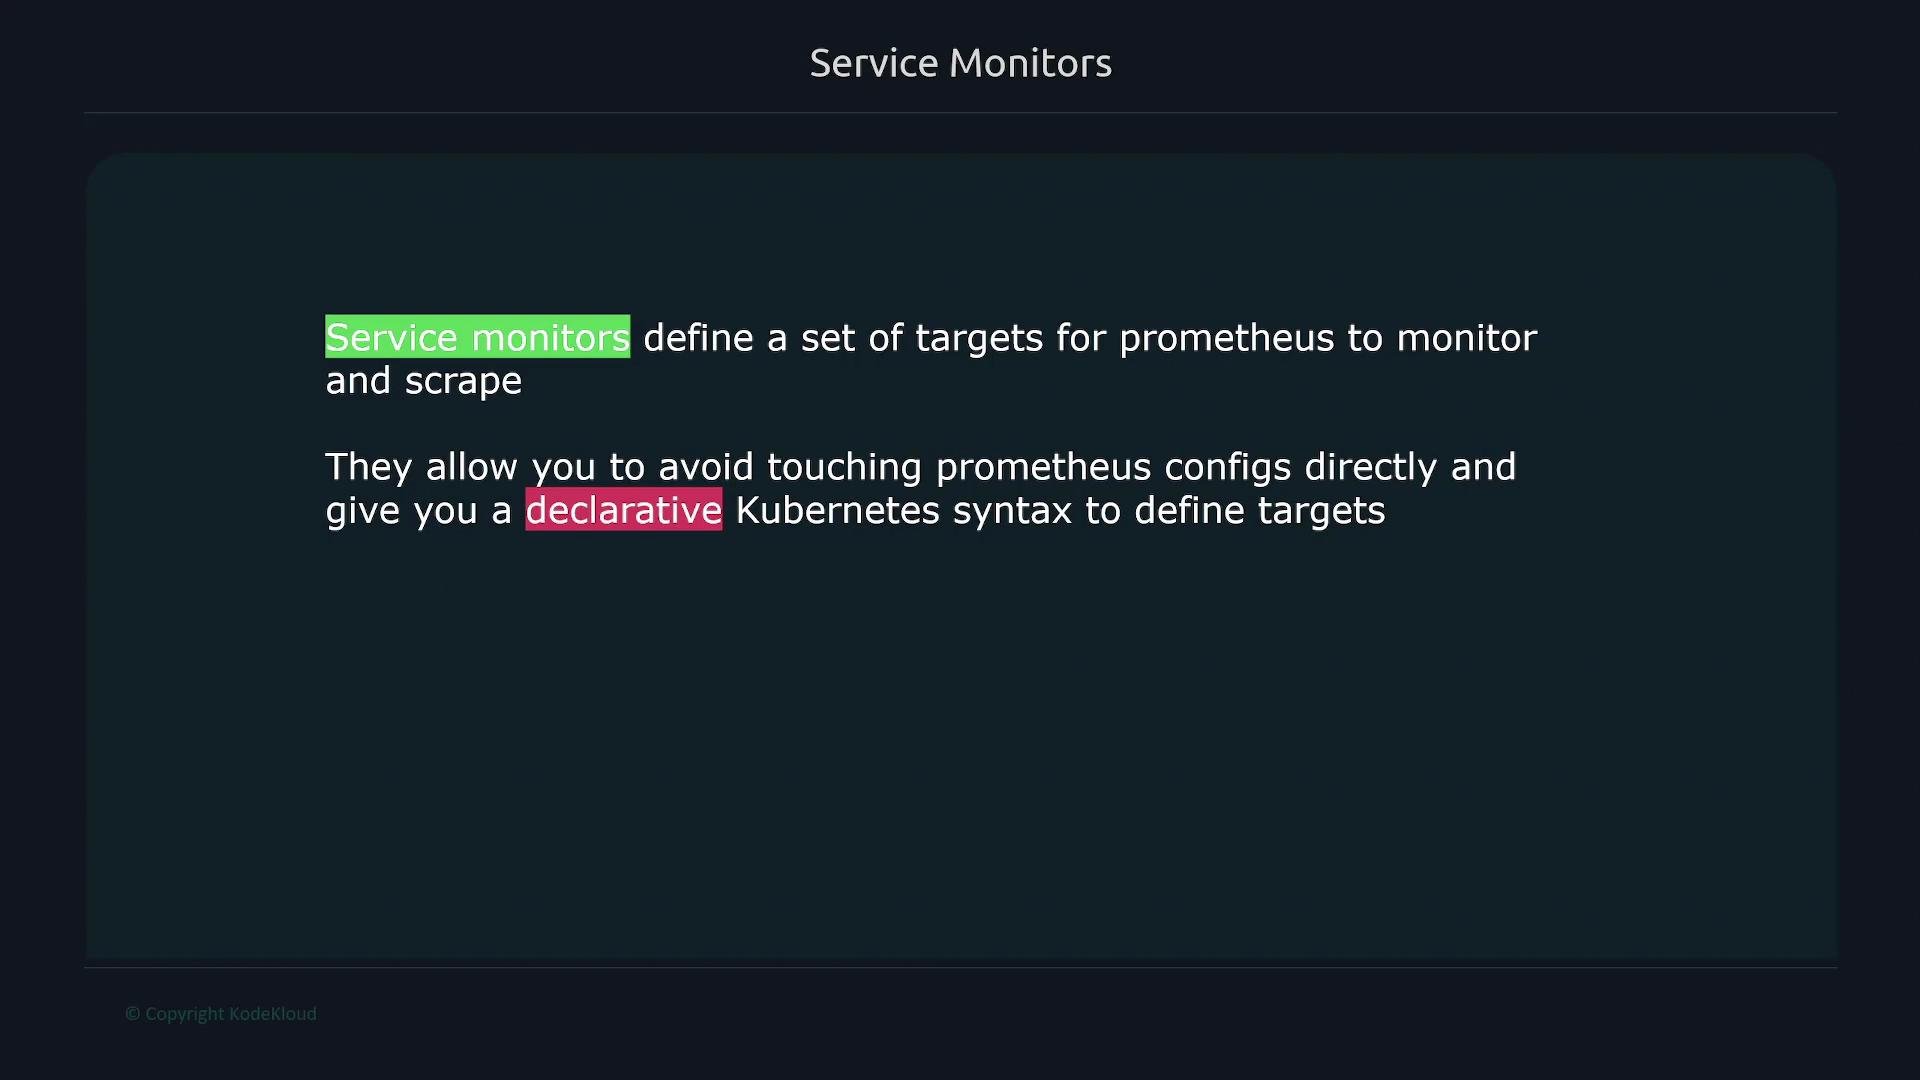
* A ServiceMonitor is a CRD that defines a set of targets for Prometheus to monitor and scrape.
* It expresses scrape configuration (endpoints, path, interval, job label) in Kubernetes objects so you don’t edit Prometheus config files directly.
* The Prometheus Operator translates ServiceMonitor resources into Prometheus `scrape_configs`.
List the installed CRDs:
```bash theme={null}
kubectl get crd
```
Example truncated output:
```text theme={null}
NAME CREATED AT
alertmanagerconfigs.monitoring.coreos.com 2022-11-18T01:18:55Z
alertmanagers.monitoring.coreos.com 2022-11-18T01:18:55Z
podmonitors.monitoring.coreos.com 2022-11-18T01:18:56Z
prometheuses.monitoring.coreos.com 2022-11-18T01:18:56Z
prometheusrules.monitoring.coreos.com 2022-11-18T01:18:56Z
servicemonitors.monitoring.coreos.com 2022-11-18T01:18:57Z
thanosrulers.monitoring.coreos.com 2022-11-18T01:18:57Z
```
Key CRDs and their use cases:
| Resource Type | Use Case | Example |
| -------------- | ------------------------------------ | --------------------------------------- |
| Alertmanager | Manage Alertmanager instances | `alertmanagers.monitoring.coreos.com` |
| Prometheus | Manage Prometheus instances | `prometheuses.monitoring.coreos.com` |
| ServiceMonitor | Declare service-level scrape targets | `servicemonitors.monitoring.coreos.com` |
| PodMonitor | Declare pod-level scrape targets | `podmonitors.monitoring.coreos.com` |
| PrometheusRule | Define alerting and recording rules | `prometheusrules.monitoring.coreos.com` |
What is a ServiceMonitor?
* A ServiceMonitor is a CRD that defines a set of targets for Prometheus to monitor and scrape.
* It expresses scrape configuration (endpoints, path, interval, job label) in Kubernetes objects so you don’t edit Prometheus config files directly.
* The Prometheus Operator translates ServiceMonitor resources into Prometheus `scrape_configs`.
 Example flow
1. Deploy your application (Deployment + Service).
2. Create a ServiceMonitor that selects the Service (via labels) and specifies endpoints (port, path, interval).
3. The Prometheus Operator discovers the ServiceMonitor and adds targets to Prometheus’ scrape configuration.
Example manifests
* Service exposes the application on port 3000 with port name `web` and labels `job: node-api` and `app: api`.
* ServiceMonitor selects the Service by `matchLabels`, sets `jobLabel: job` (so the Prometheus job name is taken from the Service `job` label), and configures endpoints (scrape interval and metrics path).
Service manifest (api-service.yaml):
```yaml theme={null}
# api-service.yaml
apiVersion: v1
kind: Service
metadata:
name: api-service
labels:
job: node-api
app: api
spec:
type: ClusterIP
selector:
app: api
ports:
- name: web
protocol: TCP
port: 3000
targetPort: 3000
```
ServiceMonitor manifest (api-service-monitor.yaml):
```yaml theme={null}
# api-service-monitor.yaml
apiVersion: monitoring.coreos.com/v1
kind: ServiceMonitor
metadata:
name: api-service-monitor
labels:
release: prometheus
app: prometheus
spec:
jobLabel: job
endpoints:
- interval: 30s
port: web
path: /swagger-stats/metrics
selector:
matchLabels:
app: api
```
Prometheus discovers ServiceMonitors based on the Prometheus custom resource configuration. Check the Prometheus CR’s `serviceMonitorSelector` and `serviceMonitorNamespaceSelector` to know which ServiceMonitors (labels and namespaces) your Prometheus instance will use. When using the kube-prometheus-stack Helm chart, ServiceMonitors often need the label `release: prometheus`.
Verify Prometheus CR configuration
Inspect the Prometheus custom resource to see how it discovers ServiceMonitors:
```bash theme={null}
kubectl get prometheuses.monitoring.coreos.com -o yaml
```
Look for:
```yaml theme={null}
serviceMonitorNamespaceSelector: {}
serviceMonitorSelector:
matchLabels:
release: prometheus
```
If the Prometheus CR selects ServiceMonitors with `release: prometheus`, ensure your ServiceMonitor includes that label.
Apply the manifests
Apply the Service and ServiceMonitor (together or separately):
```bash theme={null}
kubectl apply -f api-deploy.yaml
```
Example output:
```bash theme={null}
deployment.apps/api-deployment unchanged
service/api-service unchanged
servicemonitor.monitoring.coreos.com/api-service-monitor created
```
Check ServiceMonitors:
```bash theme={null}
kubectl get servicemonitor
```
Verify targets in Prometheus
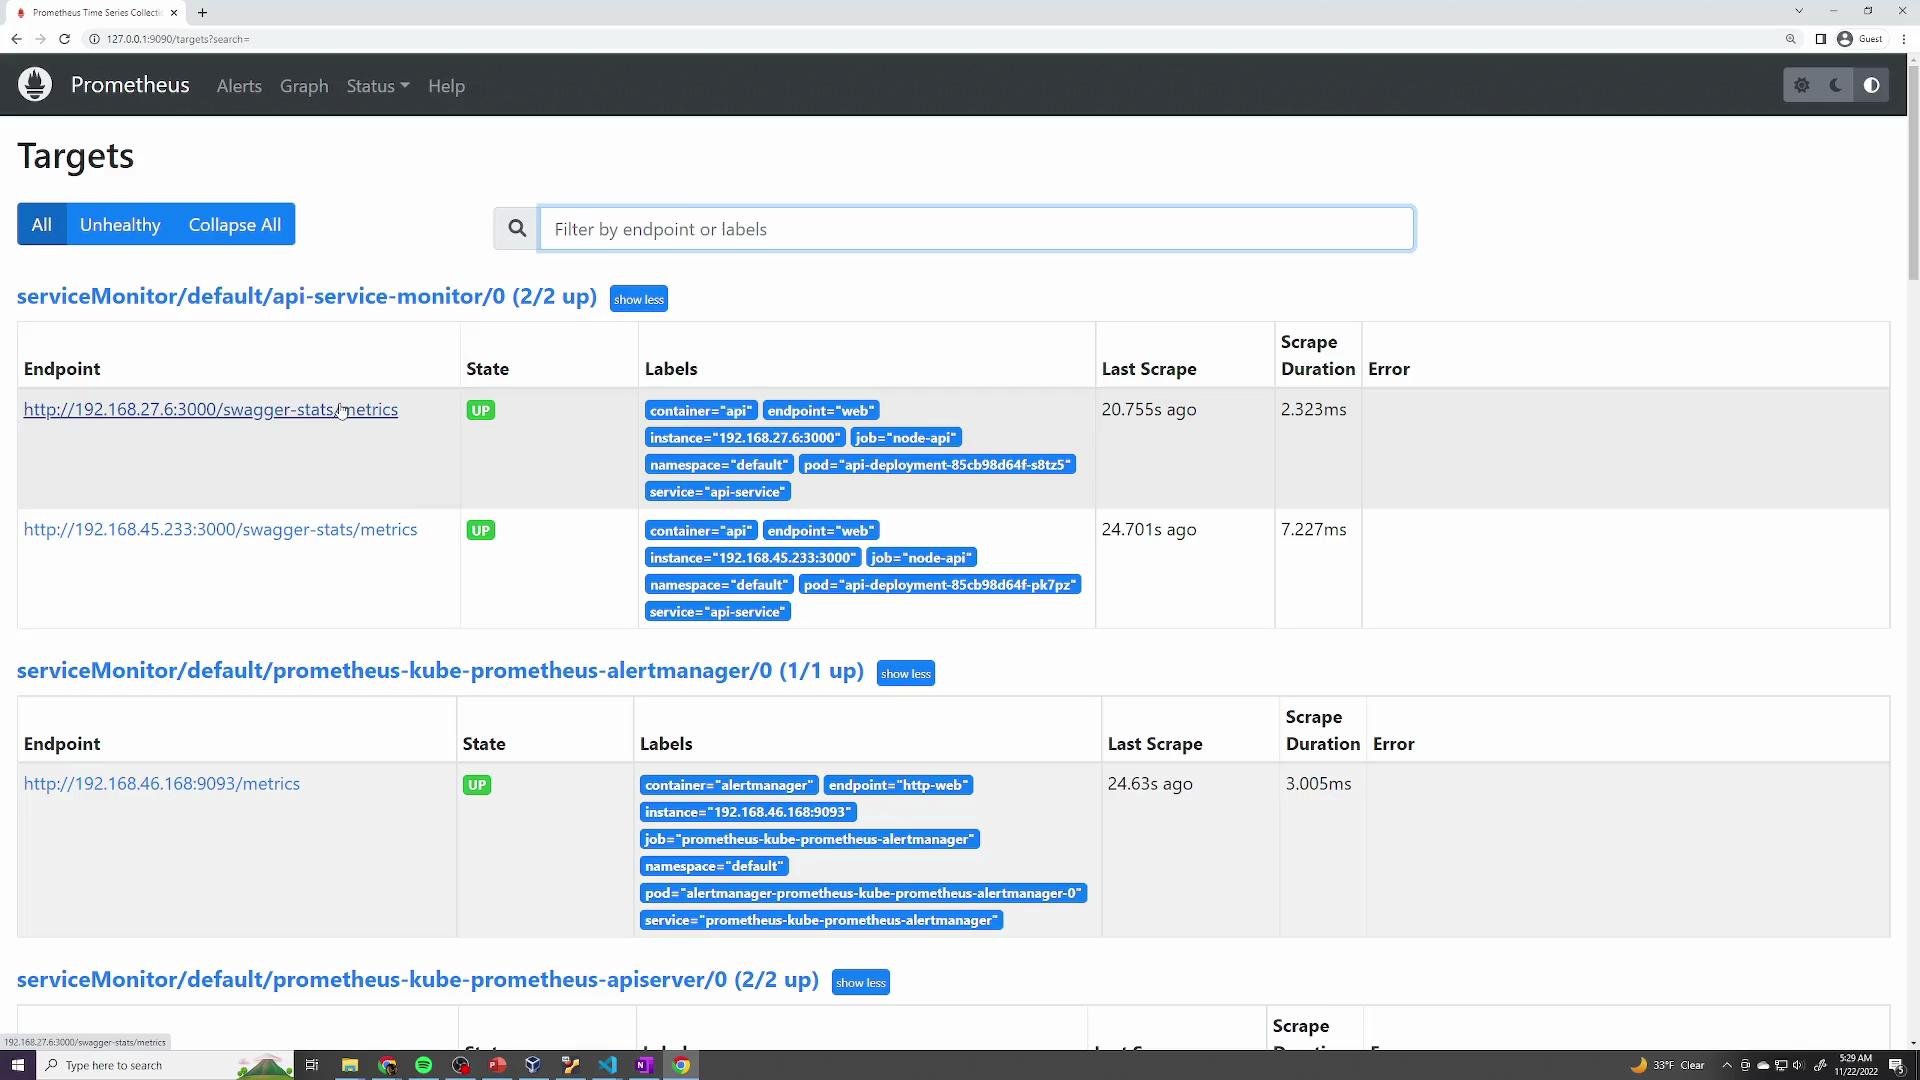
Open the Prometheus UI and navigate to Status → Targets. You should see a job corresponding to your ServiceMonitor, for example: `serviceMonitor/default/api-service-monitor/0`. A Deployment with multiple replicas will show multiple endpoints (one per pod).
Example flow
1. Deploy your application (Deployment + Service).
2. Create a ServiceMonitor that selects the Service (via labels) and specifies endpoints (port, path, interval).
3. The Prometheus Operator discovers the ServiceMonitor and adds targets to Prometheus’ scrape configuration.
Example manifests
* Service exposes the application on port 3000 with port name `web` and labels `job: node-api` and `app: api`.
* ServiceMonitor selects the Service by `matchLabels`, sets `jobLabel: job` (so the Prometheus job name is taken from the Service `job` label), and configures endpoints (scrape interval and metrics path).
Service manifest (api-service.yaml):
```yaml theme={null}
# api-service.yaml
apiVersion: v1
kind: Service
metadata:
name: api-service
labels:
job: node-api
app: api
spec:
type: ClusterIP
selector:
app: api
ports:
- name: web
protocol: TCP
port: 3000
targetPort: 3000
```
ServiceMonitor manifest (api-service-monitor.yaml):
```yaml theme={null}
# api-service-monitor.yaml
apiVersion: monitoring.coreos.com/v1
kind: ServiceMonitor
metadata:
name: api-service-monitor
labels:
release: prometheus
app: prometheus
spec:
jobLabel: job
endpoints:
- interval: 30s
port: web
path: /swagger-stats/metrics
selector:
matchLabels:
app: api
```
Prometheus discovers ServiceMonitors based on the Prometheus custom resource configuration. Check the Prometheus CR’s `serviceMonitorSelector` and `serviceMonitorNamespaceSelector` to know which ServiceMonitors (labels and namespaces) your Prometheus instance will use. When using the kube-prometheus-stack Helm chart, ServiceMonitors often need the label `release: prometheus`.
Verify Prometheus CR configuration
Inspect the Prometheus custom resource to see how it discovers ServiceMonitors:
```bash theme={null}
kubectl get prometheuses.monitoring.coreos.com -o yaml
```
Look for:
```yaml theme={null}
serviceMonitorNamespaceSelector: {}
serviceMonitorSelector:
matchLabels:
release: prometheus
```
If the Prometheus CR selects ServiceMonitors with `release: prometheus`, ensure your ServiceMonitor includes that label.
Apply the manifests
Apply the Service and ServiceMonitor (together or separately):
```bash theme={null}
kubectl apply -f api-deploy.yaml
```
Example output:
```bash theme={null}
deployment.apps/api-deployment unchanged
service/api-service unchanged
servicemonitor.monitoring.coreos.com/api-service-monitor created
```
Check ServiceMonitors:
```bash theme={null}
kubectl get servicemonitor
```
Verify targets in Prometheus
Open the Prometheus UI and navigate to Status → Targets. You should see a job corresponding to your ServiceMonitor, for example: `serviceMonitor/default/api-service-monitor/0`. A Deployment with multiple replicas will show multiple endpoints (one per pod).
 Querying metrics
Confirm metrics ingestion by querying Prometheus for metrics associated with your job label (`job="node-api"`). Example metric lines returned from Prometheus:
```text theme={null}
api_request_duration_milliseconds_bucket{code="304", container="api", endpoint="web", instance="192.168.45.233:3000", job="node-api", le="25", method="GET", namespace="default", path="/comments", pod="api-deployment-85cb98d64f-pk7pz", service="api-service"} ...
api_request_duration_milliseconds_bucket{code="404", container="api", endpoint="web", instance="192.168.45.233:3000", job="node-api", le="5", method="GET", namespace="default", path="/messages", pod="api-deployment-85cb98d64f-pk7pz", service="api-service"} ...
```
A useful quick check in Prometheus: `up{job="node-api"}` — a value of `1` indicates a healthy scrape target.
Inspect the generated Prometheus configuration
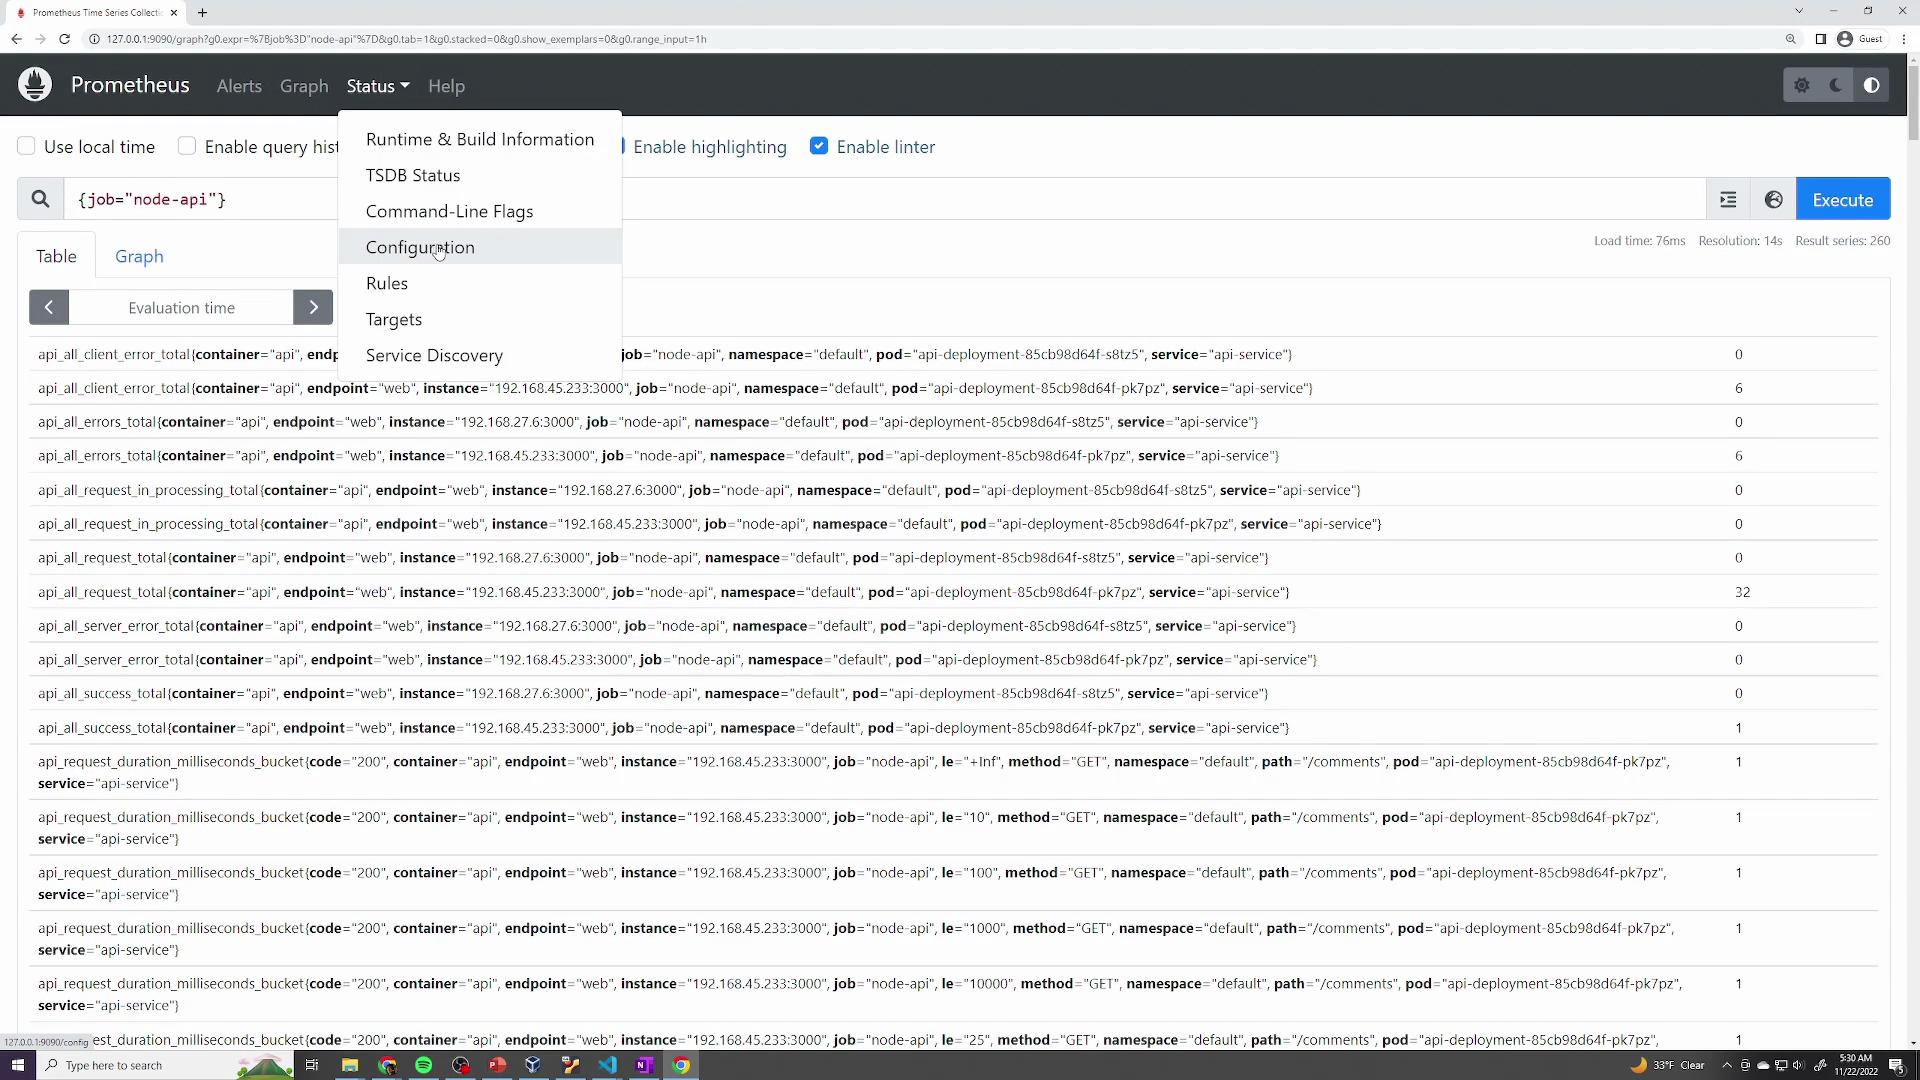
The Prometheus Operator converts ServiceMonitors into `scrape_configs`. In the Prometheus UI → Status → Configuration, search for the job name (e.g., `serviceMonitor/default/api-service-monitor/0`) to view the generated config. This shows how your ServiceMonitor settings translate into Prometheus scrape settings and relabel rules.
Querying metrics
Confirm metrics ingestion by querying Prometheus for metrics associated with your job label (`job="node-api"`). Example metric lines returned from Prometheus:
```text theme={null}
api_request_duration_milliseconds_bucket{code="304", container="api", endpoint="web", instance="192.168.45.233:3000", job="node-api", le="25", method="GET", namespace="default", path="/comments", pod="api-deployment-85cb98d64f-pk7pz", service="api-service"} ...
api_request_duration_milliseconds_bucket{code="404", container="api", endpoint="web", instance="192.168.45.233:3000", job="node-api", le="5", method="GET", namespace="default", path="/messages", pod="api-deployment-85cb98d64f-pk7pz", service="api-service"} ...
```
A useful quick check in Prometheus: `up{job="node-api"}` — a value of `1` indicates a healthy scrape target.
Inspect the generated Prometheus configuration
The Prometheus Operator converts ServiceMonitors into `scrape_configs`. In the Prometheus UI → Status → Configuration, search for the job name (e.g., `serviceMonitor/default/api-service-monitor/0`) to view the generated config. This shows how your ServiceMonitor settings translate into Prometheus scrape settings and relabel rules.
 Example generated snippet:
```yaml theme={null}
scrape_configs:
- job_name: serviceMonitor/default/api-service-monitor/0
honor_timestamps: true
scrape_interval: 30s
scrape_timeout: 1m
metrics_path: /swagger-stats/metrics
scheme: http
follow_redirects: true
enable_http2: true
relabel_configs:
- source_labels: [job]
regex: (.*)
target_label: __tmp_prometheus_job_name
replacement: $1
action: replace
- source_labels: [__meta_kubernetes_service_label_app, __meta_kubernetes_service_labelpresent_app]
separator: ;
regex: (api);true
replacement: $1
action: keep
- source_labels: [__meta_kubernetes_endpoint_port_name]
regex: web
replacement: $1
action: keep
- source_labels: [__meta_kubernetes_endpoint_address_target_kind, __meta_kubernetes_endpoint_address_target_name]
separator: ;
regex: Node;(.*)
target_label: node
replacement: $1
action: replace
- source_labels: [__meta_kubernetes_endpoint_address_target_kind, __meta_kubernetes_endpoint_address_target_name]
separator: ;
regex: Pod;(.*)
target_label: pod
replacement: $1
action: replace
- source_labels: [__meta_kubernetes_namespace]
regex: (.*)
target_label: namespace
replacement: $1
action: replace
- source_labels: [__meta_kubernetes_service_name]
regex: (.*)
target_label: service
replacement: $1
action: replace
```
All configuration declared in the ServiceMonitor (port name, path, interval, jobLabel and selector) will be reflected in the generated Prometheus scrape config and relabel rules.
Namespaces and labels matter. Prometheus discovers ServiceMonitors according to the Prometheus CR’s selectors—if your ServiceMonitor is in a different namespace or lacks the expected label, Prometheus will not pick it up. Also ensure required RBAC permissions are in place for Prometheus to read ServiceMonitor resources in the target namespaces.
Summary
* ServiceMonitors provide a declarative method to register Prometheus scrape targets in Kubernetes.
* Make sure the Prometheus CR’s `serviceMonitorSelector` and `serviceMonitorNamespaceSelector` include the labels and namespaces of your ServiceMonitors.
* Create Services with meaningful labels and named ports, then create ServiceMonitors that select those Services and define scrape parameters (path, port, interval, jobLabel).
* Verify in Prometheus UI → Status → Targets that the job and endpoints appear and metrics are being scraped.
Links and references
* Prometheus Operator: [https://prometheus-operator.dev](https://prometheus-operator.dev)
* kube-prometheus-stack Helm chart: [https://github.com/prometheus-community/helm-charts/tree/main/charts/kube-prometheus-stack](https://github.com/prometheus-community/helm-charts/tree/main/charts/kube-prometheus-stack)
* Prometheus documentation: [https://prometheus.io/docs/](https://prometheus.io/docs/)
Example generated snippet:
```yaml theme={null}
scrape_configs:
- job_name: serviceMonitor/default/api-service-monitor/0
honor_timestamps: true
scrape_interval: 30s
scrape_timeout: 1m
metrics_path: /swagger-stats/metrics
scheme: http
follow_redirects: true
enable_http2: true
relabel_configs:
- source_labels: [job]
regex: (.*)
target_label: __tmp_prometheus_job_name
replacement: $1
action: replace
- source_labels: [__meta_kubernetes_service_label_app, __meta_kubernetes_service_labelpresent_app]
separator: ;
regex: (api);true
replacement: $1
action: keep
- source_labels: [__meta_kubernetes_endpoint_port_name]
regex: web
replacement: $1
action: keep
- source_labels: [__meta_kubernetes_endpoint_address_target_kind, __meta_kubernetes_endpoint_address_target_name]
separator: ;
regex: Node;(.*)
target_label: node
replacement: $1
action: replace
- source_labels: [__meta_kubernetes_endpoint_address_target_kind, __meta_kubernetes_endpoint_address_target_name]
separator: ;
regex: Pod;(.*)
target_label: pod
replacement: $1
action: replace
- source_labels: [__meta_kubernetes_namespace]
regex: (.*)
target_label: namespace
replacement: $1
action: replace
- source_labels: [__meta_kubernetes_service_name]
regex: (.*)
target_label: service
replacement: $1
action: replace
```
All configuration declared in the ServiceMonitor (port name, path, interval, jobLabel and selector) will be reflected in the generated Prometheus scrape config and relabel rules.
Namespaces and labels matter. Prometheus discovers ServiceMonitors according to the Prometheus CR’s selectors—if your ServiceMonitor is in a different namespace or lacks the expected label, Prometheus will not pick it up. Also ensure required RBAC permissions are in place for Prometheus to read ServiceMonitor resources in the target namespaces.
Summary
* ServiceMonitors provide a declarative method to register Prometheus scrape targets in Kubernetes.
* Make sure the Prometheus CR’s `serviceMonitorSelector` and `serviceMonitorNamespaceSelector` include the labels and namespaces of your ServiceMonitors.
* Create Services with meaningful labels and named ports, then create ServiceMonitors that select those Services and define scrape parameters (path, port, interval, jobLabel).
* Verify in Prometheus UI → Status → Targets that the job and endpoints appear and metrics are being scraped.
Links and references
* Prometheus Operator: [https://prometheus-operator.dev](https://prometheus-operator.dev)
* kube-prometheus-stack Helm chart: [https://github.com/prometheus-community/helm-charts/tree/main/charts/kube-prometheus-stack](https://github.com/prometheus-community/helm-charts/tree/main/charts/kube-prometheus-stack)
* Prometheus documentation: [https://prometheus.io/docs/](https://prometheus.io/docs/)