> ## Documentation Index
> Fetch the complete documentation index at: https://notes.kodekloud.com/llms.txt
> Use this file to discover all available pages before exploring further.
# Functions
> Overview of PromQL functions with examples and practical tips covering math, time, conversions, sorting, presence checks, and counter rate calculations such as rate and irate.
PromQL includes many built-in functions for common needs: numeric transformations, time/date extraction, label and metric manipulation, sorting, presence checking, and computing rates for counters. Below we walk through important categories with concise examples and practical tips for queries and alerts.
 Below we cover math-based functions, date/time helpers, scalar/vector conversions, sorting, presence checks, and counter-rate calculations.
## Quick reference: common function categories
| Category | Purpose | Examples |
| --------------: | ------------------------------------------------------------- | ------------------------------------------ |
| Math & numeric | Basic numeric transformations | `ceil(v)`, `floor(v)`, `abs(v)` |
| Time/date | Extract components of evaluation time | `time()`, `minute()`, `hour()` |
| Conversions | Convert between scalar and instant vector | `scalar(v)`, `vector(s)` |
| Sorting | Sort instant vectors by value | `sort(v)`, `sort_desc(v)` |
| Presence checks | Detect missing or present series | `absent(v)`, `present_over_time(v[range])` |
| Counter rates | Convert monotonically increasing counters to per-second rates | `rate(v[range])`, `irate(v[range])` |
## Math-based functions
These functions operate on each sample value in an instant vector.
| Function | Behavior |
| ---------- | ----------------------------------------------- |
| `ceil(v)` | Round each sample up to the next integer. |
| `floor(v)` | Round each sample down to the previous integer. |
| `abs(v)` | Convert each sample to its absolute value. |
Example (instant vector values and results shown inline):
```bash theme={null}
# Raw metric (instant vector)
node_cpu_seconds_total
# => {cpu="0", mode="idle"} 115.12
# => {cpu="0", mode="irq"} 87.4482
# Apply ceil()
ceil(node_cpu_seconds_total)
# => {cpu="0", mode="idle"} 116
# => {cpu="0", mode="irq"} 88
# Apply floor()
floor(node_cpu_seconds_total)
# => {cpu="0", mode="idle"} 115
# => {cpu="0", mode="irq"} 87
# Example using abs() with an arithmetic expression
# This computes the absolute value of (1 - sample).
abs(1 - node_cpu_seconds_total)
# => {cpu="0", mode="idle"} 114.12 # abs(1 - 115.12)
# => {cpu="0", mode="irq"} 86.4482 # abs(1 - 87.4482)
# => {cpu="0", mode="steal"} 43.245 # abs(1 - 44.245)
```
## Date and time functions
Prometheus exposes functions to extract parts of the current evaluation time. These are useful for calendar-aware calculations, scheduling logic in queries, or tagging alerts with time components.
Key functions:
* `time()` — current Unix time in seconds (float).
* `minute()`, `hour()`, `day_of_week()`, `day_of_month()`, `days_in_month()`, `month()`, `year()` — return the specified component of the current evaluation timestamp.
Example (if evaluation time is Thursday, September 22, 2022 at 15:07):
```plaintext theme={null}
Expression => result
---------------------------
minute() => 07
hour() => 15
day_of_week() => 4
day_of_month() => 22
days_in_month() => 30
month() => 09
year() => 2022
```
## Converting between scalars and vectors
* `scalar(v)` — Converts an instant vector `v` containing exactly one sample into a scalar value. If `v` contains more than one element, the result is `NaN`.
* `vector(s)` — Converts a scalar `s` into an instant vector containing a single sample (useful for combining scalar thresholds with vector operations).
Use these when you need to mix scalar math or constants with vector expressions.
## Sorting
Sort instant vectors by the sample values.
* `sort(v)` — ascending order.
* `sort_desc(v)` — descending order.
Example:
```bash theme={null}
# Sorted ascending
sort(node_filesystem_avail_bytes)
# => node_filesystem_avail_bytes{device="gvfsd-fuse", fstype="fuse.gvfsd-fuse", instance="node1"} 0
# => node_filesystem_avail_bytes{device="tmpfs", fstype="tmpfs", instance="node1"} 5238784
# => node_filesystem_avail_bytes{device="/dev/sda2", fstype="vfat", instance="node1"} 531341312
# => node_filesystem_avail_bytes{device="tmpfs", fstype="tmpfs", instance="node1"} 725422080
# => node_filesystem_avail_bytes{device="tmpfs", fstype="tmpfs", instance="node1"} 726319104
# Sorted descending
sort_desc(node_filesystem_avail_bytes)
# => highest values first...
```
## Presence checks: absent / present (and their \_over\_time variants)
These functions help detect missing series or whether a series has samples inside a specified range.
* `absent(v)` — If `v` contains any elements, returns an empty vector. If no elements exist, returns a single-element vector with the value `1` and the labels taken from the expression.
* `absent_over_time(v[range])` — Returns `1` for each series that has no samples inside the specified range; returns nothing if at least one sample exists.
* `present_over_time(v[range])` — Returns `1` for each series that has at least one sample in the range; otherwise returns nothing for that series.
Examples:
```bash theme={null}
# If the series exists at least once in the given range:
present_over_time(node_filesystem_avail_bytes[5m])
# If the series has no samples in the range:
absent_over_time(node_memory_Active_bytes[1h])
# => {}
```
From the Prometheus docs (behavior illustrations):
```bash theme={null}
absent(nonexistent{job="myjob"})
absent(nonexistent{job="myjob", instance=".*"})
absent(sum(nonexistent{job="myjob"}))
# => {}
```
Refer to the Prometheus documentation under [Querying → Functions](https://prometheus.io/docs/prometheus/latest/querying/functions/) for a complete list of functions and their exact semantics.
Below we cover math-based functions, date/time helpers, scalar/vector conversions, sorting, presence checks, and counter-rate calculations.
## Quick reference: common function categories
| Category | Purpose | Examples |
| --------------: | ------------------------------------------------------------- | ------------------------------------------ |
| Math & numeric | Basic numeric transformations | `ceil(v)`, `floor(v)`, `abs(v)` |
| Time/date | Extract components of evaluation time | `time()`, `minute()`, `hour()` |
| Conversions | Convert between scalar and instant vector | `scalar(v)`, `vector(s)` |
| Sorting | Sort instant vectors by value | `sort(v)`, `sort_desc(v)` |
| Presence checks | Detect missing or present series | `absent(v)`, `present_over_time(v[range])` |
| Counter rates | Convert monotonically increasing counters to per-second rates | `rate(v[range])`, `irate(v[range])` |
## Math-based functions
These functions operate on each sample value in an instant vector.
| Function | Behavior |
| ---------- | ----------------------------------------------- |
| `ceil(v)` | Round each sample up to the next integer. |
| `floor(v)` | Round each sample down to the previous integer. |
| `abs(v)` | Convert each sample to its absolute value. |
Example (instant vector values and results shown inline):
```bash theme={null}
# Raw metric (instant vector)
node_cpu_seconds_total
# => {cpu="0", mode="idle"} 115.12
# => {cpu="0", mode="irq"} 87.4482
# Apply ceil()
ceil(node_cpu_seconds_total)
# => {cpu="0", mode="idle"} 116
# => {cpu="0", mode="irq"} 88
# Apply floor()
floor(node_cpu_seconds_total)
# => {cpu="0", mode="idle"} 115
# => {cpu="0", mode="irq"} 87
# Example using abs() with an arithmetic expression
# This computes the absolute value of (1 - sample).
abs(1 - node_cpu_seconds_total)
# => {cpu="0", mode="idle"} 114.12 # abs(1 - 115.12)
# => {cpu="0", mode="irq"} 86.4482 # abs(1 - 87.4482)
# => {cpu="0", mode="steal"} 43.245 # abs(1 - 44.245)
```
## Date and time functions
Prometheus exposes functions to extract parts of the current evaluation time. These are useful for calendar-aware calculations, scheduling logic in queries, or tagging alerts with time components.
Key functions:
* `time()` — current Unix time in seconds (float).
* `minute()`, `hour()`, `day_of_week()`, `day_of_month()`, `days_in_month()`, `month()`, `year()` — return the specified component of the current evaluation timestamp.
Example (if evaluation time is Thursday, September 22, 2022 at 15:07):
```plaintext theme={null}
Expression => result
---------------------------
minute() => 07
hour() => 15
day_of_week() => 4
day_of_month() => 22
days_in_month() => 30
month() => 09
year() => 2022
```
## Converting between scalars and vectors
* `scalar(v)` — Converts an instant vector `v` containing exactly one sample into a scalar value. If `v` contains more than one element, the result is `NaN`.
* `vector(s)` — Converts a scalar `s` into an instant vector containing a single sample (useful for combining scalar thresholds with vector operations).
Use these when you need to mix scalar math or constants with vector expressions.
## Sorting
Sort instant vectors by the sample values.
* `sort(v)` — ascending order.
* `sort_desc(v)` — descending order.
Example:
```bash theme={null}
# Sorted ascending
sort(node_filesystem_avail_bytes)
# => node_filesystem_avail_bytes{device="gvfsd-fuse", fstype="fuse.gvfsd-fuse", instance="node1"} 0
# => node_filesystem_avail_bytes{device="tmpfs", fstype="tmpfs", instance="node1"} 5238784
# => node_filesystem_avail_bytes{device="/dev/sda2", fstype="vfat", instance="node1"} 531341312
# => node_filesystem_avail_bytes{device="tmpfs", fstype="tmpfs", instance="node1"} 725422080
# => node_filesystem_avail_bytes{device="tmpfs", fstype="tmpfs", instance="node1"} 726319104
# Sorted descending
sort_desc(node_filesystem_avail_bytes)
# => highest values first...
```
## Presence checks: absent / present (and their \_over\_time variants)
These functions help detect missing series or whether a series has samples inside a specified range.
* `absent(v)` — If `v` contains any elements, returns an empty vector. If no elements exist, returns a single-element vector with the value `1` and the labels taken from the expression.
* `absent_over_time(v[range])` — Returns `1` for each series that has no samples inside the specified range; returns nothing if at least one sample exists.
* `present_over_time(v[range])` — Returns `1` for each series that has at least one sample in the range; otherwise returns nothing for that series.
Examples:
```bash theme={null}
# If the series exists at least once in the given range:
present_over_time(node_filesystem_avail_bytes[5m])
# If the series has no samples in the range:
absent_over_time(node_memory_Active_bytes[1h])
# => {}
```
From the Prometheus docs (behavior illustrations):
```bash theme={null}
absent(nonexistent{job="myjob"})
absent(nonexistent{job="myjob", instance=".*"})
absent(sum(nonexistent{job="myjob"}))
# => {}
```
Refer to the Prometheus documentation under [Querying → Functions](https://prometheus.io/docs/prometheus/latest/querying/functions/) for a complete list of functions and their exact semantics.
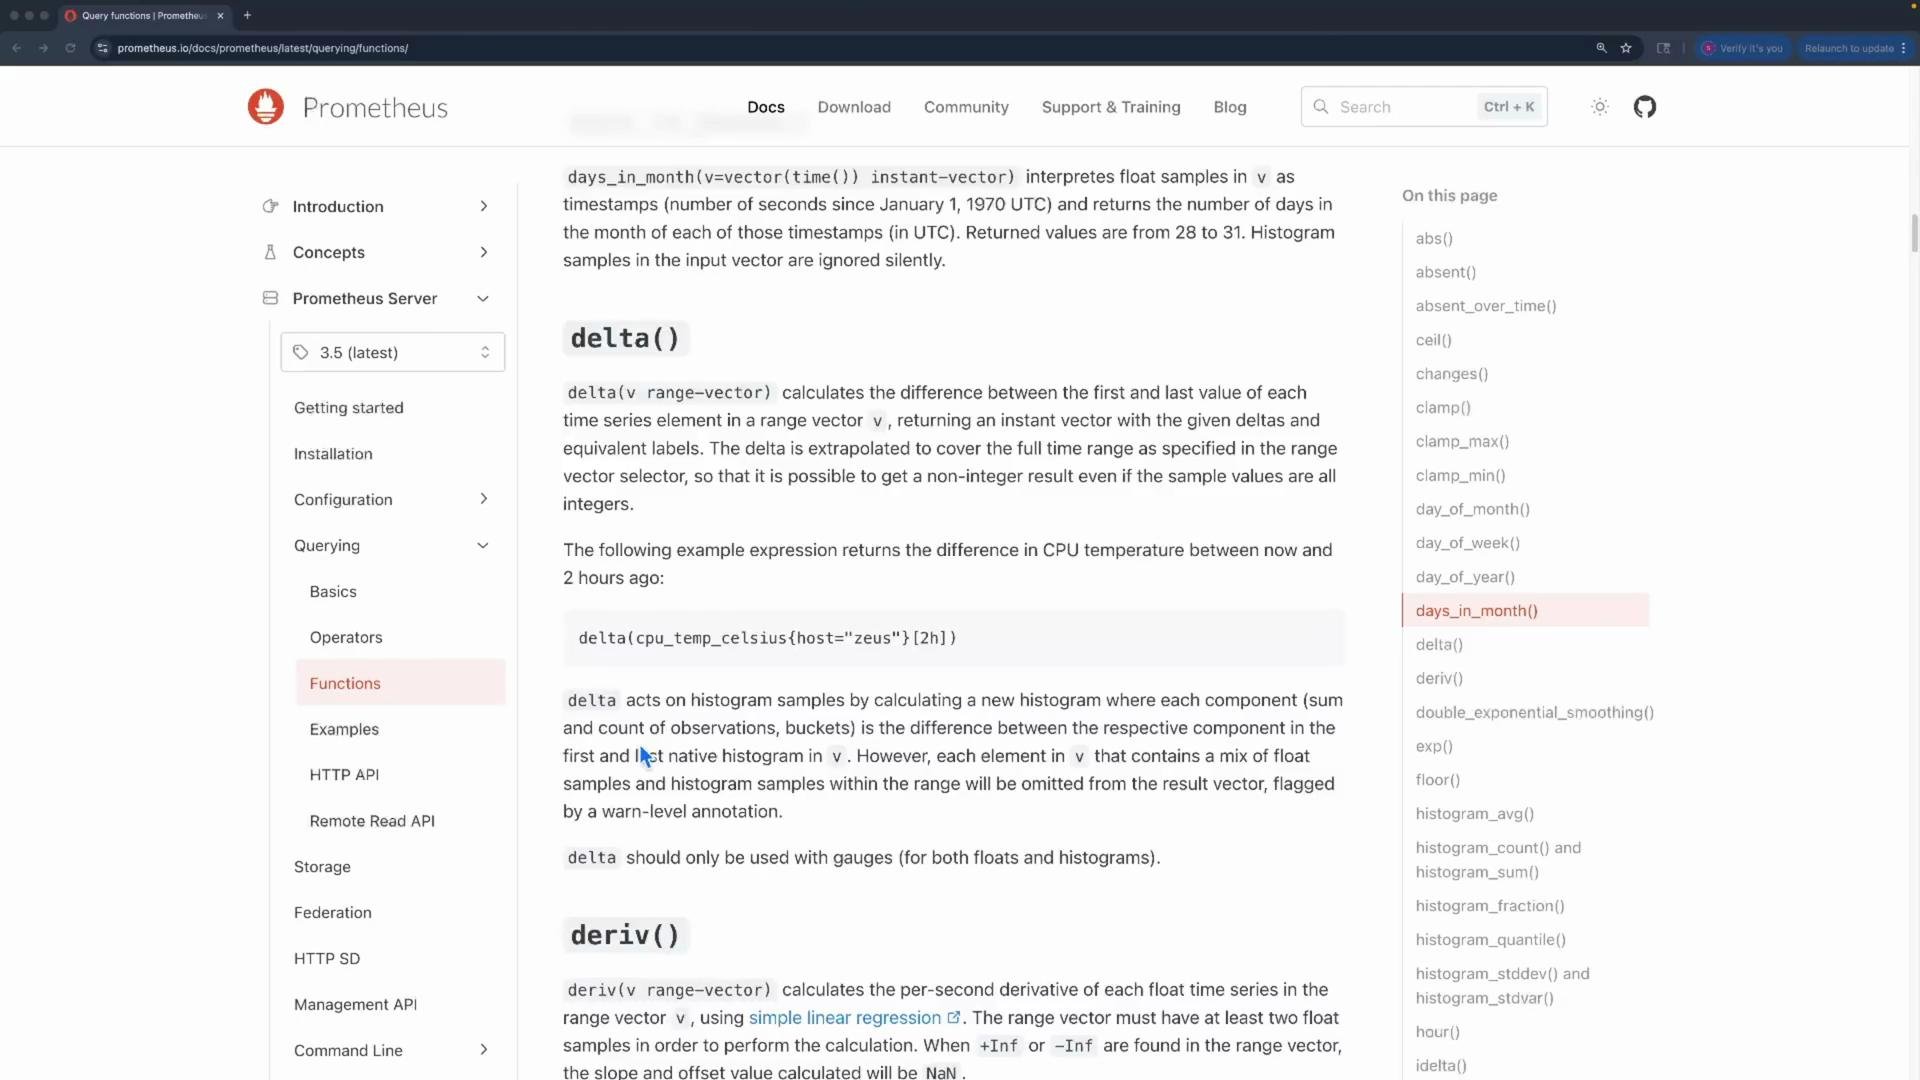 There are many more functions (`delta`, `deriv`, `exp`, etc.). The names tend to be descriptive; trying examples in the Prometheus console is an effective way to learn them.
## Counters and rate calculations
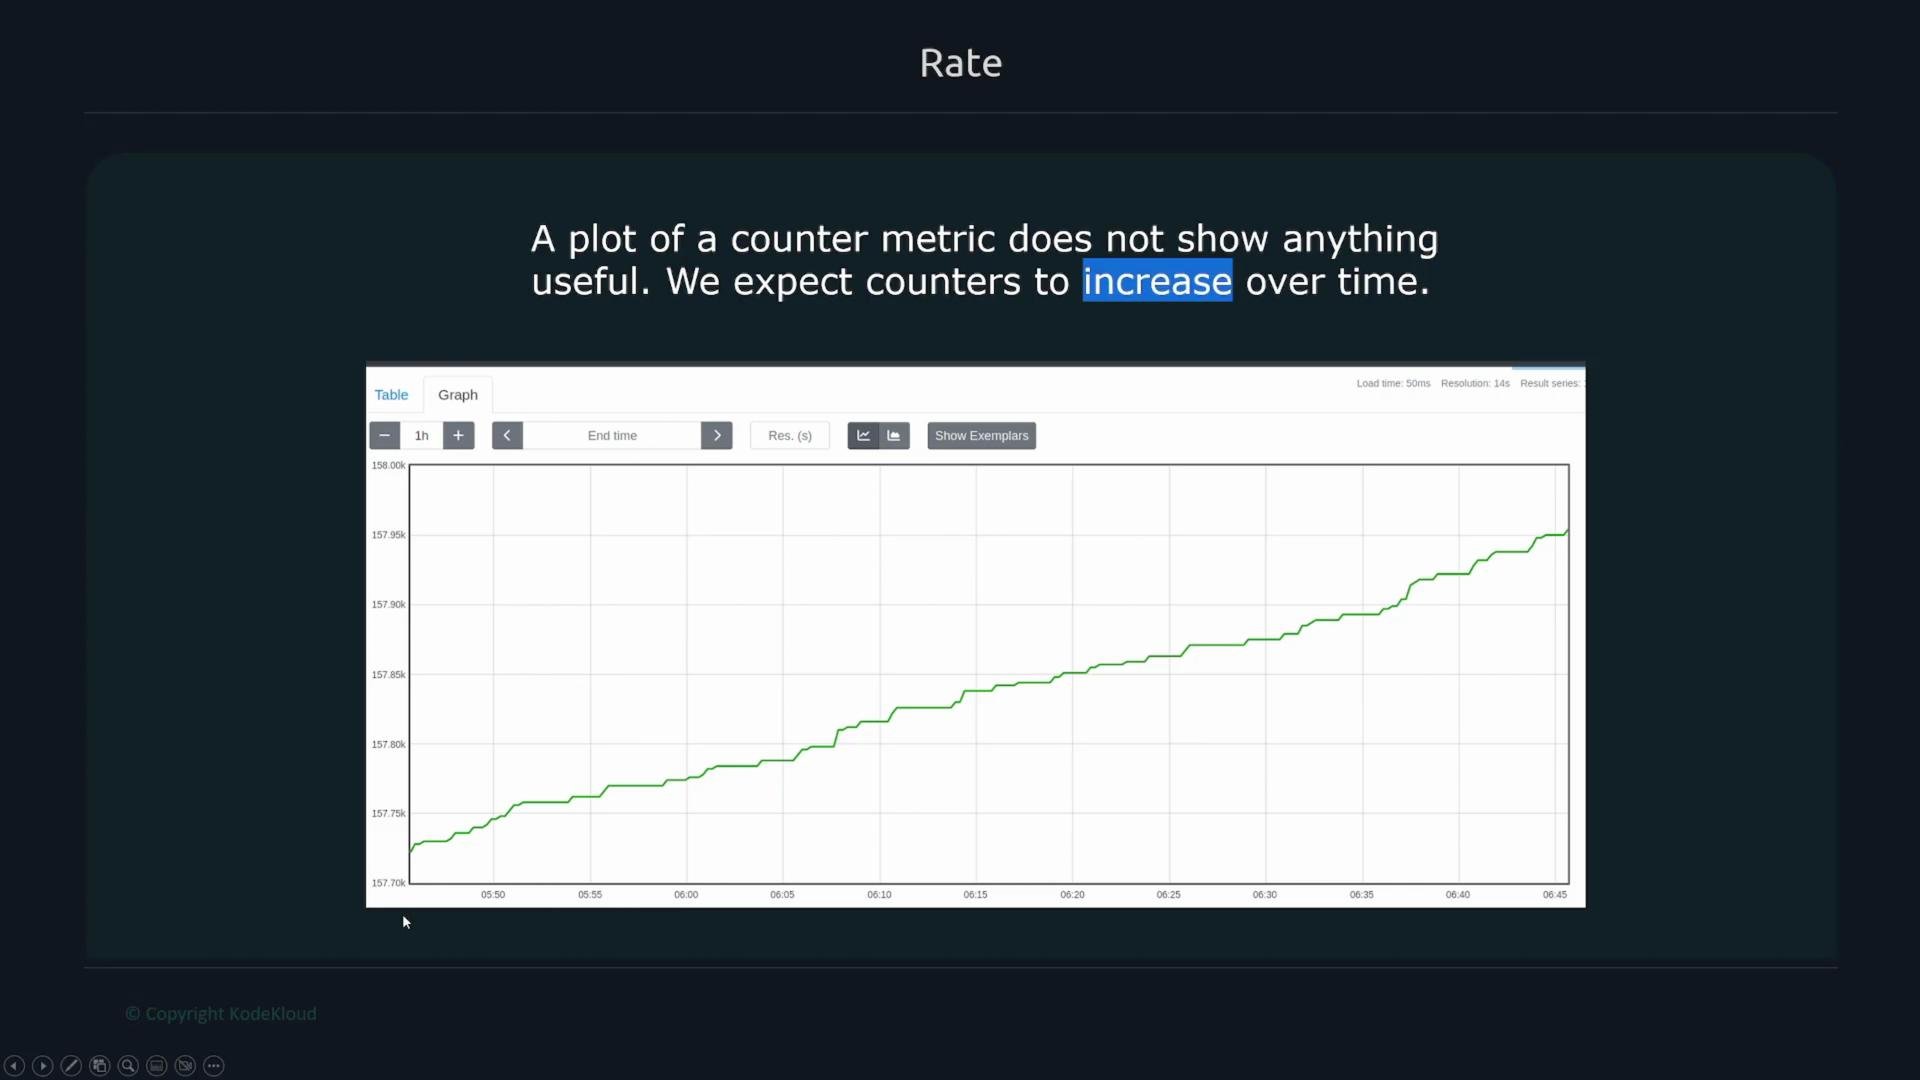
Counters are monotonically increasing metrics (e.g., bytes sent, requests served). Plotting the raw counter typically shows a continuously rising line, which is often not as useful as the rate of change.
There are many more functions (`delta`, `deriv`, `exp`, etc.). The names tend to be descriptive; trying examples in the Prometheus console is an effective way to learn them.
## Counters and rate calculations
Counters are monotonically increasing metrics (e.g., bytes sent, requests served). Plotting the raw counter typically shows a continuously rising line, which is often not as useful as the rate of change.
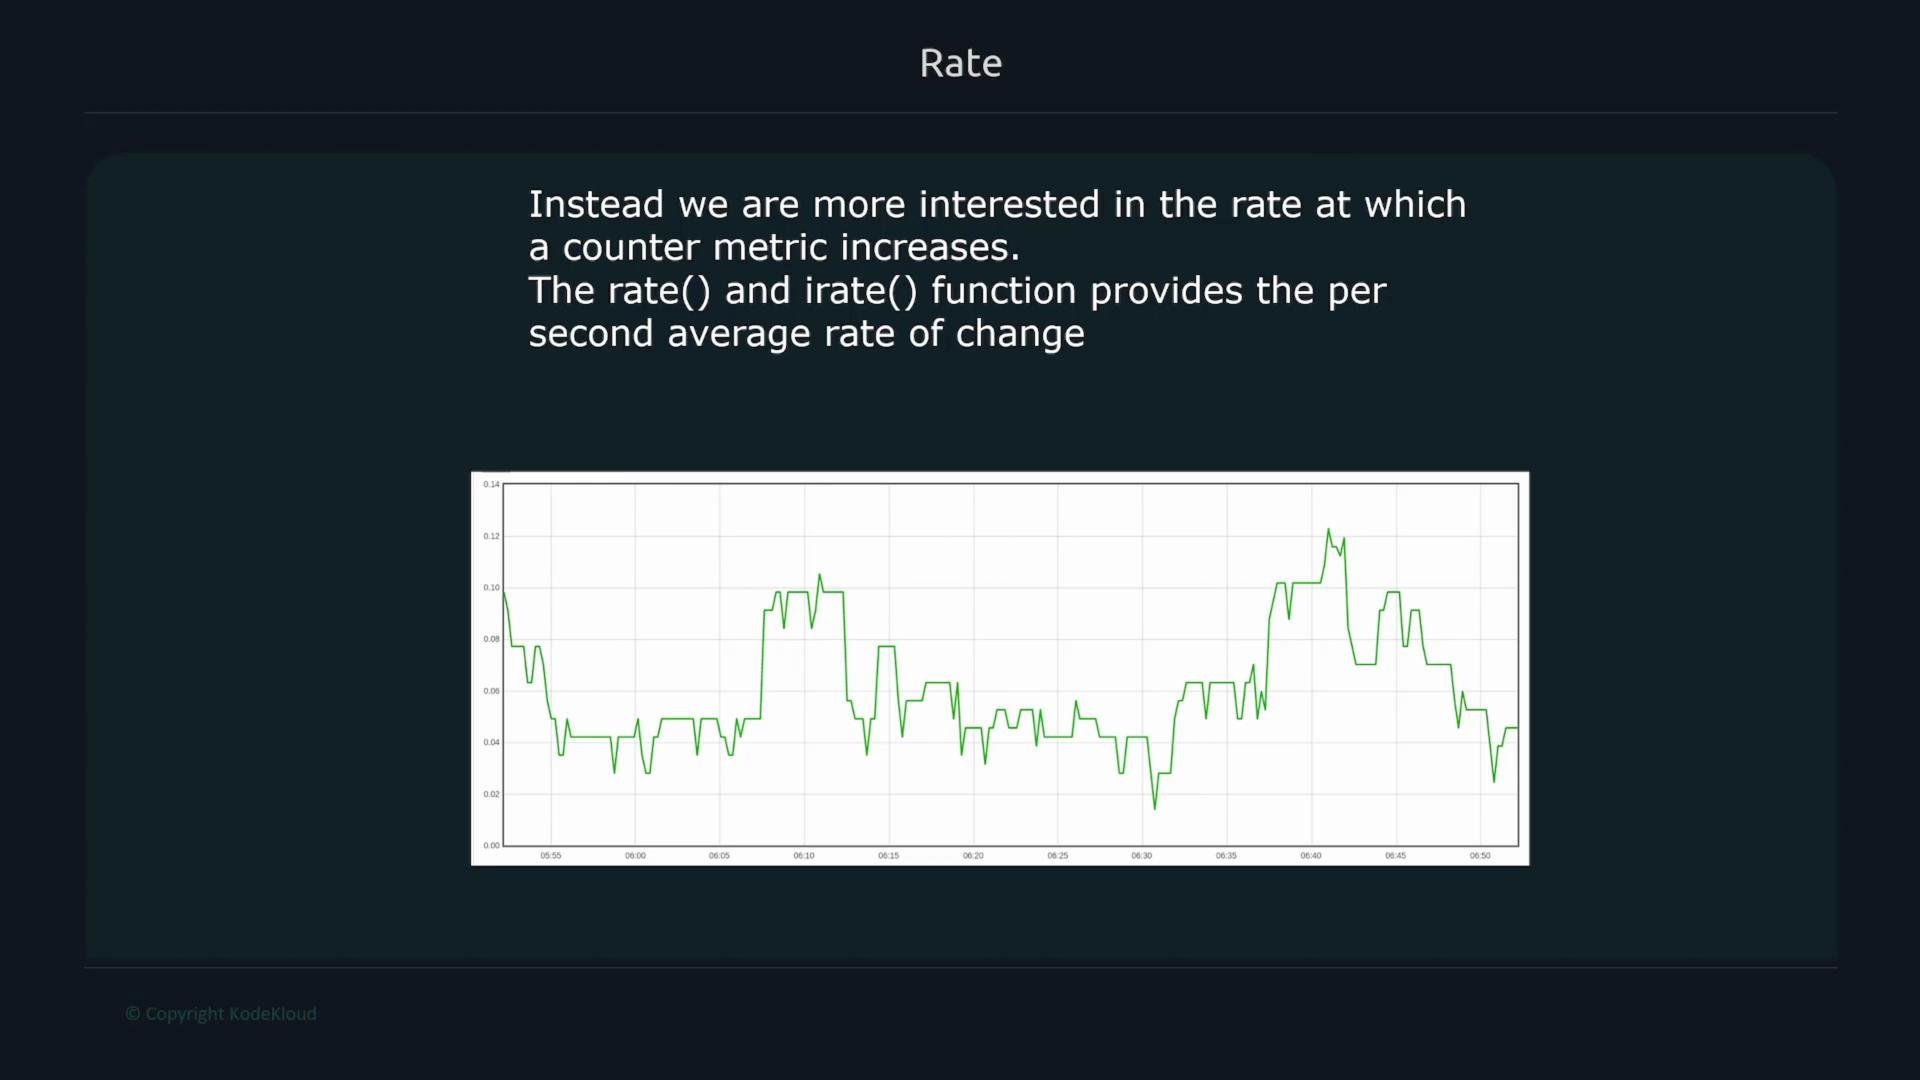
 Prometheus provides two primary functions to convert counters to per-second rates:
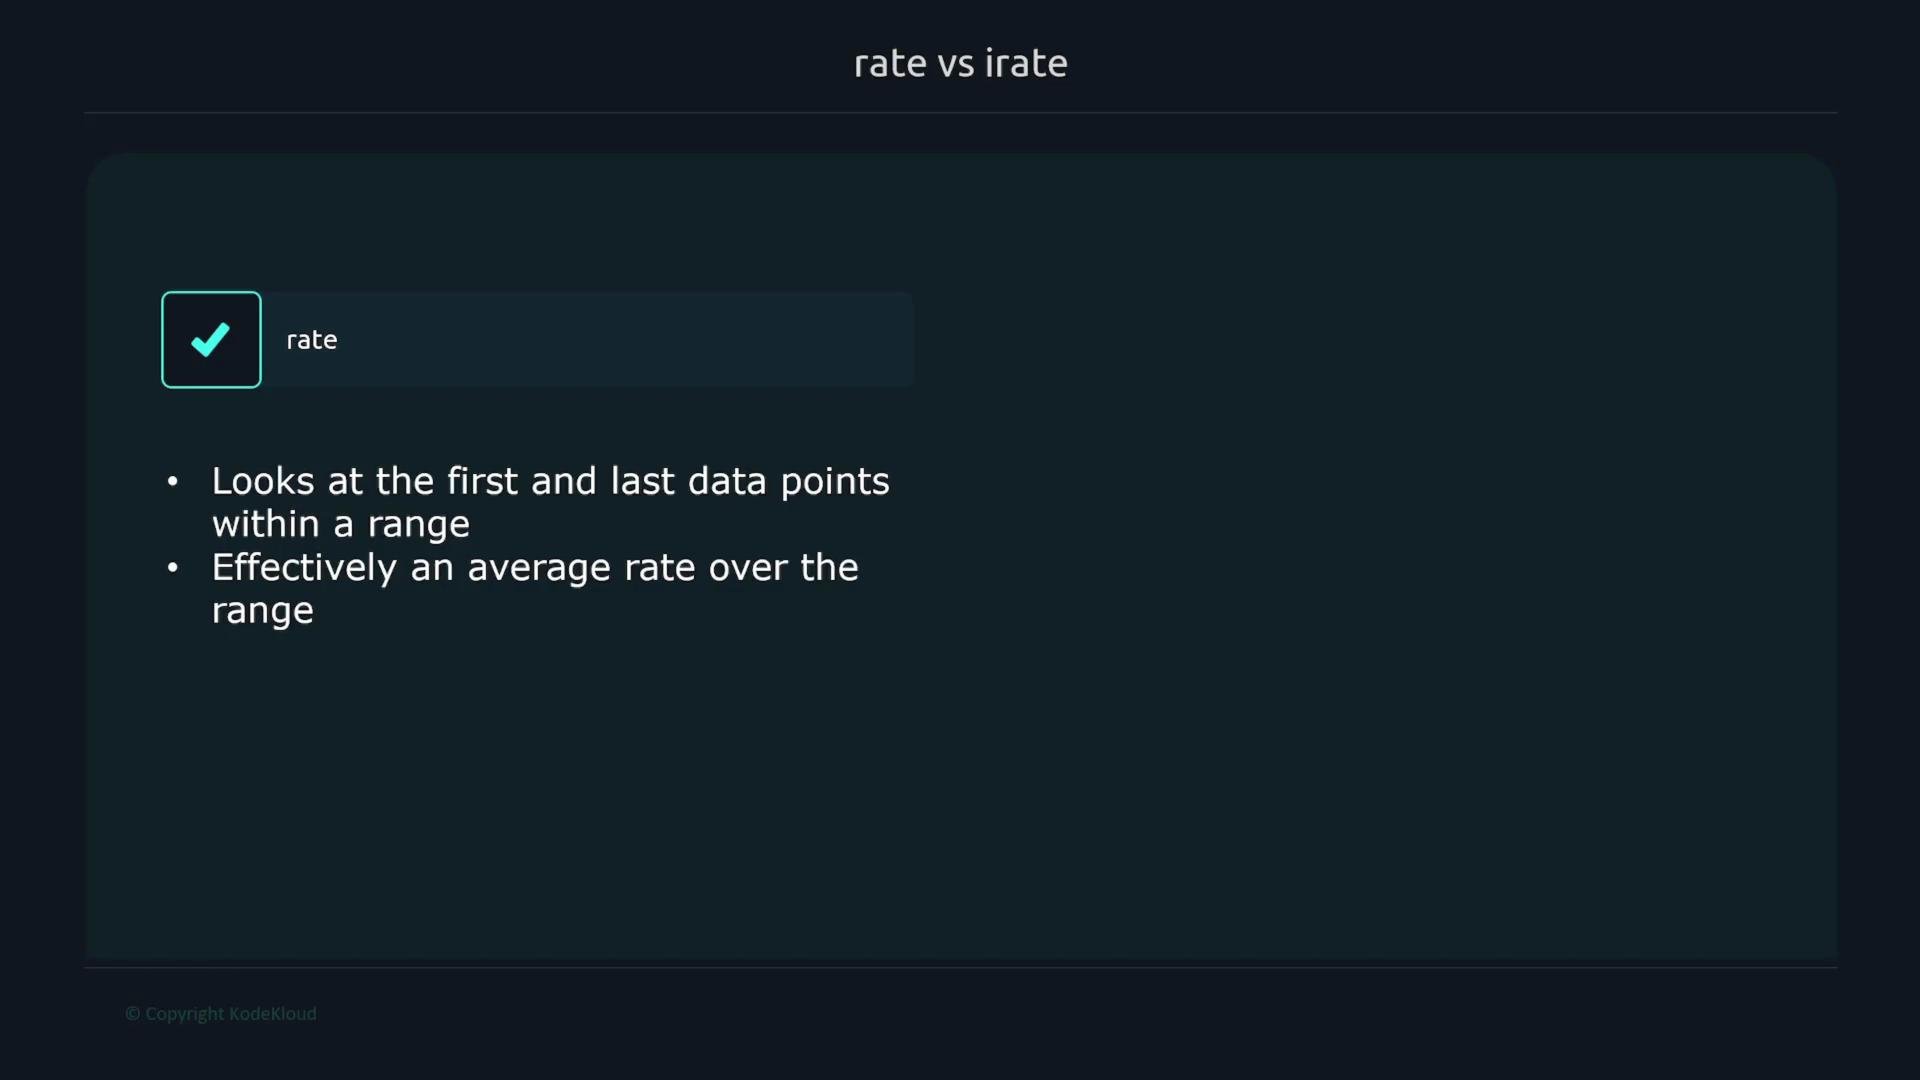
* `rate(v[range])` — computes the average per-second rate of increase across the provided time range. It uses the first and last sample of the range (accounting for counter resets).
* `irate(v[range])` — computes an instant rate using only the last two samples in the range (i.e., slope between the most recent samples).
Prometheus provides two primary functions to convert counters to per-second rates:
* `rate(v[range])` — computes the average per-second rate of increase across the provided time range. It uses the first and last sample of the range (accounting for counter resets).
* `irate(v[range])` — computes an instant rate using only the last two samples in the range (i.e., slope between the most recent samples).
 How `rate()` works (conceptual):
* `rate(http_errors[1m])` divides the series into overlapping 1-minute windows for each evaluation.
* If the scrape interval is 15s, each 1-minute window typically contains 4 samples.
* For each window, `rate()` computes (last\_sample - first\_sample) / window\_seconds, yielding a per-second average across the window.
Numeric illustration (one 1-minute window):
```plaintext theme={null}
samples in window: 1.2, 2.3, 3.1, 3.3
first = 1.2, last = 3.3
difference = 3.3 - 1.2 = 2.1
rate = 2.1 / 60 = 0.035 (per second)
```
How `irate()` differs:
* `irate(http_errors[1m])` still evaluates over the 1-minute range, but uses the last two samples within that window.
* Rate is (last - second\_last) / time\_difference\_between\_these\_two\_samples (often equal to the scrape interval, e.g., 15s).
Example usage:
```bash theme={null}
# Instant rate using the last two samples in each window
irate(http_errors[1m])
# => calculated as (last - second_last) / scrape_interval_seconds
```
Practical differences and guidance:
| Function | Behavior | Best use |
| ----------------: | ------------------------------------------ | ----------------------------------------------------------- |
| `rate(v[range])` | Averages across the entire range | Stable, recommended for alerting and slow-moving counters |
| `irate(v[range])` | Instant slope between the last two samples | More responsive; useful for graphing very volatile counters |
How `rate()` works (conceptual):
* `rate(http_errors[1m])` divides the series into overlapping 1-minute windows for each evaluation.
* If the scrape interval is 15s, each 1-minute window typically contains 4 samples.
* For each window, `rate()` computes (last\_sample - first\_sample) / window\_seconds, yielding a per-second average across the window.
Numeric illustration (one 1-minute window):
```plaintext theme={null}
samples in window: 1.2, 2.3, 3.1, 3.3
first = 1.2, last = 3.3
difference = 3.3 - 1.2 = 2.1
rate = 2.1 / 60 = 0.035 (per second)
```
How `irate()` differs:
* `irate(http_errors[1m])` still evaluates over the 1-minute range, but uses the last two samples within that window.
* Rate is (last - second\_last) / time\_difference\_between\_these\_two\_samples (often equal to the scrape interval, e.g., 15s).
Example usage:
```bash theme={null}
# Instant rate using the last two samples in each window
irate(http_errors[1m])
# => calculated as (last - second_last) / scrape_interval_seconds
```
Practical differences and guidance:
| Function | Behavior | Best use |
| ----------------: | ------------------------------------------ | ----------------------------------------------------------- |
| `rate(v[range])` | Averages across the entire range | Stable, recommended for alerting and slow-moving counters |
| `irate(v[range])` | Instant slope between the last two samples | More responsive; useful for graphing very volatile counters |
 Tips when using `rate()` / `irate()`:
* Ensure the chosen range contains enough samples. With a 15s scrape interval, `1m` yields \~4 samples; more samples improve stability.
* When aggregating across series, compute the rate first, then aggregate. This preserves correct counter-reset handling per series.
Correct pattern:
```bash theme={null}
# Compute per-second rate per series first, then aggregate across series
sum without(code, handler) (rate(http_requests_total[24h]))
```
## Example: network transmit bytes
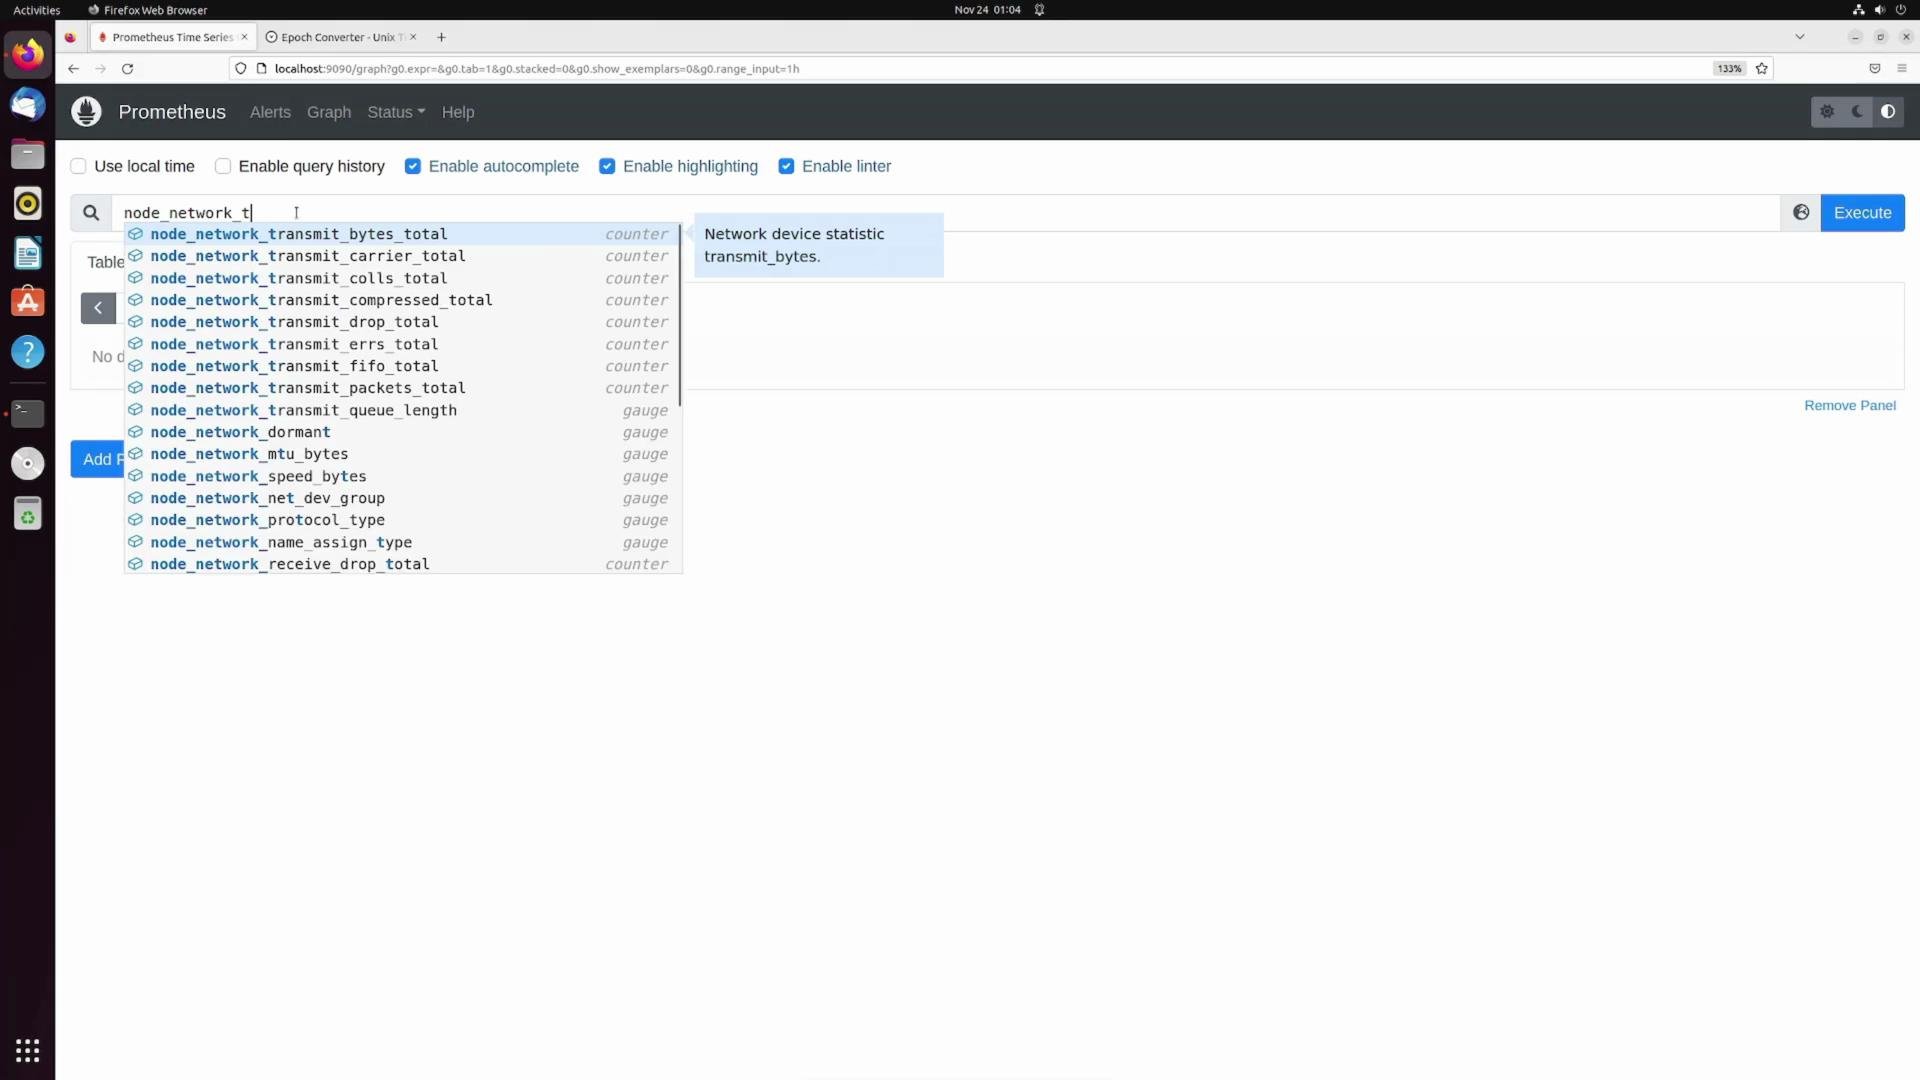
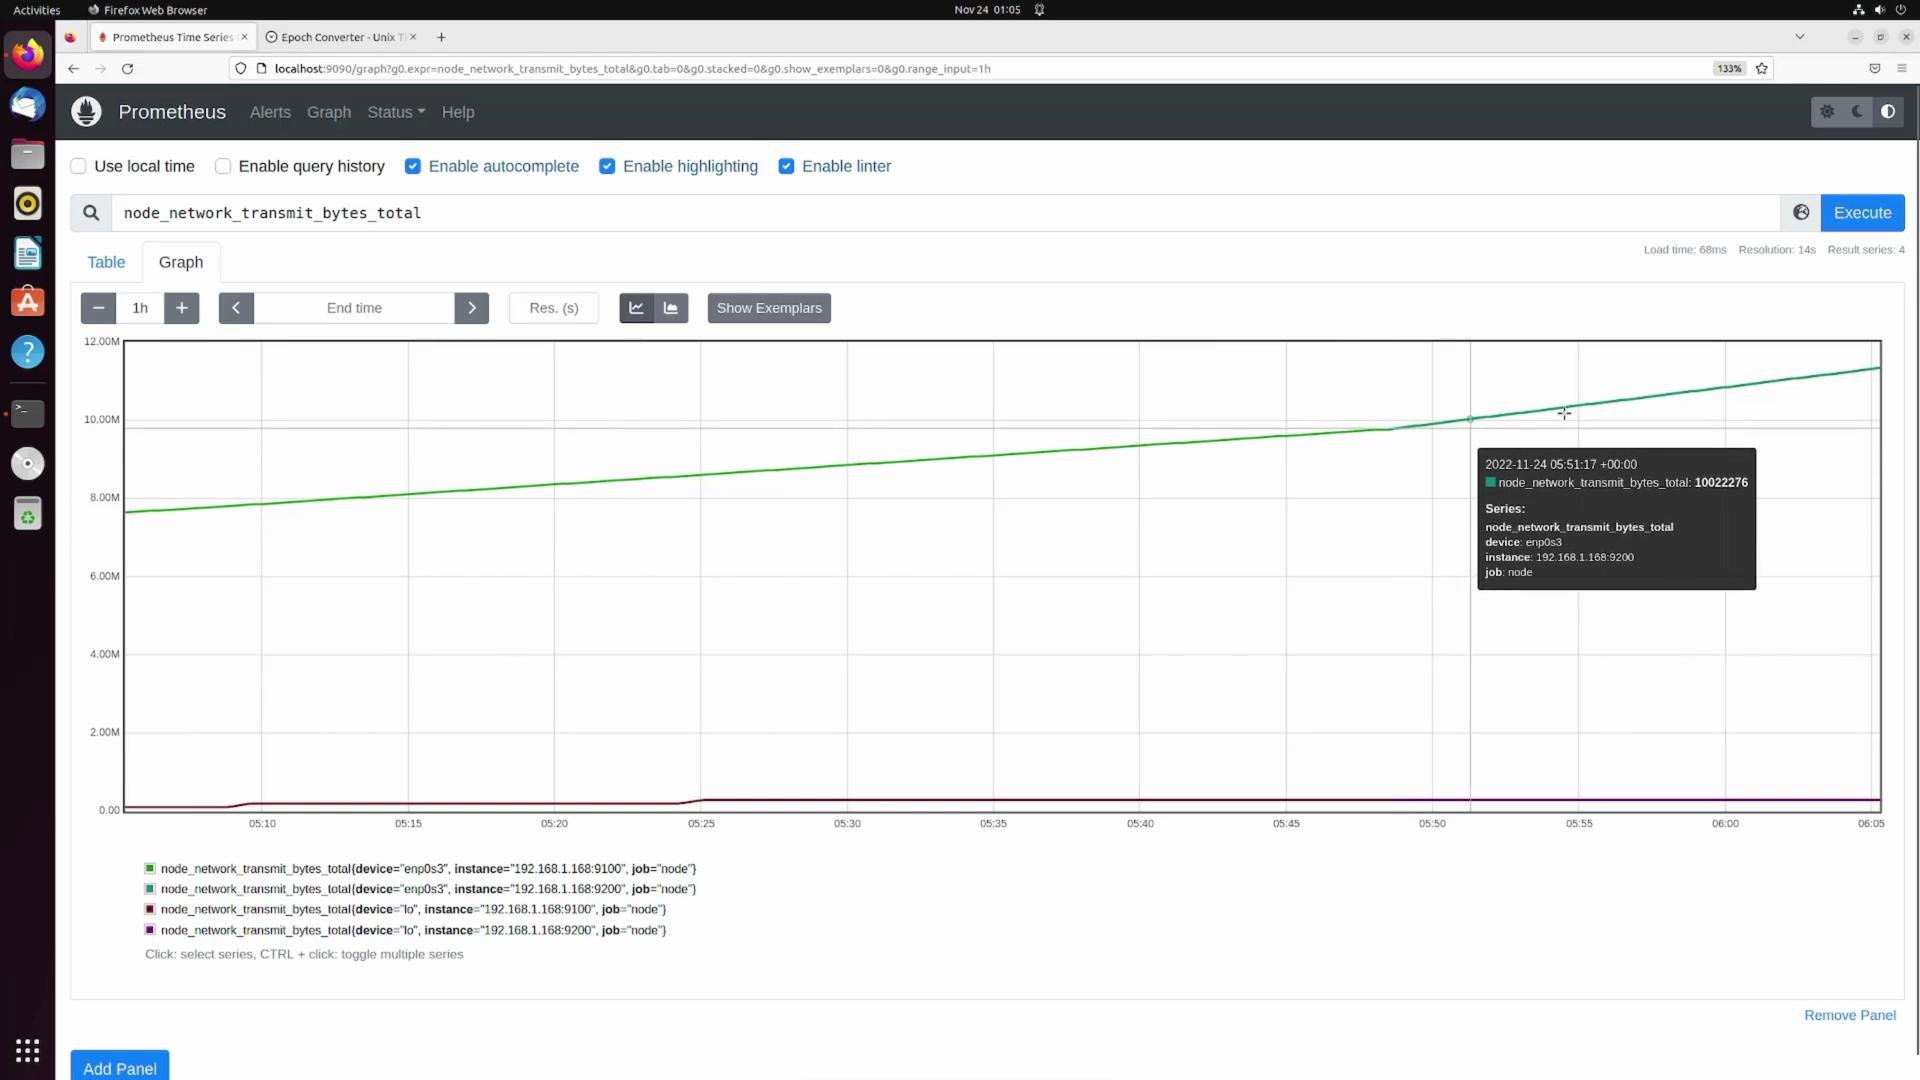
A raw counter such as `node_network_transmit_bytes_total` shows cumulative bytes transmitted per interface. The web UI helps explore series and labels.
Tips when using `rate()` / `irate()`:
* Ensure the chosen range contains enough samples. With a 15s scrape interval, `1m` yields \~4 samples; more samples improve stability.
* When aggregating across series, compute the rate first, then aggregate. This preserves correct counter-reset handling per series.
Correct pattern:
```bash theme={null}
# Compute per-second rate per series first, then aggregate across series
sum without(code, handler) (rate(http_requests_total[24h]))
```
## Example: network transmit bytes
A raw counter such as `node_network_transmit_bytes_total` shows cumulative bytes transmitted per interface. The web UI helps explore series and labels.
 Viewing the raw counter over time shows a steady increase:
 To convert the counter into throughput (bytes per second), compute the per-second rate:
```bash theme={null}
# Per-second transmit rate averaged across a 1m window
rate(node_network_transmit_bytes_total[1m])
```
This query returns the average bytes-per-second for each interface over the selected window—more meaningful for bandwidth and throughput alerts.
## Summary and references
* PromQL offers many functions across categories: math, time/date, sorting, presence checks, conversions, and counter-rate computations.
* Use `rate()` for stable averages (preferred for alerting), and `irate()` for instant slopes (preferred for responsive graphs).
* Always compute rates per series before aggregation to properly handle resets.
* For a complete list and exact semantics, see the Prometheus docs: [https://prometheus.io/docs/prometheus/latest/querying/functions/](https://prometheus.io/docs/prometheus/latest/querying/functions/)
Additional resources:
* [Prometheus Querying (official docs)](https://prometheus.io/docs/prometheus/latest/querying/functions/)
To convert the counter into throughput (bytes per second), compute the per-second rate:
```bash theme={null}
# Per-second transmit rate averaged across a 1m window
rate(node_network_transmit_bytes_total[1m])
```
This query returns the average bytes-per-second for each interface over the selected window—more meaningful for bandwidth and throughput alerts.
## Summary and references
* PromQL offers many functions across categories: math, time/date, sorting, presence checks, conversions, and counter-rate computations.
* Use `rate()` for stable averages (preferred for alerting), and `irate()` for instant slopes (preferred for responsive graphs).
* Always compute rates per series before aggregation to properly handle resets.
* For a complete list and exact semantics, see the Prometheus docs: [https://prometheus.io/docs/prometheus/latest/querying/functions/](https://prometheus.io/docs/prometheus/latest/querying/functions/)
Additional resources:
* [Prometheus Querying (official docs)](https://prometheus.io/docs/prometheus/latest/querying/functions/)