> ## Documentation Index
> Fetch the complete documentation index at: https://notes.kodekloud.com/llms.txt
> Use this file to discover all available pages before exploring further.
# Introduction
> Overview of PromQL for Prometheus, covering query concepts, data types (scalar, instant and range vectors), selectors, operators, aggregations, subqueries, histograms and visualization.
In this section, we're going to be discussing PromQL.
So what is PromQL?
Well, it's short for Prometheus Query Language, and it's the main
way to query metrics within Prometheus.
So you'll send a request to the Prometheus server, provide your specific
PromQL expression, and it's going to return the data for that expression.
And the data that you get returned can be visualized in dashboards,
whether that's through Grafana or some of
the built-in dashboarding tools within Prometheus.
 And you can also use PromQL to build alerting rules to notify
administrators when certain thresholds have been crossed.
And so in this section, we're going to
cover a lot of different things.
This is going to be one of the larger sections.
We're going to go over the different expression data
structures and what they can return.
We're going to cover different selectors and modifiers so that we can
get the exact data that we're interested in.
We're going to go over different operators and functions.
And I'm going to discuss vector matching.
We'll go over the various aggregators that's built in with Prometheus.
We'll cover subqueries, and then I'll do a little bit of a
deep dive into what we can do with histogram and summary metrics.
And you can also use PromQL to build alerting rules to notify
administrators when certain thresholds have been crossed.
And so in this section, we're going to
cover a lot of different things.
This is going to be one of the larger sections.
We're going to go over the different expression data
structures and what they can return.
We're going to cover different selectors and modifiers so that we can
get the exact data that we're interested in.
We're going to go over different operators and functions.
And I'm going to discuss vector matching.
We'll go over the various aggregators that's built in with Prometheus.
We'll cover subqueries, and then I'll do a little bit of a
deep dive into what we can do with histogram and summary metrics.
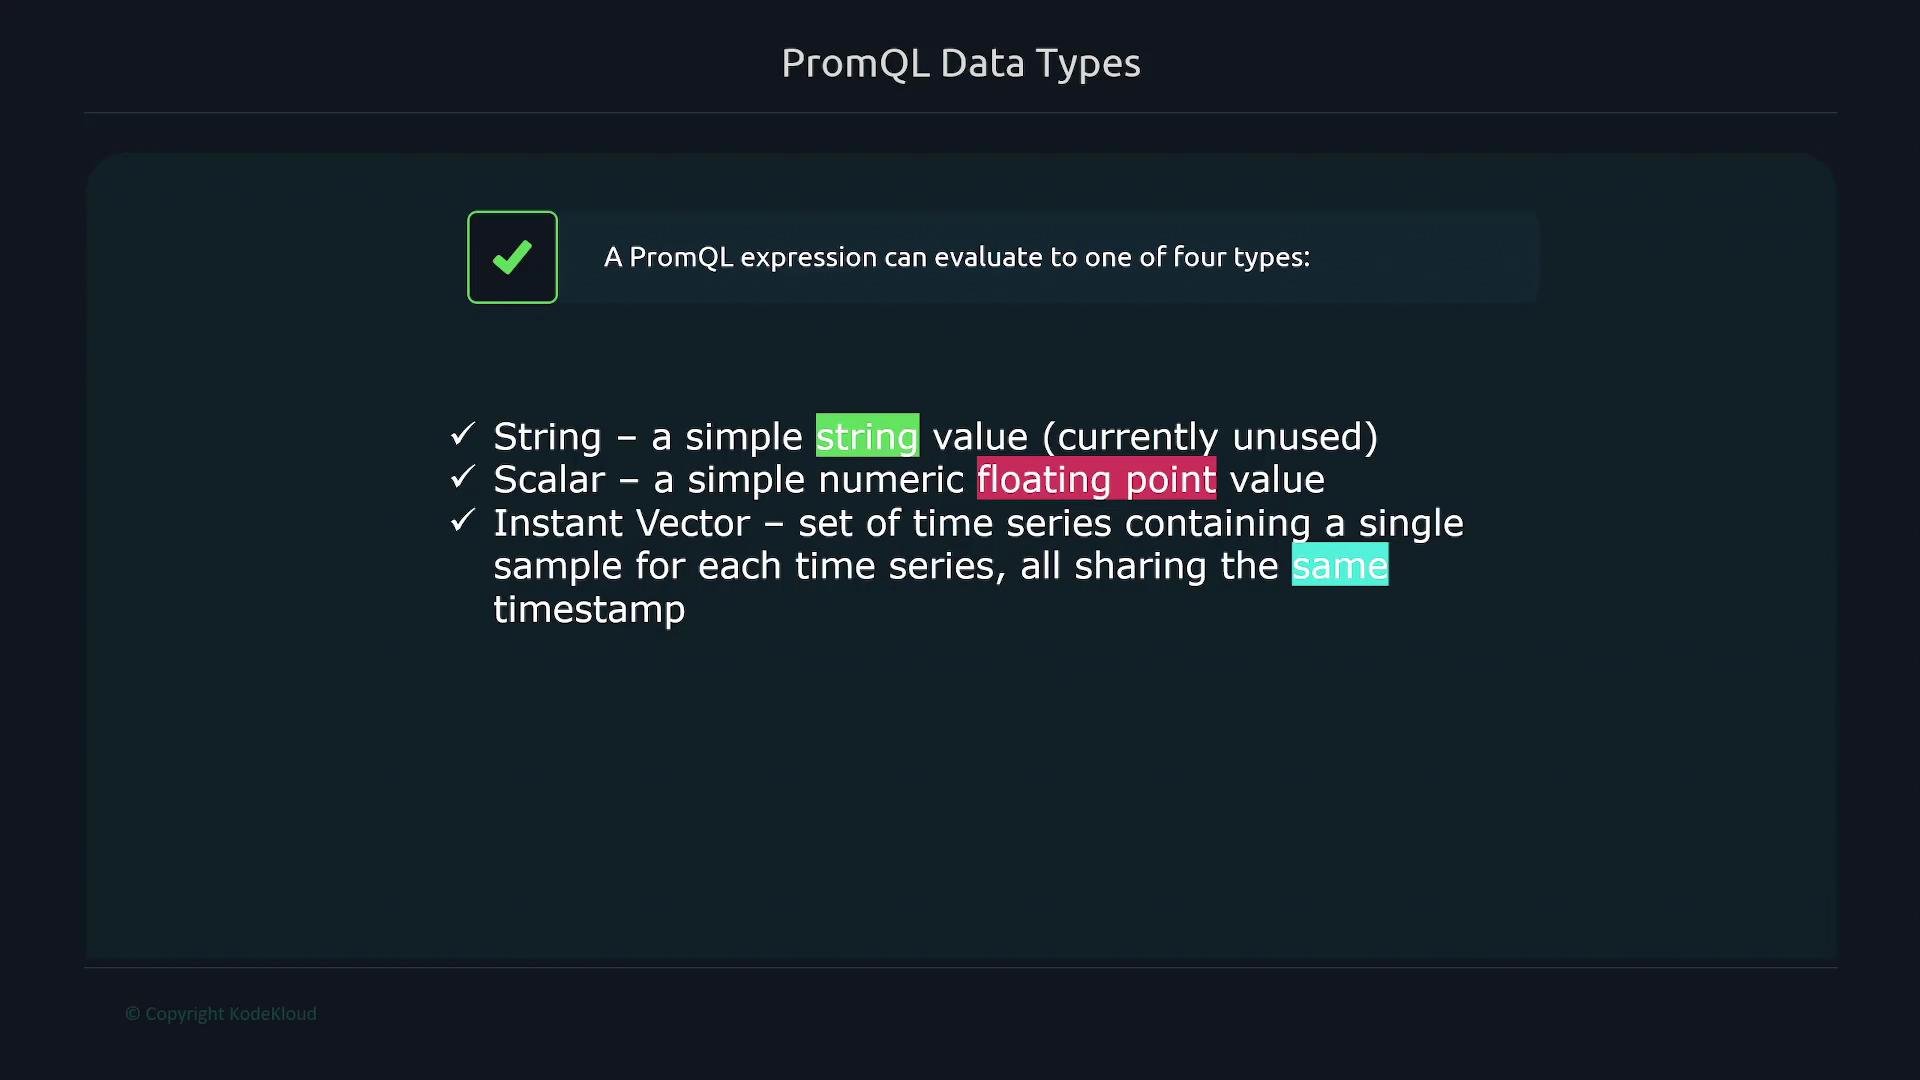
 So when you run a PromQL expression, what gets returned from the
Prometheus server can be one of four types.
The first one is a string, which is a simple
string value, which is currently unused.
You have a scalar, which is a
numeric value, so some floating-point value.
You have an instant vector, which is a set of time series
containing a single sample for each time
series, all sharing the same timestamp.
So when you run a PromQL expression, what gets returned from the
Prometheus server can be one of four types.
The first one is a string, which is a simple
string value, which is currently unused.
You have a scalar, which is a
numeric value, so some floating-point value.
You have an instant vector, which is a set of time series
containing a single sample for each time
series, all sharing the same timestamp.
 And a range vector is a set of time series containing a
range of data points over time for each time series.
So let's go over a scalar.
Now, as I mentioned, a string is just a simple string value,
and it's currently unused, but it would just
be some random text like that.
A scalar is going to be a simple numeric floating-point value.
So something like fifty-four point seven four three or
one hundred twenty-seven point four three.
So it's just some number.
An instant vector is going to return a set of time series
containing just one single sample for each time series,
all sharing the same exact timestamp.
So if we perform this query, which is just taking the name
of a metric we're interested in and then just querying it using
that, Prometheus is going to return the following data.
So what it does is it finds this specific metric
with all of its unique labels.
And remember, every combination of metric and unique labels is
```text theme={null}
$ node_cpu_seconds_total
node_cpu_seconds_total{cpu="0", instance="server1"} 258277.86
node_cpu_seconds_total{cpu="1", instance="server1"} 448430.21
node_cpu_seconds_total{cpu="0", instance="server2"} 941202.32
node_cpu_seconds_total{cpu="1", instance="server2"} 772838.83
```
going to be one time series.
So we have four total time series.
And we're going to get the specific value for
each one of these time series.
Now, the specific or the most important thing
```text theme={null}
$ node_cpu_seconds_total
node_cpu_seconds_total{cpu="0", instance="server1"} 258277.86
node_cpu_seconds_total{cpu="1", instance="server1"} 448430.21
node_cpu_seconds_total{cpu="0", instance="server2"} 941202.32
node_cpu_seconds_total{cpu="1", instance="server2"} 772838.83
```
about instant vectors is the timestamp.
So it's going to return one single sample for each time series.
And they're all going to be at the same exact timestamp.
So for each time series, we're going to get the data at
one specific point in time, which is at March 3rd, eleven
oh five a.m., the same timestamp.
And so it's going to just return a single point in time,
whatever the value of the metric is.
Now, range vector is going to be a little bit different.
Range vector is going to return a set of time series containing
a range of different data points over time for each time series.
So if we run the same query for the same metric, but
this time we do this bracket and then three M and then
close bracket, what this means is I want to get this metric
data not just for a single point in time,
but for the past three minutes.
And that's what this means, the three M. So what it's going
to return is something like this.
So you're going to get the metric, and you're going to
get the unique combination of labels.
And remember, every metric with a combination of
unique labels is a time series.
So in this example, there are two time series it returned.
you're gonna get the value and a timestamp.
Now where it differs is you're gonna get
more than one timestamp and value.
So it's actually going to return all of the values and timestamps
that it got for the past three minutes.
So it looks like it scraped this specific server three
times in the past three minutes.
It just so happened, I just used three as an example.
It can be more than that, it can be less than that.
And for the other time series, we're going to get the
values at the same exact time.
So we got it at eight oh five, eight oh six, eight
oh seven, and you can see the same thing at eight oh
five, eight oh six, eight oh seven.
So we get the value for this
metric at those three data points.
And so it's going to contain all
the data during that three-minute window.
And that's really the main difference between a
range vector and an instant vector.
A range vector is going to return metrics over the course of
```PromQL theme={null}
plaintext
$ node_cpu_seconds_total[3m]
node_cpu_seconds_total{cpu="0", instance="server1"} 674478.07
node_cpu_seconds_total{cpu="0", instance="server2"} 674626.76
node_cpu_seconds_total{cpu="1", instance="server1"} 566873.04
node_cpu_seconds_total{cpu="1", instance="server2"} 884597.02
540071.18
944799.49
```
And a range vector is a set of time series containing a
range of data points over time for each time series.
So let's go over a scalar.
Now, as I mentioned, a string is just a simple string value,
and it's currently unused, but it would just
be some random text like that.
A scalar is going to be a simple numeric floating-point value.
So something like fifty-four point seven four three or
one hundred twenty-seven point four three.
So it's just some number.
An instant vector is going to return a set of time series
containing just one single sample for each time series,
all sharing the same exact timestamp.
So if we perform this query, which is just taking the name
of a metric we're interested in and then just querying it using
that, Prometheus is going to return the following data.
So what it does is it finds this specific metric
with all of its unique labels.
And remember, every combination of metric and unique labels is
```text theme={null}
$ node_cpu_seconds_total
node_cpu_seconds_total{cpu="0", instance="server1"} 258277.86
node_cpu_seconds_total{cpu="1", instance="server1"} 448430.21
node_cpu_seconds_total{cpu="0", instance="server2"} 941202.32
node_cpu_seconds_total{cpu="1", instance="server2"} 772838.83
```
going to be one time series.
So we have four total time series.
And we're going to get the specific value for
each one of these time series.
Now, the specific or the most important thing
```text theme={null}
$ node_cpu_seconds_total
node_cpu_seconds_total{cpu="0", instance="server1"} 258277.86
node_cpu_seconds_total{cpu="1", instance="server1"} 448430.21
node_cpu_seconds_total{cpu="0", instance="server2"} 941202.32
node_cpu_seconds_total{cpu="1", instance="server2"} 772838.83
```
about instant vectors is the timestamp.
So it's going to return one single sample for each time series.
And they're all going to be at the same exact timestamp.
So for each time series, we're going to get the data at
one specific point in time, which is at March 3rd, eleven
oh five a.m., the same timestamp.
And so it's going to just return a single point in time,
whatever the value of the metric is.
Now, range vector is going to be a little bit different.
Range vector is going to return a set of time series containing
a range of different data points over time for each time series.
So if we run the same query for the same metric, but
this time we do this bracket and then three M and then
close bracket, what this means is I want to get this metric
data not just for a single point in time,
but for the past three minutes.
And that's what this means, the three M. So what it's going
to return is something like this.
So you're going to get the metric, and you're going to
get the unique combination of labels.
And remember, every metric with a combination of
unique labels is a time series.
So in this example, there are two time series it returned.
you're gonna get the value and a timestamp.
Now where it differs is you're gonna get
more than one timestamp and value.
So it's actually going to return all of the values and timestamps
that it got for the past three minutes.
So it looks like it scraped this specific server three
times in the past three minutes.
It just so happened, I just used three as an example.
It can be more than that, it can be less than that.
And for the other time series, we're going to get the
values at the same exact time.
So we got it at eight oh five, eight oh six, eight
oh seven, and you can see the same thing at eight oh
five, eight oh six, eight oh seven.
So we get the value for this
metric at those three data points.
And so it's going to contain all
the data during that three-minute window.
And that's really the main difference between a
range vector and an instant vector.
A range vector is going to return metrics over the course of
```PromQL theme={null}
plaintext
$ node_cpu_seconds_total[3m]
node_cpu_seconds_total{cpu="0", instance="server1"} 674478.07
node_cpu_seconds_total{cpu="0", instance="server2"} 674626.76
node_cpu_seconds_total{cpu="1", instance="server1"} 566873.04
node_cpu_seconds_total{cpu="1", instance="server2"} 884597.02
540071.18
944799.49
```