> ## Documentation Index
> Fetch the complete documentation index at: https://notes.kodekloud.com/llms.txt
> Use this file to discover all available pages before exploring further.
# Recording Rules
> Guide on Prometheus recording rules that evaluate PromQL expressions periodically, store results as new time series, and optimize dashboard queries with examples, configuration, naming and verification steps
Recording rules let Prometheus periodically evaluate a PromQL expression and persist the result as a new time series. This speeds up dashboard queries (Grafana or Prometheus' built-in UI) because the computed result is already available in the TSDB instead of being computed on demand.
Key links:
* Prometheus: [https://prometheus.io/](https://prometheus.io/)
* PromQL basics: [https://prometheus.io/docs/prometheus/latest/querying/basics/](https://prometheus.io/docs/prometheus/latest/querying/basics/)
* Grafana: [https://grafana.com/](https://grafana.com/)
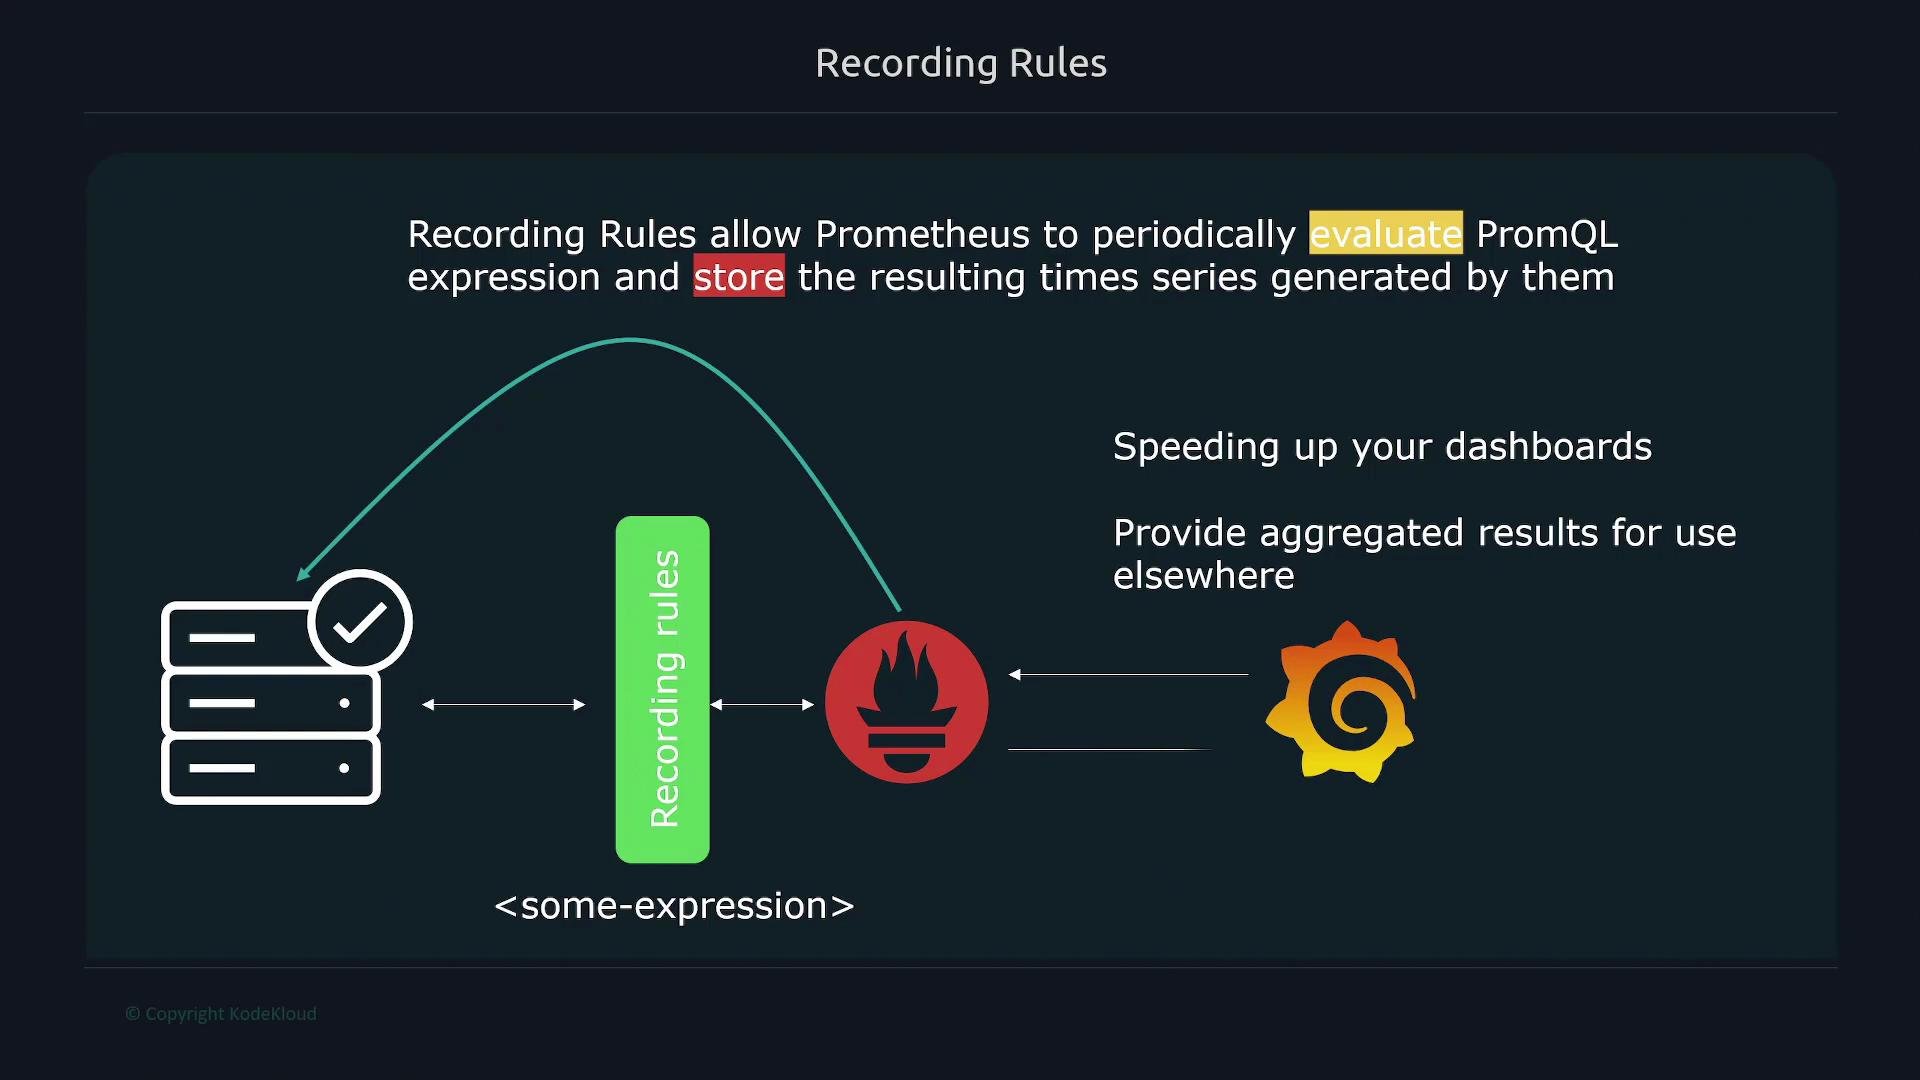 How it works at a glance:
* You define recording rules in one or more rule files (YAML).
* Prometheus evaluates the rule expressions at a configured interval and writes the results to the TSDB as new metrics.
* Dashboards and queries can then read those recorded metrics by name instead of recalculating expensive expressions.
## Configure rule file loading
In `prometheus.yml` you point Prometheus to one or more rule files using the `rule_files` section. Globs are supported, so you can load all files from a directory.
Example minimal configuration (note `rule_files` must list the file(s) or glob patterns to load):
```yaml theme={null}
global:
scrape_interval: 5s
evaluation_interval: 5s
rule_files:
- /etc/prometheus/rules/*.yml
scrape_configs:
- job_name: prometheus
static_configs:
- targets: ["localhost:9090"]
```
If you change rule files, Prometheus needs to reload its configuration. You can either restart the service or trigger a reload using the HTTP endpoint (`POST /-/reload`) or SIGHUP. Reloading avoids a full restart.
## Rule file structure
A rule file contains one or more rule groups under the `groups:` key. Each group can define an `interval` (overrides global evaluation interval for that group) and a list of `rules`. Each rule has:
* `record`: name for the resulting time series
* `expr`: the PromQL expression to evaluate
* `labels` (optional): to add/remove labels on the recorded series
Example skeleton:
```yaml theme={null}
groups:
- name:
interval: # optional; overrides global evaluation_interval
rules:
- record:
expr:
labels:
:
- record:
expr:
- name:
rules:
# ...
```
Table: rule file keys
| Field | Description | Example |
| ------------------------- | ------------------------------------------ | --------------------------------------------------------------- |
| `groups[].name` | Logical name grouping related rules | `node` |
| `groups[].interval` | Optional evaluation interval for the group | `15s` |
| `groups[].rules[].record` | Metric name to create in TSDB | `node_filesystem_free_percent` |
| `groups[].rules[].expr` | PromQL expression to evaluate | `100 * node_filesystem_free_bytes / node_filesystem_size_bytes` |
| `groups[].rules[].labels` | Optional labels to add or override | `job: "node"` |
## Parallel/Sequential evaluation model
* Each rule group is evaluated in parallel with other groups.
* Within a group, rules are evaluated sequentially in the order listed. This allows later rules to reference earlier recorded rules in the same group.
How it works at a glance:
* You define recording rules in one or more rule files (YAML).
* Prometheus evaluates the rule expressions at a configured interval and writes the results to the TSDB as new metrics.
* Dashboards and queries can then read those recorded metrics by name instead of recalculating expensive expressions.
## Configure rule file loading
In `prometheus.yml` you point Prometheus to one or more rule files using the `rule_files` section. Globs are supported, so you can load all files from a directory.
Example minimal configuration (note `rule_files` must list the file(s) or glob patterns to load):
```yaml theme={null}
global:
scrape_interval: 5s
evaluation_interval: 5s
rule_files:
- /etc/prometheus/rules/*.yml
scrape_configs:
- job_name: prometheus
static_configs:
- targets: ["localhost:9090"]
```
If you change rule files, Prometheus needs to reload its configuration. You can either restart the service or trigger a reload using the HTTP endpoint (`POST /-/reload`) or SIGHUP. Reloading avoids a full restart.
## Rule file structure
A rule file contains one or more rule groups under the `groups:` key. Each group can define an `interval` (overrides global evaluation interval for that group) and a list of `rules`. Each rule has:
* `record`: name for the resulting time series
* `expr`: the PromQL expression to evaluate
* `labels` (optional): to add/remove labels on the recorded series
Example skeleton:
```yaml theme={null}
groups:
- name:
interval: # optional; overrides global evaluation_interval
rules:
- record:
expr:
labels:
:
- record:
expr:
- name:
rules:
# ...
```
Table: rule file keys
| Field | Description | Example |
| ------------------------- | ------------------------------------------ | --------------------------------------------------------------- |
| `groups[].name` | Logical name grouping related rules | `node` |
| `groups[].interval` | Optional evaluation interval for the group | `15s` |
| `groups[].rules[].record` | Metric name to create in TSDB | `node_filesystem_free_percent` |
| `groups[].rules[].expr` | PromQL expression to evaluate | `100 * node_filesystem_free_bytes / node_filesystem_size_bytes` |
| `groups[].rules[].labels` | Optional labels to add or override | `job: "node"` |
## Parallel/Sequential evaluation model
* Each rule group is evaluated in parallel with other groups.
* Within a group, rules are evaluated sequentially in the order listed. This allows later rules to reference earlier recorded rules in the same group.
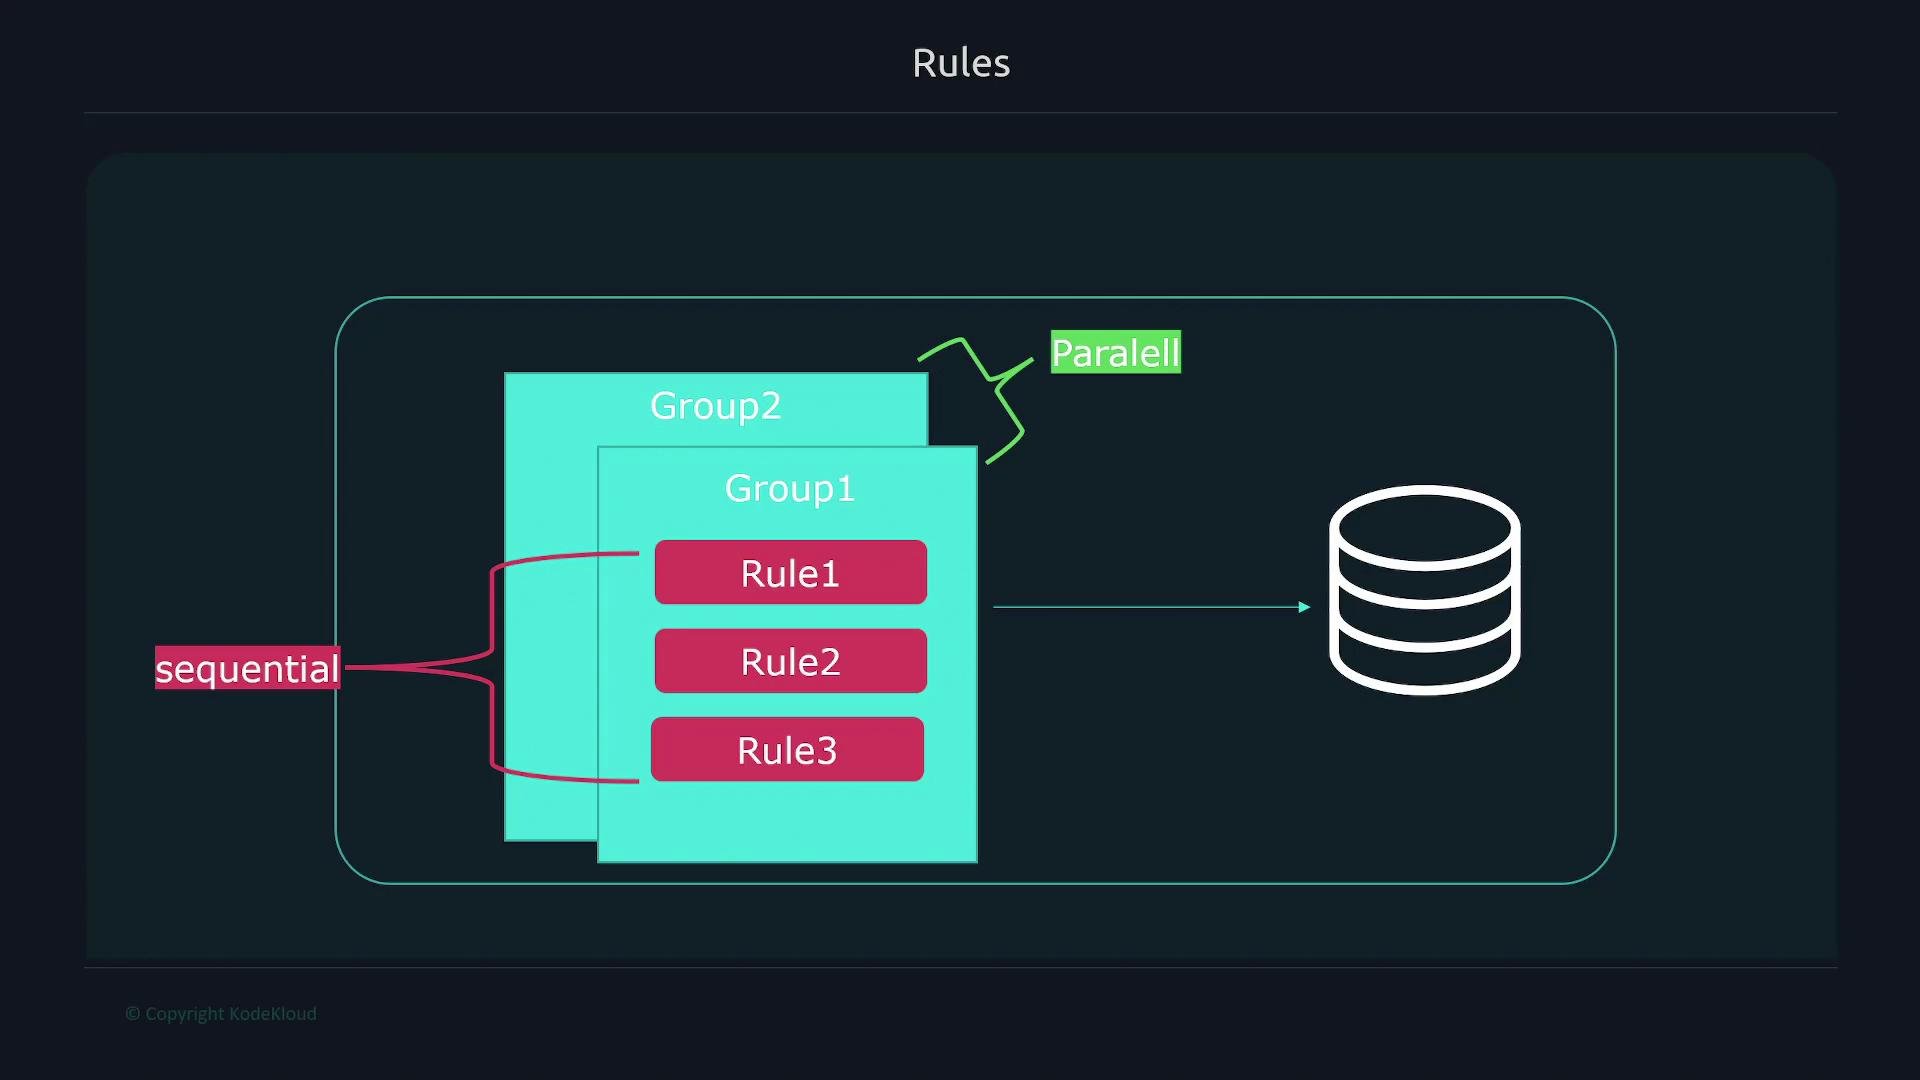 Because rules inside a group run sequentially, any rule that references another rule must come after the rule it references. Otherwise the referenced recorded series may not exist yet.
## Useful example expressions
Calculate percent memory free on a node:
```PromQL theme={null}
100 - (100 * node_memory_MemFree_bytes / node_memory_MemTotal_bytes)
```
Calculate filesystem free percentage:
```promql theme={null}
100 * node_filesystem_free_bytes / node_filesystem_size_bytes
```
## Example recording rules
Create `/etc/prometheus/rules.yml` (or any file you reference from `rule_files`) with a group that runs every 15s and records the two metrics above:
```yaml theme={null}
groups:
- name: example1
interval: 15s
rules:
- record: node_memory_memFree_percent
expr: 100 - (100 * node_memory_MemFree_bytes / node_memory_MemTotal_bytes)
- record: node_filesystem_free_percent
expr: 100 * node_filesystem_free_bytes{job="node"} / node_filesystem_size_bytes{job="node"}
```
After reloading Prometheus, you can query the recorded metric by name rather than the original expression:
Example query result:
```bash theme={null}
$ node_memory_memFree_percent
node_memory_memFree_percent{instance="192.168.1.168:9100", job="node"} 25
```
And for filesystem percentages:
```bash theme={null}
$ node_filesystem_free_percent
node_filesystem_free_percent{device="/dev/sda2", instance="node1", job="node", mountpoint="/boot/efi"} 20
node_filesystem_free_percent{device="/dev/sda3", instance="node1", job="node", mountpoint="/"} 72
...
```
## Chaining rules (reference recorded metrics)
Because rules in a group run sequentially, you can reference a recorded metric in a subsequent rule. Example:
```yaml theme={null}
groups:
- name: example1
interval: 15s
rules:
- record: node_filesystem_free_percent
expr: 100 * node_filesystem_free_bytes{job="node"} / node_filesystem_size_bytes{job="node"}
- record: node_filesystem_free_percent_avg
expr: avg by(instance)(node_filesystem_free_percent)
```
Here, `node_filesystem_free_percent_avg` aggregates the recorded `node_filesystem_free_percent` metric. Because it appears after the recorded metric in the same group, the reference will resolve correctly.
## Naming best practices for recording rules
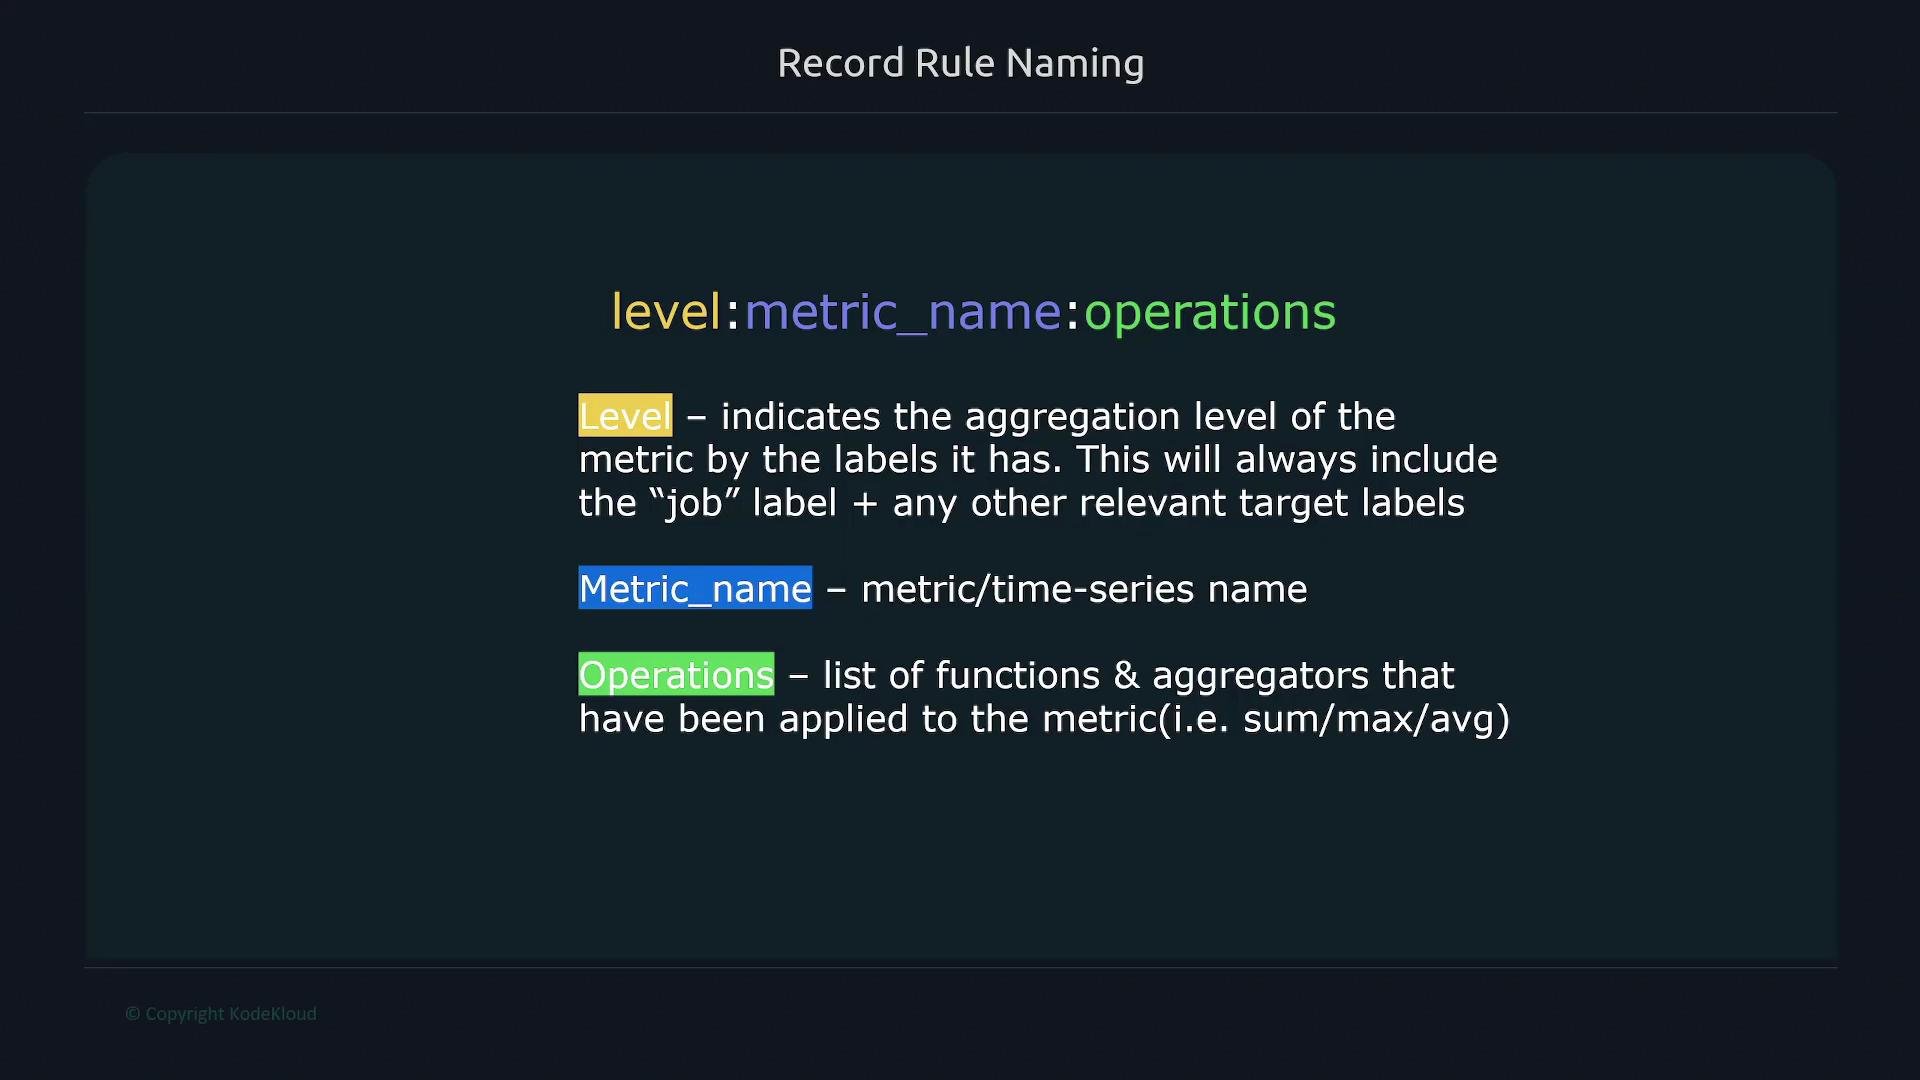
Use a structured naming scheme composed of three parts separated by colons (or another consistent delimiter):
* level — aggregation level (labels retained), typically includes `job` plus any target labels
* metric — the base metric name
* operation — aggregators/functions applied (e.g., `rate_5m`, `sum`, `avg`)
Example: `job:method:path:http_errors:rate_5m` (or a compact variant like `job_method_path_http_errors_rate_5m` depending on your conventions).
Because rules inside a group run sequentially, any rule that references another rule must come after the rule it references. Otherwise the referenced recorded series may not exist yet.
## Useful example expressions
Calculate percent memory free on a node:
```PromQL theme={null}
100 - (100 * node_memory_MemFree_bytes / node_memory_MemTotal_bytes)
```
Calculate filesystem free percentage:
```promql theme={null}
100 * node_filesystem_free_bytes / node_filesystem_size_bytes
```
## Example recording rules
Create `/etc/prometheus/rules.yml` (or any file you reference from `rule_files`) with a group that runs every 15s and records the two metrics above:
```yaml theme={null}
groups:
- name: example1
interval: 15s
rules:
- record: node_memory_memFree_percent
expr: 100 - (100 * node_memory_MemFree_bytes / node_memory_MemTotal_bytes)
- record: node_filesystem_free_percent
expr: 100 * node_filesystem_free_bytes{job="node"} / node_filesystem_size_bytes{job="node"}
```
After reloading Prometheus, you can query the recorded metric by name rather than the original expression:
Example query result:
```bash theme={null}
$ node_memory_memFree_percent
node_memory_memFree_percent{instance="192.168.1.168:9100", job="node"} 25
```
And for filesystem percentages:
```bash theme={null}
$ node_filesystem_free_percent
node_filesystem_free_percent{device="/dev/sda2", instance="node1", job="node", mountpoint="/boot/efi"} 20
node_filesystem_free_percent{device="/dev/sda3", instance="node1", job="node", mountpoint="/"} 72
...
```
## Chaining rules (reference recorded metrics)
Because rules in a group run sequentially, you can reference a recorded metric in a subsequent rule. Example:
```yaml theme={null}
groups:
- name: example1
interval: 15s
rules:
- record: node_filesystem_free_percent
expr: 100 * node_filesystem_free_bytes{job="node"} / node_filesystem_size_bytes{job="node"}
- record: node_filesystem_free_percent_avg
expr: avg by(instance)(node_filesystem_free_percent)
```
Here, `node_filesystem_free_percent_avg` aggregates the recorded `node_filesystem_free_percent` metric. Because it appears after the recorded metric in the same group, the reference will resolve correctly.
## Naming best practices for recording rules
Use a structured naming scheme composed of three parts separated by colons (or another consistent delimiter):
* level — aggregation level (labels retained), typically includes `job` plus any target labels
* metric — the base metric name
* operation — aggregators/functions applied (e.g., `rate_5m`, `sum`, `avg`)
Example: `job:method:path:http_errors:rate_5m` (or a compact variant like `job_method_path_http_errors_rate_5m` depending on your conventions).
 Example: an HTTP errors counter instrumented with labels `method` and `path` and you want a 5m rate aggregated by `job, method, path`:
* Aggregation level: `job,method,path`
* Metric name: `http_errors_total`
* Operation: `rate_5m`
Resulting recorded name (example convention): `job_method_path_http_errors_rate_5m`
If you remove `path` from aggregation, change the level accordingly (e.g., `job,method`).
Best practice: group all rules for a particular scrape job into a single rule group. That keeps related metrics together and ensures consistent evaluation intervals.
Example grouping by job:
```yaml theme={null}
groups:
- name: node # all rules for job="node"
interval: 15s
rules:
- record: node_memory_memFree_percent
expr: 100 - (100 * node_memory_MemFree_bytes{job="node"} / node_memory_MemTotal_bytes{job="node"})
- name: docker # all rules for job="docker"
interval: 15s
rules:
# docker-specific recording rules here
```
## Add rules to Prometheus and reload
1. Create or edit rule file (example):
```bash theme={null}
sudo vi /etc/prometheus/rules.yml
# paste your groups/rules (see examples above)
```
2. Ensure `prometheus.yml` contains the rule file path (or glob) under `rule_files`:
```yaml theme={null}
global:
scrape_interval: 15s
evaluation_interval: 15s
rule_files:
- "rules.yml"
scrape_configs:
- job_name: "prometheus"
static_configs:
- targets: ["localhost:9090"]
- job_name: "node"
static_configs:
- targets: ["192.168.1.168:9100", "192.168.1.168:9200"]
- job_name: "api"
static_configs:
- targets: ["192.168.1.168:8000"]
- job_name: "ec2"
ec2_sd_configs:
- region: us-east-1
```
3. Reload Prometheus configuration:
* Reload via HTTP API:
```bash theme={null}
curl -X POST http://localhost:9090/-/reload
```
* Or restart service:
```bash theme={null}
sudo systemctl restart prometheus
```
## Verify rules
Open the Prometheus UI:
* Go to Status → Rules
* Confirm rules are `OK` and evaluate at the expected interval
* You can also query the recorded metric names in the expression browser to see current values.
Example rule display and query results:
```text theme={null}
record: node_filesystem_free_percent
expr: 100 * node_filesystem_free_bytes / node_filesystem_size_bytes{job="node"}
record: node_filesystem_free_percent_avg
expr: avg by(instance) (node_filesystem_free_percent)
```
Example sample output:
```text theme={null}
node_filesystem_free_percent{device="/dev/sda3", fstype="ext4", instance="192.168.1.168:9100", job="node", mountpoint="/"} 16.005607045046514
...
```
This completes a concise guide to creating, naming, and using recording rules to improve query performance and enable efficient reuse of computed metrics in dashboards and alerts.
Example: an HTTP errors counter instrumented with labels `method` and `path` and you want a 5m rate aggregated by `job, method, path`:
* Aggregation level: `job,method,path`
* Metric name: `http_errors_total`
* Operation: `rate_5m`
Resulting recorded name (example convention): `job_method_path_http_errors_rate_5m`
If you remove `path` from aggregation, change the level accordingly (e.g., `job,method`).
Best practice: group all rules for a particular scrape job into a single rule group. That keeps related metrics together and ensures consistent evaluation intervals.
Example grouping by job:
```yaml theme={null}
groups:
- name: node # all rules for job="node"
interval: 15s
rules:
- record: node_memory_memFree_percent
expr: 100 - (100 * node_memory_MemFree_bytes{job="node"} / node_memory_MemTotal_bytes{job="node"})
- name: docker # all rules for job="docker"
interval: 15s
rules:
# docker-specific recording rules here
```
## Add rules to Prometheus and reload
1. Create or edit rule file (example):
```bash theme={null}
sudo vi /etc/prometheus/rules.yml
# paste your groups/rules (see examples above)
```
2. Ensure `prometheus.yml` contains the rule file path (or glob) under `rule_files`:
```yaml theme={null}
global:
scrape_interval: 15s
evaluation_interval: 15s
rule_files:
- "rules.yml"
scrape_configs:
- job_name: "prometheus"
static_configs:
- targets: ["localhost:9090"]
- job_name: "node"
static_configs:
- targets: ["192.168.1.168:9100", "192.168.1.168:9200"]
- job_name: "api"
static_configs:
- targets: ["192.168.1.168:8000"]
- job_name: "ec2"
ec2_sd_configs:
- region: us-east-1
```
3. Reload Prometheus configuration:
* Reload via HTTP API:
```bash theme={null}
curl -X POST http://localhost:9090/-/reload
```
* Or restart service:
```bash theme={null}
sudo systemctl restart prometheus
```
## Verify rules
Open the Prometheus UI:
* Go to Status → Rules
* Confirm rules are `OK` and evaluate at the expected interval
* You can also query the recorded metric names in the expression browser to see current values.
Example rule display and query results:
```text theme={null}
record: node_filesystem_free_percent
expr: 100 * node_filesystem_free_bytes / node_filesystem_size_bytes{job="node"}
record: node_filesystem_free_percent_avg
expr: avg by(instance) (node_filesystem_free_percent)
```
Example sample output:
```text theme={null}
node_filesystem_free_percent{device="/dev/sda3", fstype="ext4", instance="192.168.1.168:9100", job="node", mountpoint="/"} 16.005607045046514
...
```
This completes a concise guide to creating, naming, and using recording rules to improve query performance and enable efficient reuse of computed metrics in dashboards and alerts.