> ## Documentation Index
> Fetch the complete documentation index at: https://notes.kodekloud.com/llms.txt
> Use this file to discover all available pages before exploring further.
# Subquery
> Explains Prometheus subqueries, syntax and examples for evaluating instant queries over time windows so range aggregations can operate.
Suppose you have a gauge metric and you want to know its maximum value over the past ten minutes. Prometheus provides the `max_over_time` function for exactly that:
```PromQL theme={null}
max_over_time(node_filesystem_avail_bytes[10m])
```
That works fine for gauges. But what if you have a counter metric and you want the maximum *rate* over the past ten minutes? A naïve attempt might look like this:
```PromQL theme={null}
max_over_time(rate(http_requests_total[10m]))
```
This will fail because `rate(...)` returns an instant vector while `max_over_time` expects a range vector. Also remember: in `rate(metric[10m])`, the `10m` is the sample range for the `rate()` calculation (how Prometheus computes the rate), not how far back to query data for aggregation.
This is where subqueries solve the problem.
Use subqueries when you need to take an instant-expression (for example, `rate(...)`) and evaluate that expression across a historical time window at a given resolution so that range-based aggregation functions (like `max_over_time`, `min_over_time`, etc.) can operate on a range vector.
## Subquery syntax
A Prometheus subquery wraps an instant query and appends a bracketed range and step (resolution). Optionally, you can add an `offset`.
```PromQL theme={null}
[:] [offset ]
```
* ``: any instant-vector expression (e.g., `rate(...)`, `irate(...)`, or any metric selector).
* ``: how far back to collect data for the subquery (the time window).
* ``: step between samples returned by the subquery (the query step).
Example: compute the maximum rate of `http_requests_total` over the last 5 minutes, where `rate()` uses a 1 minute sample range and the subquery samples every 30 seconds:
```PromQL theme={null}
max_over_time(rate(http_requests_total[1m])[5m:30s])
```
* The inner `[1m]` tells `rate()` how to group samples for each instant.
* The outer `[5m:30s]` tells Prometheus to evaluate the instant expression for the previous 5 minutes at 30-second intervals, returning a range vector that `max_over_time` can consume.
## Quick comparison: instant vs range vectors
| Vector type | Represents | Typical use |
| -------------- | ------------------------------------------------ | ---------------------------------------------------------------------------------------- |
| Instant vector | A single value per series at one timestamp | `rate(...)`, `irate(...)`, metric selectors without `[range]` |
| Range vector | Multiple samples per series across a time window | `max_over_time(...)`, `avg_over_time(...)`, or subquery results like `rate(...)[5m:30s]` |
## Examples
1. Trying to nest `rate(...)` directly inside `max_over_time(...)` (invalid):
```PromQL theme={null}
# This will fail: rate() returns an instant vector, but max_over_time expects a range vector
max_over_time(rate(http_requests_total[10m]))
```
2. Correct approach using a subquery:
```PromQL theme={null}
# Compute the max rate over the last 5 minutes, with rate() grouped by 1m and subquery sampled every 30s
max_over_time(rate(http_requests_total[1m])[5m:30s])
```
3. Visualizing how a subquery returns samples:
```PromQL theme={null}
# Subquery example: evaluate rate(node_cpu_seconds_total[1m]) over the last 2 minutes at 10s resolution
rate(node_cpu_seconds_total[1m])[2m:10s]
# Example returned samples (timestamps shown):
0.991777777804683 @ 1664226130
0.991777777804683 @ 1664226140
0.991333333304358 @ 1664226150
0.991111111113807 @ 1664226160
0.991111111113807 @ 1664226170
0.991555555528651 @ 1664226180
0.9895555555561764 @ 1664226190
0.9895555555561764 @ 1664226200
0.989333333337472 @ 1664226210
0.989333333337472 @ 1664226220
0.991111111113807 @ 1664226230
```
In the example above:
* The `1m` inside `rate()` is the sample range used by `rate` for each evaluated instant.
* The outer `[2m:10s]` asks Prometheus to evaluate that `rate(...)` expression across the past 2 minutes at 10-second intervals, producing a range vector.
Be careful with very small `resolution` values (the subquery step). High-resolution subqueries can be expensive and may increase query latency and Prometheus load. Choose a resolution appropriate for the precision you need.
## Practical example: network transmit bytes
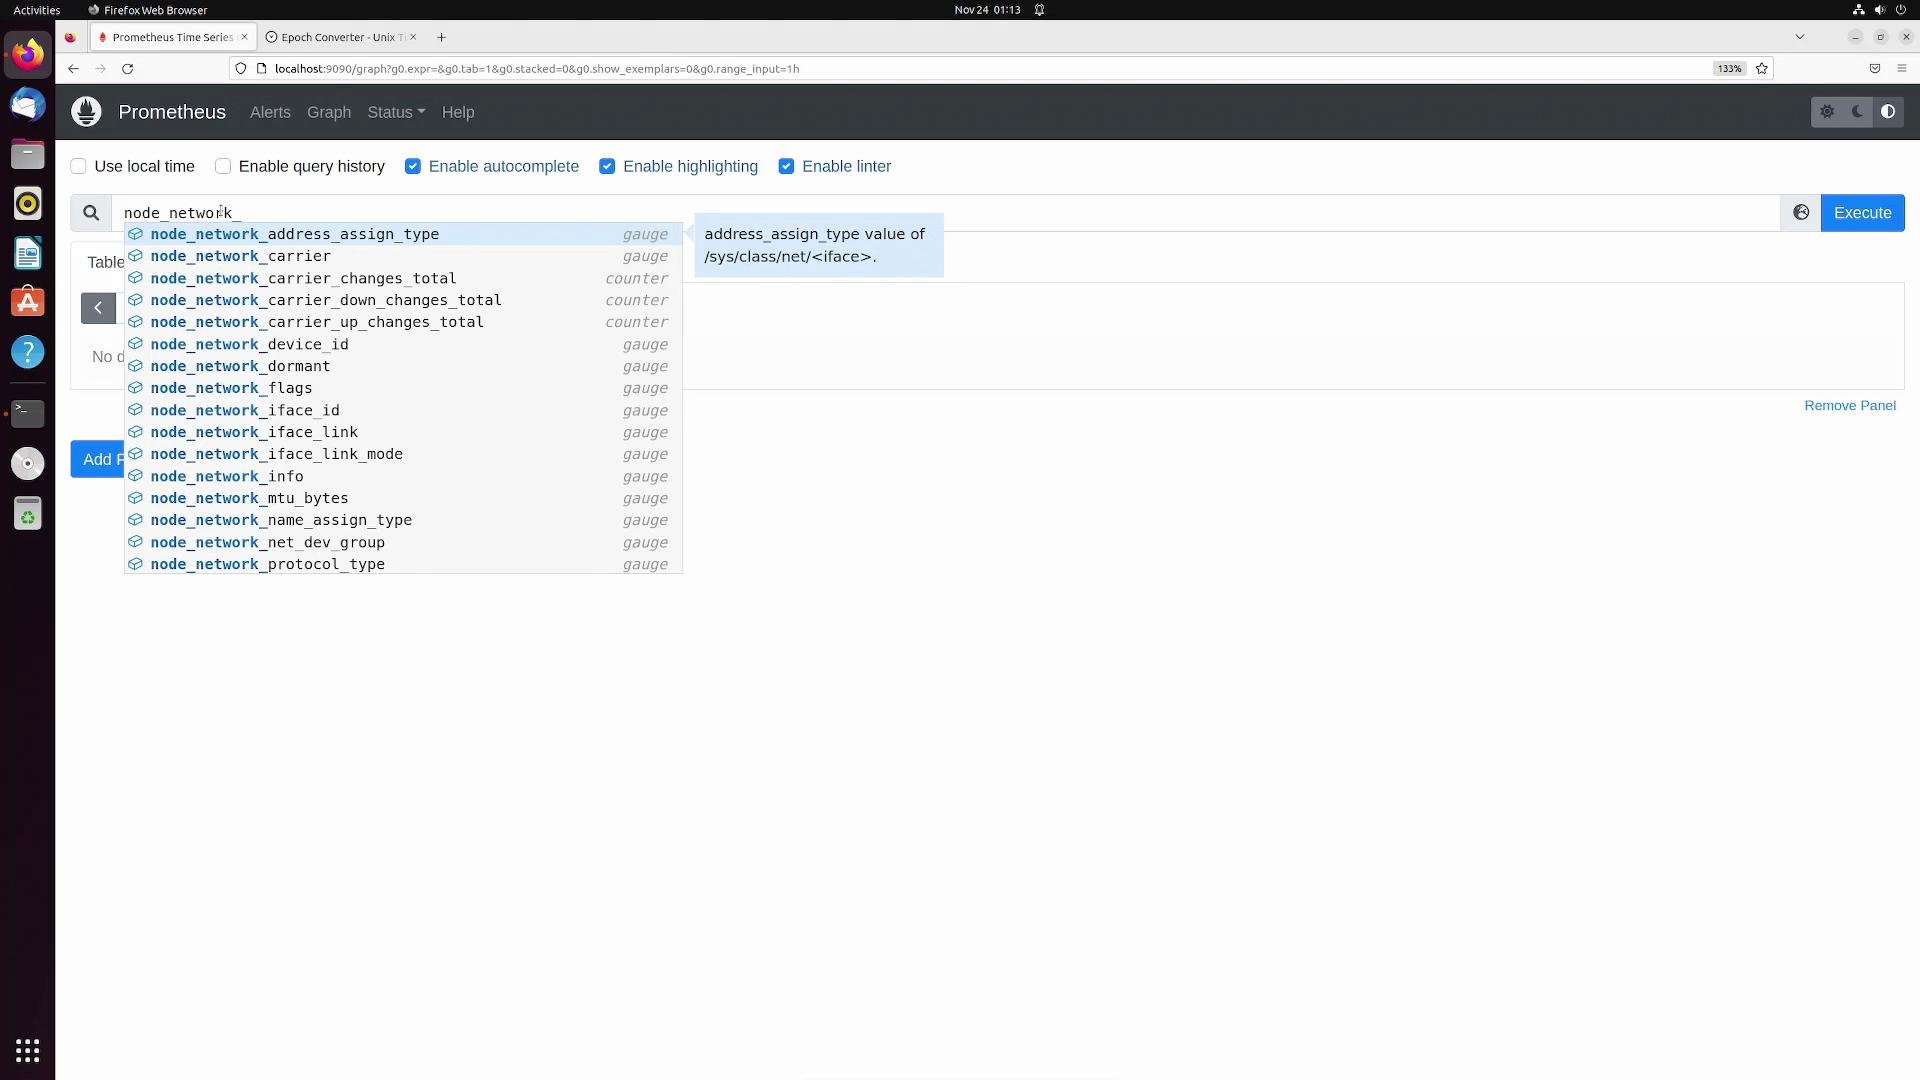
Let's use a real metric: `node_network_transmit_bytes_total` (total transmitted bytes on a network interface). To get the current transmission rate:
```PromQL theme={null}
rate(node_network_transmit_bytes_total[1m])
```
That yields the current rate per interface (an instant vector), for example:
```Prometheus theme={null}
{device="enp0s3", instance="192.168.1.168:9100", job="node"} 1556.911111111111
{device="enp0s3", instance="192.168.1.168:9200", job="node"} 1567.6
{device="lo", instance="192.168.1.168:9100", job="node"} 0
{device="lo", instance="192.168.1.168:9200", job="node"} 0
```
 To find the highest rate over the past 5 hours, use a subquery so `max_over_time` receives a range vector:
```PromQL theme={null}
max_over_time(rate(node_network_transmit_bytes_total[1m])[5h:30s])
```
* Inner `[1m]` is the `rate()` sample range (how `rate` computes an instant rate).
* Outer `[5h:30s]` requests the last 5 hours of the `rate(...)` values sampled every 30 seconds.
* `max_over_time(...)` then returns the maximum of those sampled rate values.
If you remove `max_over_time` and just run the subquery:
```promql theme={null}
rate(node_network_transmit_bytes_total[1m])[1h:30s]
```
Prometheus will return a series of sampled points for the last hour at 30-second intervals, which you can inspect or aggregate further.
## When to use subqueries
* Converting an instant-vector expression into a range vector for range aggregations (e.g., `max_over_time`, `avg_over_time`).
* Evaluating rate-like expressions historically at a chosen resolution without using recording rules.
* Performing windowed calculations over computed instant values.
## References
* [Prometheus Querying Basics](https://prometheus.io/docs/prometheus/latest/querying/basics/)
* [Prometheus Subqueries](https://prometheus.io/docs/prometheus/latest/querying/basics/#subqueries)
To find the highest rate over the past 5 hours, use a subquery so `max_over_time` receives a range vector:
```PromQL theme={null}
max_over_time(rate(node_network_transmit_bytes_total[1m])[5h:30s])
```
* Inner `[1m]` is the `rate()` sample range (how `rate` computes an instant rate).
* Outer `[5h:30s]` requests the last 5 hours of the `rate(...)` values sampled every 30 seconds.
* `max_over_time(...)` then returns the maximum of those sampled rate values.
If you remove `max_over_time` and just run the subquery:
```promql theme={null}
rate(node_network_transmit_bytes_total[1m])[1h:30s]
```
Prometheus will return a series of sampled points for the last hour at 30-second intervals, which you can inspect or aggregate further.
## When to use subqueries
* Converting an instant-vector expression into a range vector for range aggregations (e.g., `max_over_time`, `avg_over_time`).
* Evaluating rate-like expressions historically at a chosen resolution without using recording rules.
* Performing windowed calculations over computed instant values.
## References
* [Prometheus Querying Basics](https://prometheus.io/docs/prometheus/latest/querying/basics/)
* [Prometheus Subqueries](https://prometheus.io/docs/prometheus/latest/querying/basics/#subqueries)