> ## Documentation Index
> Fetch the complete documentation index at: https://notes.kodekloud.com/llms.txt
> Use this file to discover all available pages before exploring further.
# Exploring Expression Browser
> Guide to using the Prometheus expression browser to run PromQL queries, inspect and graph time series, explore status pages, and troubleshoot metrics and configuration.
In this lesson we'll walk through the Prometheus expression browser — the built-in web UI for running PromQL queries directly against your Prometheus server. You'll learn how to run ad-hoc queries, inspect raw time series, visualize results, and explore useful server pages for configuration, targets, rules, and alerts.
To open the expression browser, point your web browser to the IP or hostname of your Prometheus server and the Prometheus port (default: `9090`). For a local install, use:
`http://localhost:9090`
Key UI elements:
* Expression input: type PromQL queries here.
* Execute button: run the query at the chosen evaluation time.
* Graph / Console tabs: visualize results or view raw series.
* Autocomplete / Highlighting / History: help craft and re-run queries.
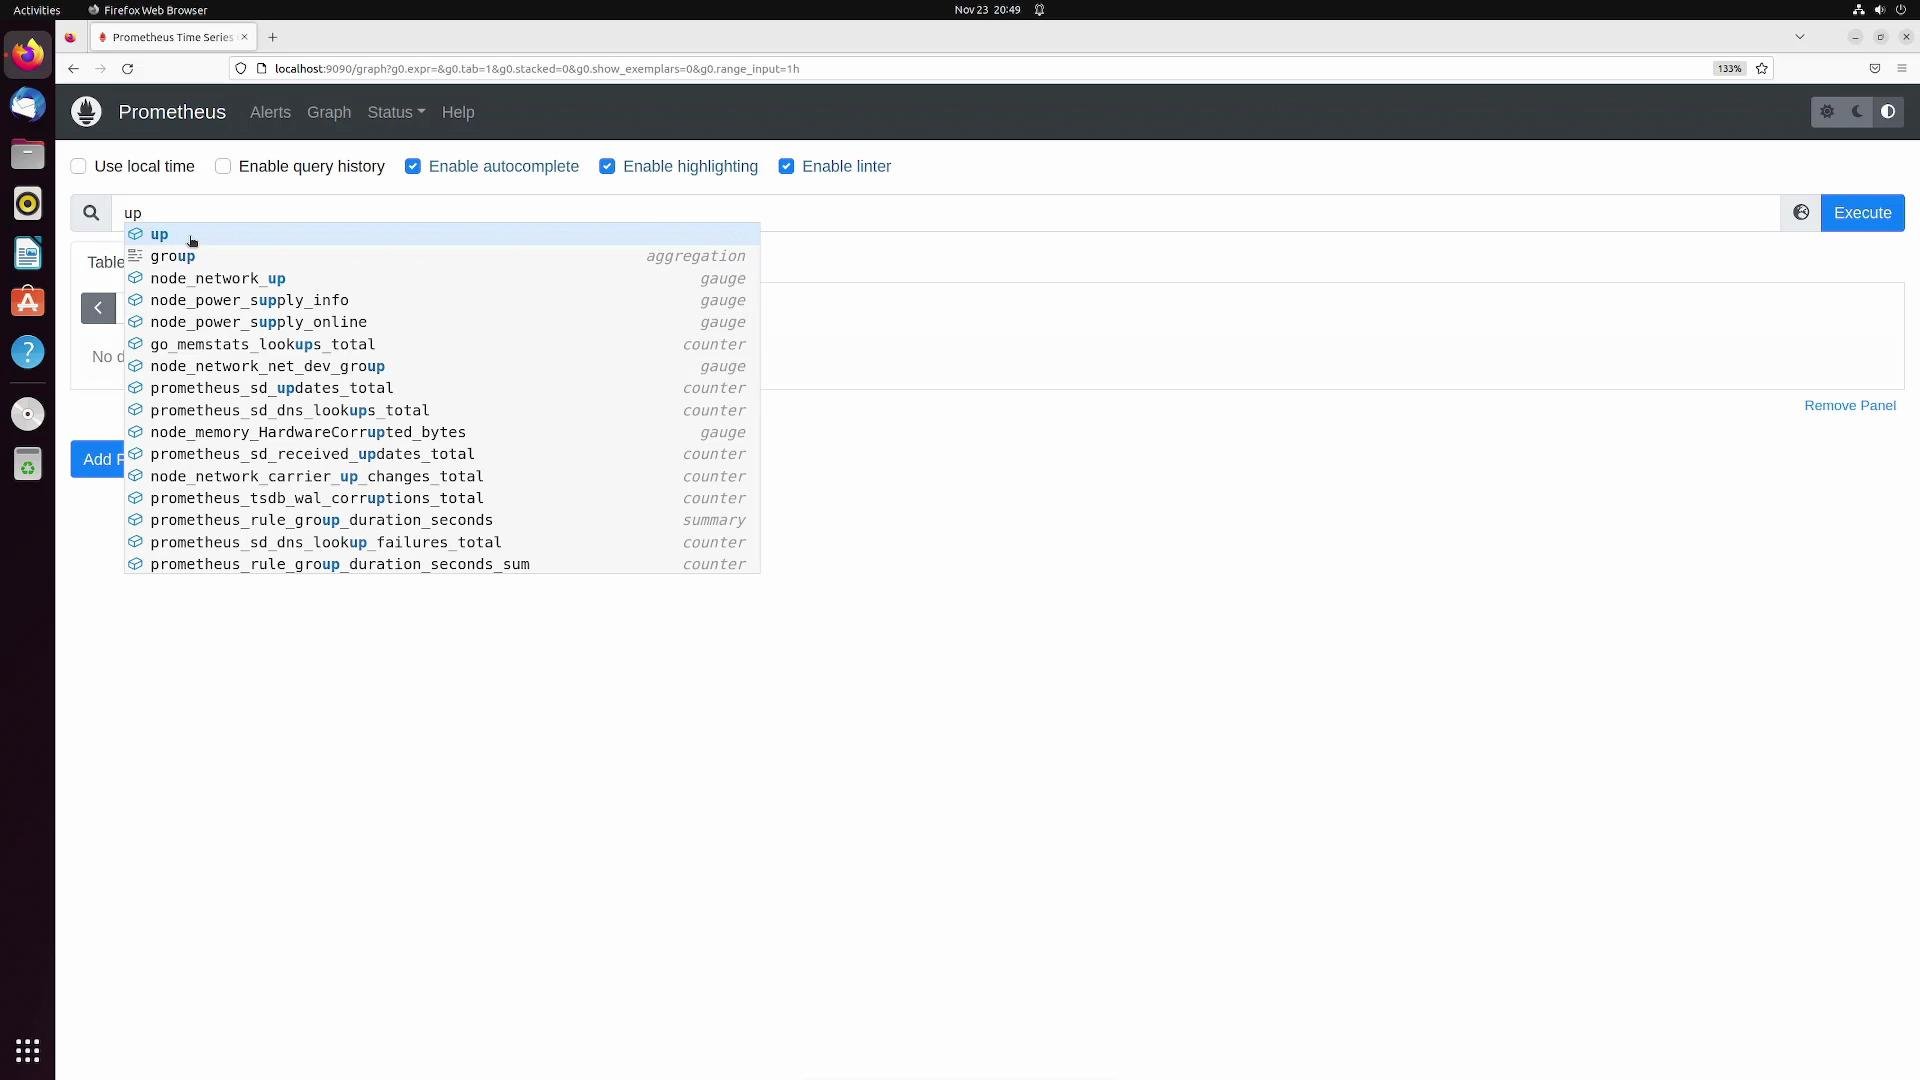
Below is the expression browser with metric autocomplete suggesting metrics related to "up".
 Basic queries
Start with a simple built-in metric, `up`, which returns one time series per monitored target with labels that identify that target. Example Console output:
```promql theme={null}
up{instance="192.168.1.168:9100", job="node"}
up{instance="192.168.21.43:80", job="ec2"}
up{instance="192.168.40.248:80", job="ec2"}
up{instance="localhost:9090", job="prometheus"}
```
* In Prometheus, a value of `1` means the target is reachable (UP).
* A value of `0` means the target is unreachable (DOWN).
* Press Execute and switch to the Console tab to see the raw series and their current values.
Drilling into metrics
More detailed metrics produce many series — for example, CPU metrics are split by CPU/core, mode, instance, and job. Example:
```promql theme={null}
node_cpu_seconds_total{cpu="0", instance="192.168.1.168:9100", job="node", mode="idle"} 1434.34
node_cpu_seconds_total{cpu="0", instance="192.168.1.168:9100", job="node", mode="iowait"} 7.67
node_cpu_seconds_total{cpu="0", instance="192.168.1.168:9100", job="node", mode="irq"} 0
node_cpu_seconds_total{cpu="0", instance="192.168.1.168:9100", job="node", mode="nice"} 24.7
node_cpu_seconds_total{cpu="0", instance="192.168.1.168:9100", job="node", mode="softirq"} 0.51
node_cpu_seconds_total{cpu="0", instance="192.168.1.168:9100", job="node", mode="steal"} 0
node_cpu_seconds_total{cpu="0", instance="192.168.1.168:9100", job="node", mode="system"} 21.6
node_cpu_seconds_total{cpu="0", instance="192.168.1.168:9100", job="node", mode="user"} 60.38
```
Time-travel evaluation
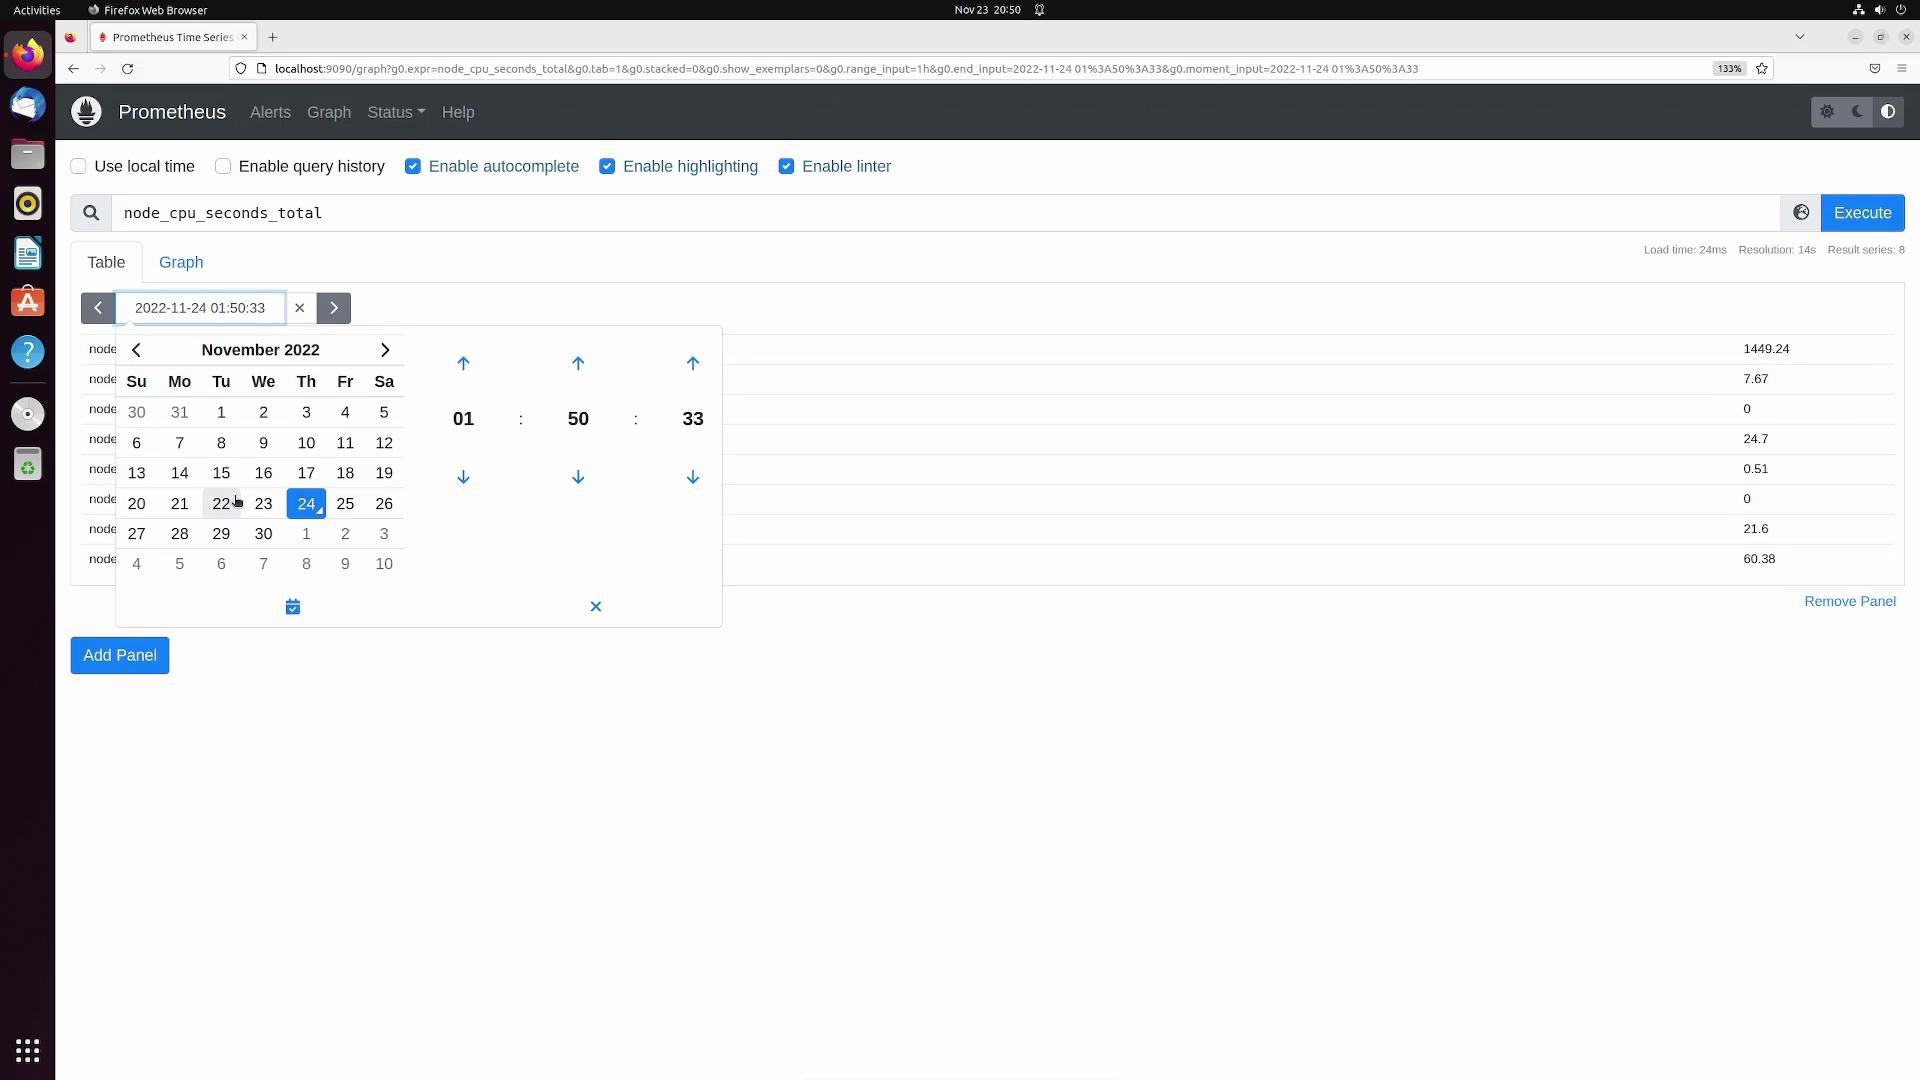
The expression browser supports historical evaluation. Use the calendar/time selector to set a past evaluation time and re-run the query to see values at that timestamp.
Basic queries
Start with a simple built-in metric, `up`, which returns one time series per monitored target with labels that identify that target. Example Console output:
```promql theme={null}
up{instance="192.168.1.168:9100", job="node"}
up{instance="192.168.21.43:80", job="ec2"}
up{instance="192.168.40.248:80", job="ec2"}
up{instance="localhost:9090", job="prometheus"}
```
* In Prometheus, a value of `1` means the target is reachable (UP).
* A value of `0` means the target is unreachable (DOWN).
* Press Execute and switch to the Console tab to see the raw series and their current values.
Drilling into metrics
More detailed metrics produce many series — for example, CPU metrics are split by CPU/core, mode, instance, and job. Example:
```promql theme={null}
node_cpu_seconds_total{cpu="0", instance="192.168.1.168:9100", job="node", mode="idle"} 1434.34
node_cpu_seconds_total{cpu="0", instance="192.168.1.168:9100", job="node", mode="iowait"} 7.67
node_cpu_seconds_total{cpu="0", instance="192.168.1.168:9100", job="node", mode="irq"} 0
node_cpu_seconds_total{cpu="0", instance="192.168.1.168:9100", job="node", mode="nice"} 24.7
node_cpu_seconds_total{cpu="0", instance="192.168.1.168:9100", job="node", mode="softirq"} 0.51
node_cpu_seconds_total{cpu="0", instance="192.168.1.168:9100", job="node", mode="steal"} 0
node_cpu_seconds_total{cpu="0", instance="192.168.1.168:9100", job="node", mode="system"} 21.6
node_cpu_seconds_total{cpu="0", instance="192.168.1.168:9100", job="node", mode="user"} 60.38
```
Time-travel evaluation
The expression browser supports historical evaluation. Use the calendar/time selector to set a past evaluation time and re-run the query to see values at that timestamp.
 Graphing queries
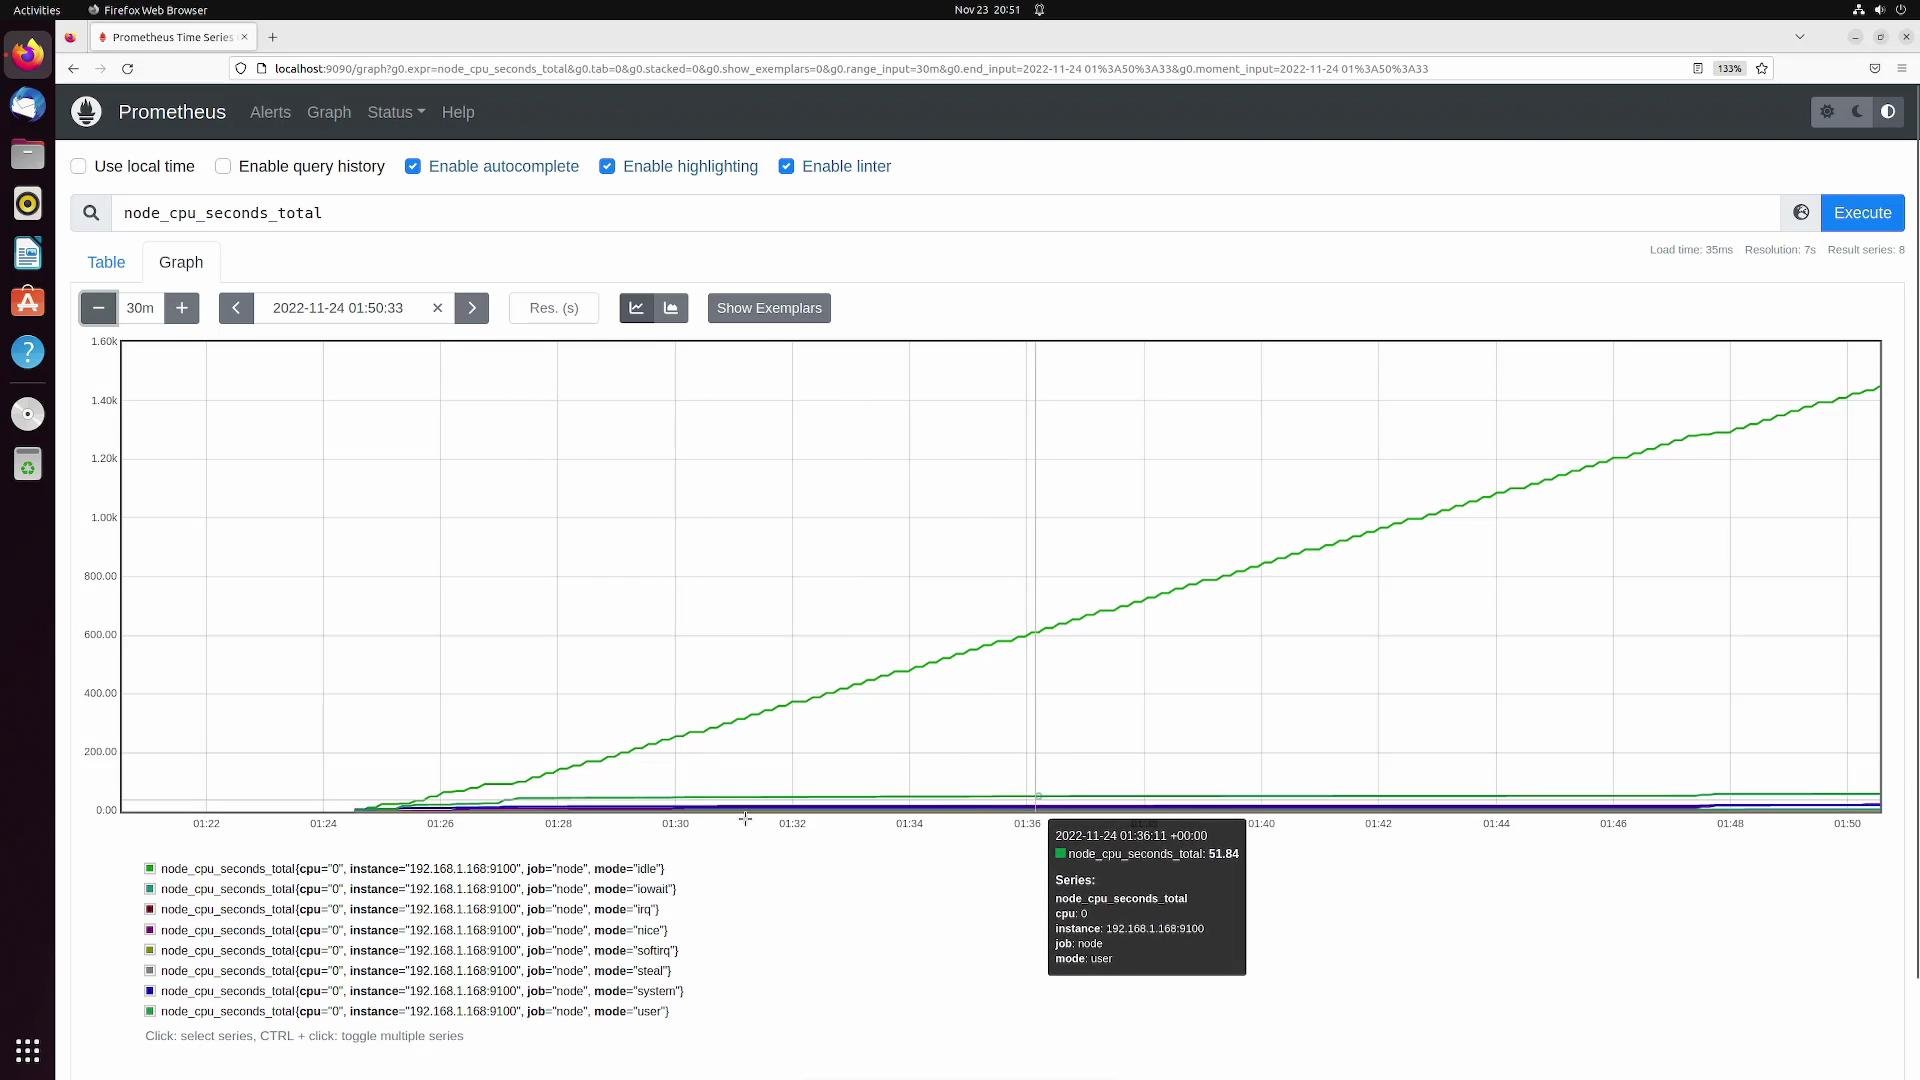
Switch to the Graph tab to visualize query results over a time range. You can:
* Adjust the time window (e.g., 1h, 30m, custom range).
* Choose chart styles and display options.
* Filter or aggregate series if a metric returns many lines (otherwise all series will be plotted).
Graphing queries
Switch to the Graph tab to visualize query results over a time range. You can:
* Adjust the time window (e.g., 1h, 30m, custom range).
* Choose chart styles and display options.
* Filter or aggregate series if a metric returns many lines (otherwise all series will be plotted).
 Query authoring helpers
The expression input includes autocomplete, syntax highlighting, and a query history — toggle these features via the checkboxes in the UI. Use autocomplete to discover metric names and label keys quickly.
Useful server pages
The expression browser exposes several server pages under the Status and main navigation menus. These pages are essential for debugging Prometheus itself.
| Page | Purpose | What you’ll find |
| ------------------------ | ------------------------------------ | ------------------------------------------------------------------------------------------------ |
| `Status > Configuration` | Inspect the active Prometheus config | The YAML file Prometheus loaded at startup (scrape intervals, scrape configs, alerting settings) |
| `Status > Targets` | Troubleshoot scraping issues | All scrape targets, their UP/DOWN status, last scrape time, and scrape errors |
| `Status > Rules` | View recording & alerting rules | Loaded recording rules and alerting rules with evaluation state |
| `Alerts` | Review alerts | Active and pending alerts generated from alerting rules |
Example (truncated) of a running `prometheus.yml` shown on the Configuration page:
```yaml theme={null}
global:
scrape_interval: 15s
evaluation_interval: 15s
alerting:
alertmanagers:
- follow_redirects: true
enable_http2: true
scheme: http
timeout: 10s
api_version: v2
static_configs:
- targets: []
scrape_configs:
- job_name: prometheus
honor_timestamps: true
scrape_interval: 15s
scrape_timeout: 10s
metrics_path: /metrics
scheme: http
follow_redirects: true
enable_http2: true
static_configs:
- targets:
- localhost:9090
- job_name: node
honor_timestamps: true
scrape_interval: 15s
scrape_timeout: 10s
metrics_path: /metrics
scheme: http
follow_redirects: true
enable_http2: true
static_configs:
- targets:
- 192.168.1.168:9100
- job_name: ec2
honor_timestamps: true
scrape_interval: 15s
scrape_timeout: 10s
metrics_path: /metrics
scheme: http
follow_redirects: true
enable_http2: true
static_configs:
- targets: []
```
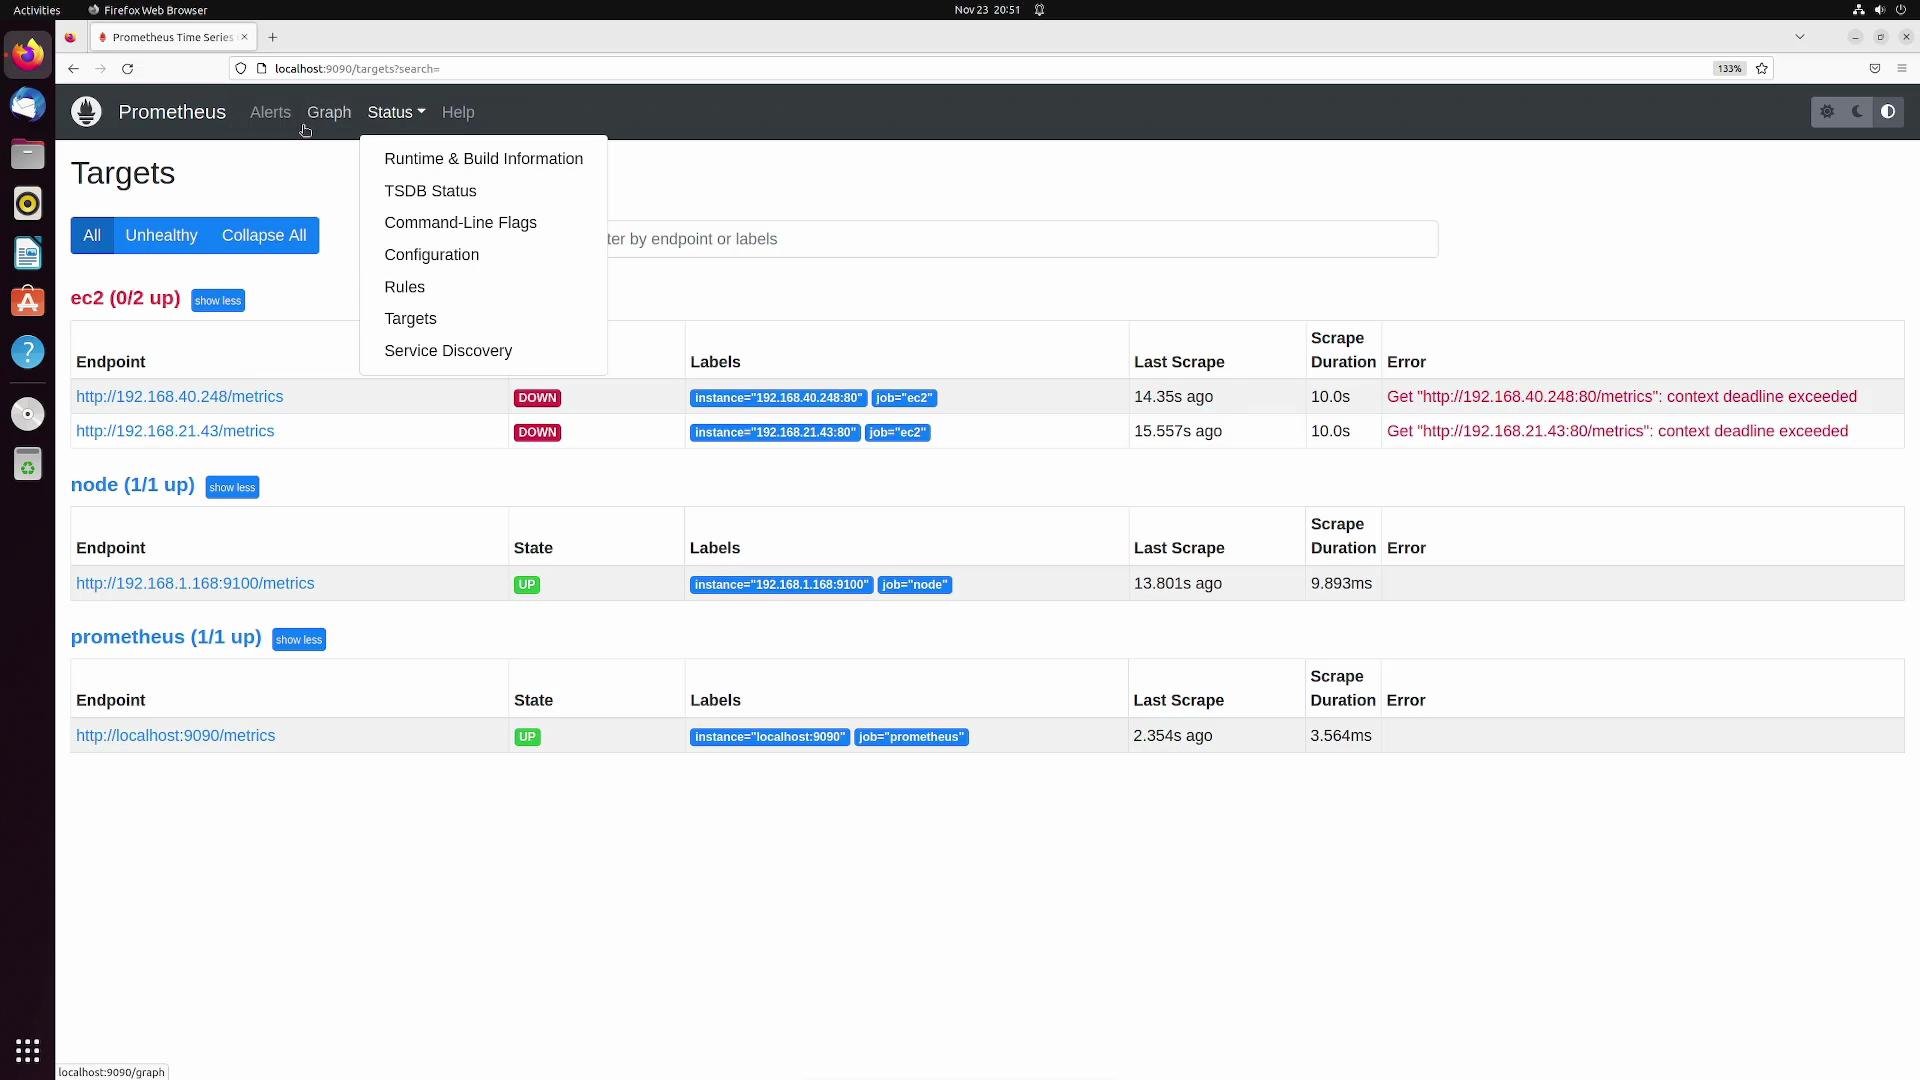
The Targets page helps you spot unreachable endpoints and scrape errors. The example below shows some endpoints marked DOWN with scrape errors and others UP:
Query authoring helpers
The expression input includes autocomplete, syntax highlighting, and a query history — toggle these features via the checkboxes in the UI. Use autocomplete to discover metric names and label keys quickly.
Useful server pages
The expression browser exposes several server pages under the Status and main navigation menus. These pages are essential for debugging Prometheus itself.
| Page | Purpose | What you’ll find |
| ------------------------ | ------------------------------------ | ------------------------------------------------------------------------------------------------ |
| `Status > Configuration` | Inspect the active Prometheus config | The YAML file Prometheus loaded at startup (scrape intervals, scrape configs, alerting settings) |
| `Status > Targets` | Troubleshoot scraping issues | All scrape targets, their UP/DOWN status, last scrape time, and scrape errors |
| `Status > Rules` | View recording & alerting rules | Loaded recording rules and alerting rules with evaluation state |
| `Alerts` | Review alerts | Active and pending alerts generated from alerting rules |
Example (truncated) of a running `prometheus.yml` shown on the Configuration page:
```yaml theme={null}
global:
scrape_interval: 15s
evaluation_interval: 15s
alerting:
alertmanagers:
- follow_redirects: true
enable_http2: true
scheme: http
timeout: 10s
api_version: v2
static_configs:
- targets: []
scrape_configs:
- job_name: prometheus
honor_timestamps: true
scrape_interval: 15s
scrape_timeout: 10s
metrics_path: /metrics
scheme: http
follow_redirects: true
enable_http2: true
static_configs:
- targets:
- localhost:9090
- job_name: node
honor_timestamps: true
scrape_interval: 15s
scrape_timeout: 10s
metrics_path: /metrics
scheme: http
follow_redirects: true
enable_http2: true
static_configs:
- targets:
- 192.168.1.168:9100
- job_name: ec2
honor_timestamps: true
scrape_interval: 15s
scrape_timeout: 10s
metrics_path: /metrics
scheme: http
follow_redirects: true
enable_http2: true
static_configs:
- targets: []
```
The Targets page helps you spot unreachable endpoints and scrape errors. The example below shows some endpoints marked DOWN with scrape errors and others UP:
 Best practices and next steps
Use the expression browser for exploratory, ad-hoc queries and troubleshooting. For long-term dashboards and richer visualizations, connect Prometheus to [Grafana](https://grafana.com/) and build persistent dashboards there.
Do not expose the Prometheus expression browser directly to the public internet. Use network controls, authentication proxies, or restricted access to avoid leaking metrics and configuration.
Links and references
* Prometheus: [https://prometheus.io/](https://prometheus.io/)
* PromQL basics: [https://prometheus.io/docs/prometheus/latest/querying/basics/](https://prometheus.io/docs/prometheus/latest/querying/basics/)
* Grafana: [https://grafana.com/](https://grafana.com/)
Summary
This covers the core usage of the Prometheus expression browser:
* Run PromQL queries and use autocomplete to author queries faster.
* View raw time series in the Console and plot metrics in the Graph tab.
* Use time-travel evaluation to inspect historical metric values.
* Inspect Prometheus configuration, targets, rules, and alerts via the server pages for effective troubleshooting and monitoring.
Best practices and next steps
Use the expression browser for exploratory, ad-hoc queries and troubleshooting. For long-term dashboards and richer visualizations, connect Prometheus to [Grafana](https://grafana.com/) and build persistent dashboards there.
Do not expose the Prometheus expression browser directly to the public internet. Use network controls, authentication proxies, or restricted access to avoid leaking metrics and configuration.
Links and references
* Prometheus: [https://prometheus.io/](https://prometheus.io/)
* PromQL basics: [https://prometheus.io/docs/prometheus/latest/querying/basics/](https://prometheus.io/docs/prometheus/latest/querying/basics/)
* Grafana: [https://grafana.com/](https://grafana.com/)
Summary
This covers the core usage of the Prometheus expression browser:
* Run PromQL queries and use autocomplete to author queries faster.
* View raw time series in the Console and plot metrics in the Graph tab.
* Use time-travel evaluation to inspect historical metric values.
* Inspect Prometheus configuration, targets, rules, and alerts via the server pages for effective troubleshooting and monitoring.