> ## Documentation Index
> Fetch the complete documentation index at: https://notes.kodekloud.com/llms.txt
> Use this file to discover all available pages before exploring further.
# Monitoring Containers
> Guide to monitoring Docker and containers with Prometheus using Docker Engine metrics and cAdvisor for per container resource visibility, setup, scraping, and troubleshooting
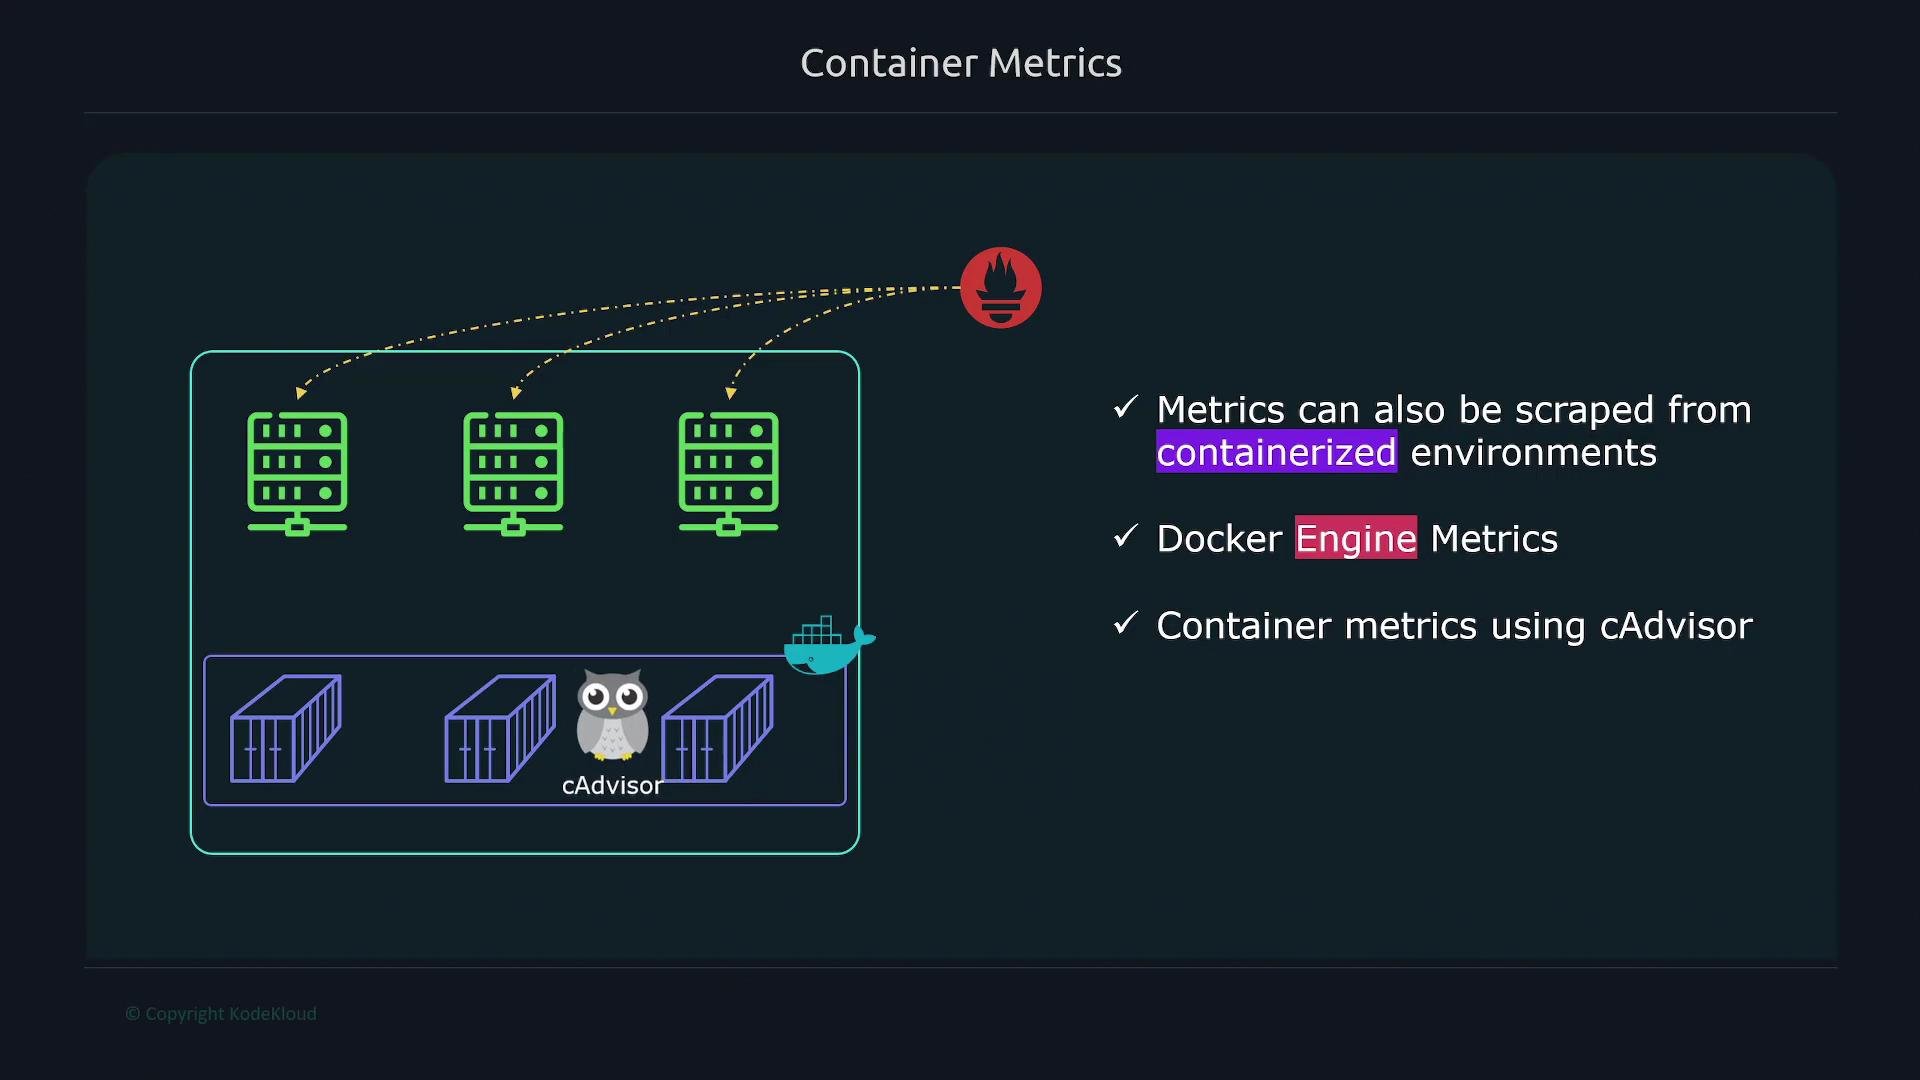
We previously configured Prometheus to collect metrics from Linux hosts. This guide extends that setup to containerized environments. You can collect two complementary metric sets:
* Docker Engine metrics — metrics about the Docker daemon/engine itself.
* Per-container metrics — detailed container-level CPU, memory, filesystem, and process information exposed by cAdvisor.
Collecting both provides full-stack observability: engine-level health and per-container resource usage.
 ## 1. Enable Docker Engine metrics
Docker can expose runtime metrics directly from the daemon. This is useful for monitoring the Docker engine itself (daemon CPU, errors, image/operation counts, etc.), and is configured on the host running Docker.
Create or edit `/etc/docker/daemon.json` and add the metrics address and enable experimental features:
```json theme={null}
{
"metrics-addr": "127.0.0.1:9323",
"experimental": true
}
```
Exposing Docker metrics via the daemon is an experimental feature. Use it for testing or in environments where experimental features are acceptable.
Restart Docker and verify the metrics endpoint is reachable:
```bash theme={null}
# restart docker
$ sudo systemctl restart docker
# verify metrics endpoint
$ curl http://localhost:9323/metrics
```
Then add a Prometheus scrape job to pull those metrics. If Prometheus runs on a different host, replace `127.0.0.1` with the Docker host IP or hostname:
```yaml theme={null}
scrape_configs:
- job_name: "docker"
static_configs:
- targets: ["12.1.13.4:9323"]
```
Notes:
* Use a stable hostname or IP for the target so Prometheus can reliably scrape metrics.
* Consider network/firewall rules and authentication if scraping remotely.
## 2. Enable cAdvisor for per-container metrics
cAdvisor (Container Advisor) provides per-container metrics: CPU, memory, filesystem usage, process counts, and container uptime. Run cAdvisor on the Docker host so it can inspect containers and the host filesystem.
Example `docker-compose.yml` for cAdvisor:
```yaml theme={null}
version: '3.4'
services:
cadvisor:
image: gcr.io/cadvisor/cadvisor
container_name: cadvisor
privileged: true
devices:
- "/dev/kmsg:/dev/kmsg"
volumes:
- /:/rootfs:ro
- /var/run:/var/run:ro
- /sys:/sys:ro
- /var/lib/docker:/var/lib/docker:ro
- /dev/disk:/dev/disk:ro
ports:
- 8080:8080
```
Start cAdvisor and confirm its metrics endpoint:
```bash theme={null}
$ docker-compose up -d
$ curl http://localhost:8080/metrics
```
If you need the project source or more configuration options, see the cAdvisor repository: `https://github.com/google/cadvisor`.
cAdvisor requires elevated privileges and host volumes to provide accurate metrics. Run it only on trusted hosts and review security implications (`privileged: true`, host mounts).
Add a Prometheus scrape job for cAdvisor (replace the host/IP as needed):
```yaml theme={null}
scrape_configs:
- job_name: "cadvisor"
static_configs:
- targets: ["12.1.13.4:8080"]
```
## 3. What metrics to expect
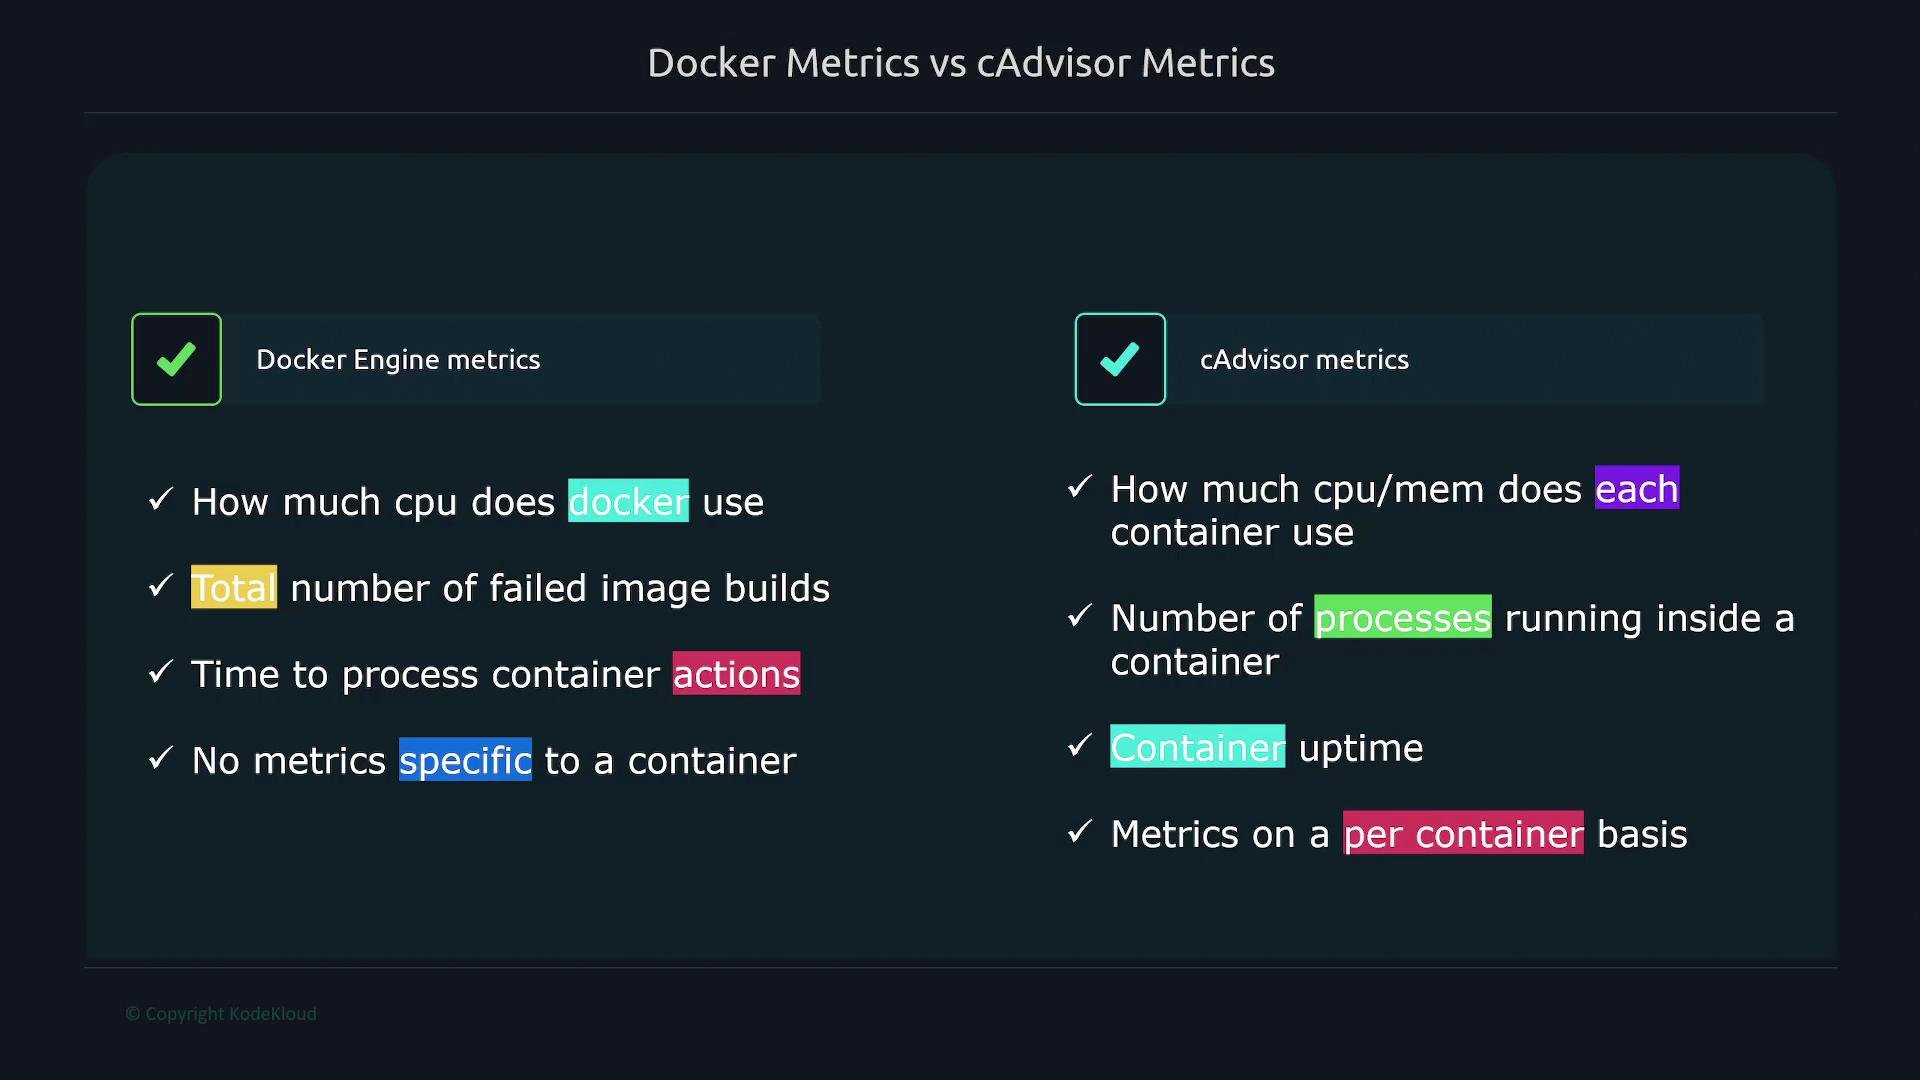
* Docker Engine metrics: engine/daemon-level metrics such as daemon CPU usage, queue lengths, API request durations, image build counts, and engine errors.
* cAdvisor metrics: per-container resource metrics — CPU and memory usage by container, filesystem I/O, process counts inside containers, and container lifetime statistics.
Use Docker Engine metrics to monitor the health and behavior of the Docker daemon. Use cAdvisor for container-level resource visibility and troubleshooting.
## 4. Quick comparison
| Metric Source | Exposed Metrics | Typical Use Case | Notes |
| ------------- | ------------------------------------------------------------ | ---------------------------------------------------- | ------------------------------------------------------------ |
| Docker Engine | Daemon CPU, internal counters, API operation metrics | Monitor Docker daemon health and operational metrics | Enabled via `daemon.json` and experimental `metrics-addr` |
| cAdvisor | CPU/memory per container, filesystem, process counts, uptime | Per-container resource usage and debugging | Runs as a container; needs privileged access and host mounts |
## 5. Troubleshooting checklist
* If `curl` to the metrics endpoint times out, check firewall rules and whether Docker/cAdvisor is bound to localhost vs 0.0.0.0.
* Use correct host/IP in Prometheus `targets` when Prometheus is remote.
* Confirm container mounts and privileges for cAdvisor if metrics are missing or incomplete.
* Check Docker daemon logs (`sudo journalctl -u docker`) for errors after editing `daemon.json`.
## Links and references
* Prometheus documentation: [https://prometheus.io/docs/](https://prometheus.io/docs/)
* cAdvisor GitHub: `https://github.com/google/cadvisor`
* Docker daemon docs: [https://docs.docker.com/engine/reference/commandline/dockerd/#daemon-configuration-file](https://docs.docker.com/engine/reference/commandline/dockerd/#daemon-configuration-file)
## 1. Enable Docker Engine metrics
Docker can expose runtime metrics directly from the daemon. This is useful for monitoring the Docker engine itself (daemon CPU, errors, image/operation counts, etc.), and is configured on the host running Docker.
Create or edit `/etc/docker/daemon.json` and add the metrics address and enable experimental features:
```json theme={null}
{
"metrics-addr": "127.0.0.1:9323",
"experimental": true
}
```
Exposing Docker metrics via the daemon is an experimental feature. Use it for testing or in environments where experimental features are acceptable.
Restart Docker and verify the metrics endpoint is reachable:
```bash theme={null}
# restart docker
$ sudo systemctl restart docker
# verify metrics endpoint
$ curl http://localhost:9323/metrics
```
Then add a Prometheus scrape job to pull those metrics. If Prometheus runs on a different host, replace `127.0.0.1` with the Docker host IP or hostname:
```yaml theme={null}
scrape_configs:
- job_name: "docker"
static_configs:
- targets: ["12.1.13.4:9323"]
```
Notes:
* Use a stable hostname or IP for the target so Prometheus can reliably scrape metrics.
* Consider network/firewall rules and authentication if scraping remotely.
## 2. Enable cAdvisor for per-container metrics
cAdvisor (Container Advisor) provides per-container metrics: CPU, memory, filesystem usage, process counts, and container uptime. Run cAdvisor on the Docker host so it can inspect containers and the host filesystem.
Example `docker-compose.yml` for cAdvisor:
```yaml theme={null}
version: '3.4'
services:
cadvisor:
image: gcr.io/cadvisor/cadvisor
container_name: cadvisor
privileged: true
devices:
- "/dev/kmsg:/dev/kmsg"
volumes:
- /:/rootfs:ro
- /var/run:/var/run:ro
- /sys:/sys:ro
- /var/lib/docker:/var/lib/docker:ro
- /dev/disk:/dev/disk:ro
ports:
- 8080:8080
```
Start cAdvisor and confirm its metrics endpoint:
```bash theme={null}
$ docker-compose up -d
$ curl http://localhost:8080/metrics
```
If you need the project source or more configuration options, see the cAdvisor repository: `https://github.com/google/cadvisor`.
cAdvisor requires elevated privileges and host volumes to provide accurate metrics. Run it only on trusted hosts and review security implications (`privileged: true`, host mounts).
Add a Prometheus scrape job for cAdvisor (replace the host/IP as needed):
```yaml theme={null}
scrape_configs:
- job_name: "cadvisor"
static_configs:
- targets: ["12.1.13.4:8080"]
```
## 3. What metrics to expect
* Docker Engine metrics: engine/daemon-level metrics such as daemon CPU usage, queue lengths, API request durations, image build counts, and engine errors.
* cAdvisor metrics: per-container resource metrics — CPU and memory usage by container, filesystem I/O, process counts inside containers, and container lifetime statistics.
Use Docker Engine metrics to monitor the health and behavior of the Docker daemon. Use cAdvisor for container-level resource visibility and troubleshooting.
## 4. Quick comparison
| Metric Source | Exposed Metrics | Typical Use Case | Notes |
| ------------- | ------------------------------------------------------------ | ---------------------------------------------------- | ------------------------------------------------------------ |
| Docker Engine | Daemon CPU, internal counters, API operation metrics | Monitor Docker daemon health and operational metrics | Enabled via `daemon.json` and experimental `metrics-addr` |
| cAdvisor | CPU/memory per container, filesystem, process counts, uptime | Per-container resource usage and debugging | Runs as a container; needs privileged access and host mounts |
## 5. Troubleshooting checklist
* If `curl` to the metrics endpoint times out, check firewall rules and whether Docker/cAdvisor is bound to localhost vs 0.0.0.0.
* Use correct host/IP in Prometheus `targets` when Prometheus is remote.
* Confirm container mounts and privileges for cAdvisor if metrics are missing or incomplete.
* Check Docker daemon logs (`sudo journalctl -u docker`) for errors after editing `daemon.json`.
## Links and references
* Prometheus documentation: [https://prometheus.io/docs/](https://prometheus.io/docs/)
* cAdvisor GitHub: `https://github.com/google/cadvisor`
* Docker daemon docs: [https://docs.docker.com/engine/reference/commandline/dockerd/#daemon-configuration-file](https://docs.docker.com/engine/reference/commandline/dockerd/#daemon-configuration-file)