> ## Documentation Index
> Fetch the complete documentation index at: https://notes.kodekloud.com/llms.txt
> Use this file to discover all available pages before exploring further.
# Node Exporter
> Guide to installing and configuring Prometheus Node Exporter to expose Linux system metrics for Prometheus scraping, including examples, security tips, and service setup.
Node Exporter is the standard Prometheus exporter for collecting hardware- and OS-level metrics from Linux hosts. It exposes CPU, memory, disk, network, kernel, and many other system metrics on an HTTP endpoint that Prometheus can scrape.
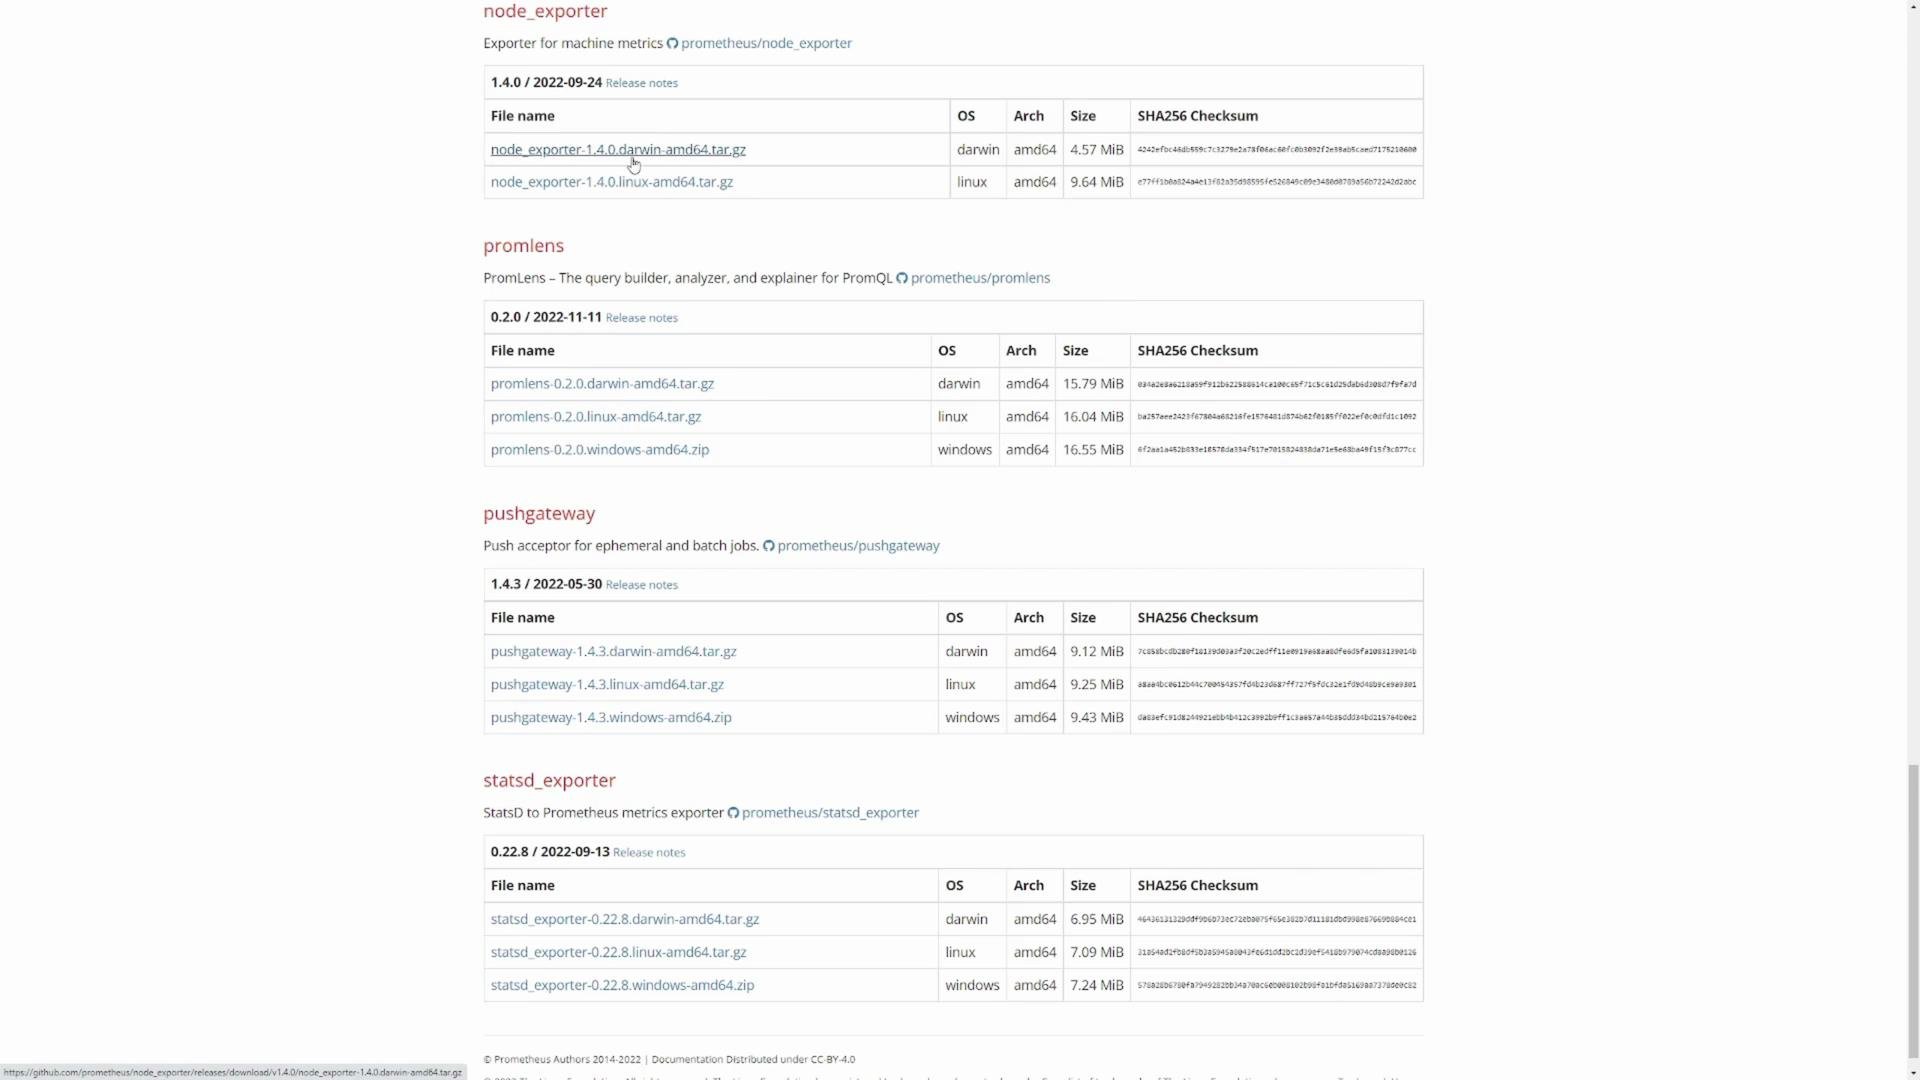
To install Node Exporter, download the appropriate binary for your OS/architecture from the Prometheus downloads page and run it on the host you want to monitor. Always choose the latest stable release compatible with your environment.
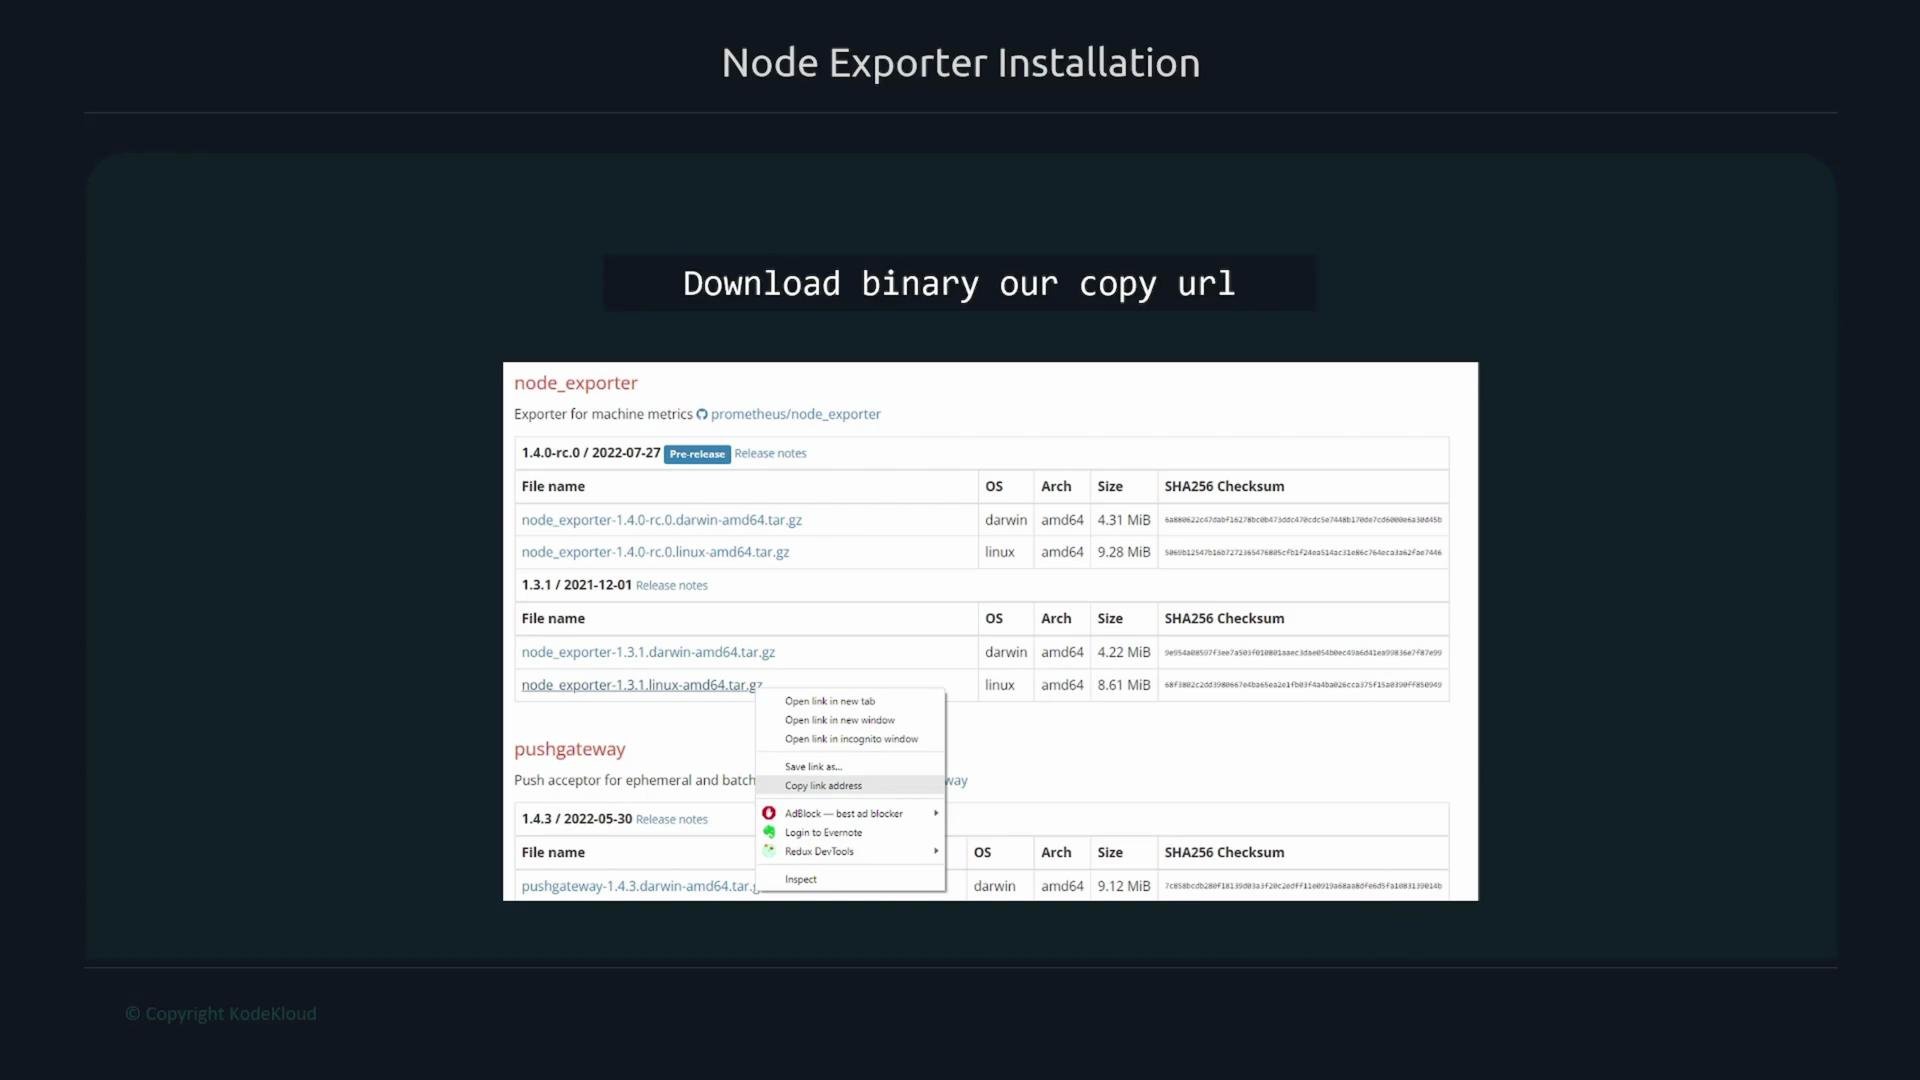 Download the Node Exporter binary that matches your OS/architecture. Optionally verify the SHA256 checksum listed on the release page with `sha256sum` before extracting the archive.
## Quick install (Linux example)
1. Copy the download URL for the Node Exporter release that matches your architecture.
2. Download the tarball with `wget` (or `curl`).
3. Extract and run the binary.
Example commands:
```bash theme={null}
# Replace the URL below with the exact URL you copied for your chosen version/arch
wget https://github.com/prometheus/node_exporter/releases/download/v1.3.1/node_exporter-1.3.1.linux-amd64.tar.gz
tar xvf node_exporter-1.3.1.linux-amd64.tar.gz
cd node_exporter-1.3.1.linux-amd64
./node_exporter
```
When Node Exporter starts successfully, it logs the enabled collectors and the listening address. By default it listens on port 9100.
Example log output:
```plaintext theme={null}
level=info ts=2022-09-05T16:51:59.947Z caller=node_exporter.go:199 msg="Listening on" address=:9100
level=info ts=2022-09-05T16:51:59.947Z caller=tls_config.go:195 msg="TLS is disabled." http2=false
```
Verify the metrics endpoint is responding:
```bash theme={null}
curl localhost:9100/metrics
```
Example snippet of the metrics output:
```plaintext theme={null}
# TYPE node_timex_tick_seconds gauge
node_timex_tick_seconds 0.01
# HELP node_udp_queues Number of allocated memory in the kernel for UDP datagrams in bytes.
# TYPE node_udp_queues gauge
node_udp_queues{ip="v4",queue="rx"} 1
node_udp_queues{ip="v4",queue="tx"} 0
node_udp_queues{ip="v6",queue="rx"} 0
node_udp_queues{ip="v6",queue="tx"} 0
# HELP node_uname_info Labeled system information as provided by the uname system call.
# TYPE node_uname_info gauge
node_uname_info{domainname="(none)",machine="x86_64",nodename="user2",release="5.15.0-52-generic",sysname="Linux",version="#58-Ubuntu SMP Thu Oct 13 08:03:55 UTC 2022"} 1
# HELP process_cpu_seconds_total Total user and system CPU time spent in seconds.
# TYPE process_cpu_seconds_total counter
process_cpu_seconds_total 0
# HELP process_max_fds Maximum number of open file descriptors.
# TYPE process_max_fds gauge
process_max_fds 0.148576e+06
```
The metrics endpoint includes many metrics collected by Node Exporter (CPU, memory, network, disk, kernel stats, etc.). Prometheus can scrape this endpoint to ingest those metrics.
If you prefer to pick the artifact from the website UI, right-click the specific Node Exporter artifact on the Prometheus download page and copy its link address, then use `wget` with that URL.
Download the Node Exporter binary that matches your OS/architecture. Optionally verify the SHA256 checksum listed on the release page with `sha256sum` before extracting the archive.
## Quick install (Linux example)
1. Copy the download URL for the Node Exporter release that matches your architecture.
2. Download the tarball with `wget` (or `curl`).
3. Extract and run the binary.
Example commands:
```bash theme={null}
# Replace the URL below with the exact URL you copied for your chosen version/arch
wget https://github.com/prometheus/node_exporter/releases/download/v1.3.1/node_exporter-1.3.1.linux-amd64.tar.gz
tar xvf node_exporter-1.3.1.linux-amd64.tar.gz
cd node_exporter-1.3.1.linux-amd64
./node_exporter
```
When Node Exporter starts successfully, it logs the enabled collectors and the listening address. By default it listens on port 9100.
Example log output:
```plaintext theme={null}
level=info ts=2022-09-05T16:51:59.947Z caller=node_exporter.go:199 msg="Listening on" address=:9100
level=info ts=2022-09-05T16:51:59.947Z caller=tls_config.go:195 msg="TLS is disabled." http2=false
```
Verify the metrics endpoint is responding:
```bash theme={null}
curl localhost:9100/metrics
```
Example snippet of the metrics output:
```plaintext theme={null}
# TYPE node_timex_tick_seconds gauge
node_timex_tick_seconds 0.01
# HELP node_udp_queues Number of allocated memory in the kernel for UDP datagrams in bytes.
# TYPE node_udp_queues gauge
node_udp_queues{ip="v4",queue="rx"} 1
node_udp_queues{ip="v4",queue="tx"} 0
node_udp_queues{ip="v6",queue="rx"} 0
node_udp_queues{ip="v6",queue="tx"} 0
# HELP node_uname_info Labeled system information as provided by the uname system call.
# TYPE node_uname_info gauge
node_uname_info{domainname="(none)",machine="x86_64",nodename="user2",release="5.15.0-52-generic",sysname="Linux",version="#58-Ubuntu SMP Thu Oct 13 08:03:55 UTC 2022"} 1
# HELP process_cpu_seconds_total Total user and system CPU time spent in seconds.
# TYPE process_cpu_seconds_total counter
process_cpu_seconds_total 0
# HELP process_max_fds Maximum number of open file descriptors.
# TYPE process_max_fds gauge
process_max_fds 0.148576e+06
```
The metrics endpoint includes many metrics collected by Node Exporter (CPU, memory, network, disk, kernel stats, etc.). Prometheus can scrape this endpoint to ingest those metrics.
If you prefer to pick the artifact from the website UI, right-click the specific Node Exporter artifact on the Prometheus download page and copy its link address, then use `wget` with that URL.
 Exposing the metrics endpoint publicly can leak system details. Restrict access with a firewall, network ACLs, or run Node Exporter behind a VPN. Consider removing or protecting sensitive metrics if necessary.
## Add Node Exporter to Prometheus scrape targets
After Node Exporter is running and reachable on port 9100, add the host as a scrape target in your `prometheus.yml` under `scrape_configs`. Example:
```yaml theme={null}
scrape_configs:
- job_name: 'node_exporter'
static_configs:
- targets: ['my-host.example.com:9100']
```
You can also view the metrics in a browser at `http://:9100/metrics` for a human-readable listing.
## Useful commands and tips
| Task | Command / Example |
| ------------------------ | ------------------------------------------------------------------------------------------------------------------------- |
| Download release | `wget https://github.com/prometheus/node_exporter/releases/download//node_exporter-.linux-amd64.tar.gz` |
| Extract archive | `tar xvf node_exporter-.linux-amd64.tar.gz` |
| Run directly | `./node_exporter` |
| Verify metrics endpoint | `curl localhost:9100/metrics` |
| Add to Prometheus | Edit `prometheus.yml` and add a `scrape_configs` entry as shown above |
| Verify Prometheus target | Visit `http://:9090/targets` |
## Running Node Exporter as a service (optional)
To run Node Exporter continuously, create a systemd unit (or equivalent init script) that starts the `node_exporter` binary at boot. Ensure the service runs with least privileges and that metrics access is restricted as needed.
## Links and references
* Prometheus Downloads: [https://prometheus.io/download/](https://prometheus.io/download/)
* Node Exporter GitHub releases: [https://github.com/prometheus/node\_exporter/releases](https://github.com/prometheus/node_exporter/releases)
* Prometheus documentation: [https://prometheus.io/docs/](https://prometheus.io/docs/)
Exposing the metrics endpoint publicly can leak system details. Restrict access with a firewall, network ACLs, or run Node Exporter behind a VPN. Consider removing or protecting sensitive metrics if necessary.
## Add Node Exporter to Prometheus scrape targets
After Node Exporter is running and reachable on port 9100, add the host as a scrape target in your `prometheus.yml` under `scrape_configs`. Example:
```yaml theme={null}
scrape_configs:
- job_name: 'node_exporter'
static_configs:
- targets: ['my-host.example.com:9100']
```
You can also view the metrics in a browser at `http://:9100/metrics` for a human-readable listing.
## Useful commands and tips
| Task | Command / Example |
| ------------------------ | ------------------------------------------------------------------------------------------------------------------------- |
| Download release | `wget https://github.com/prometheus/node_exporter/releases/download//node_exporter-.linux-amd64.tar.gz` |
| Extract archive | `tar xvf node_exporter-.linux-amd64.tar.gz` |
| Run directly | `./node_exporter` |
| Verify metrics endpoint | `curl localhost:9100/metrics` |
| Add to Prometheus | Edit `prometheus.yml` and add a `scrape_configs` entry as shown above |
| Verify Prometheus target | Visit `http://:9090/targets` |
## Running Node Exporter as a service (optional)
To run Node Exporter continuously, create a systemd unit (or equivalent init script) that starts the `node_exporter` binary at boot. Ensure the service runs with least privileges and that metrics access is restricted as needed.
## Links and references
* Prometheus Downloads: [https://prometheus.io/download/](https://prometheus.io/download/)
* Node Exporter GitHub releases: [https://github.com/prometheus/node\_exporter/releases](https://github.com/prometheus/node_exporter/releases)
* Prometheus documentation: [https://prometheus.io/docs/](https://prometheus.io/docs/)