> ## Documentation Index
> Fetch the complete documentation index at: https://notes.kodekloud.com/llms.txt
> Use this file to discover all available pages before exploring further.
# Prometheus Architecture
> Overview of Prometheus monitoring architecture and ecosystem, covering server components, exporters, client libraries, pull versus push models, service discovery, Alertmanager, Pushgateway, PromQL and Grafana.
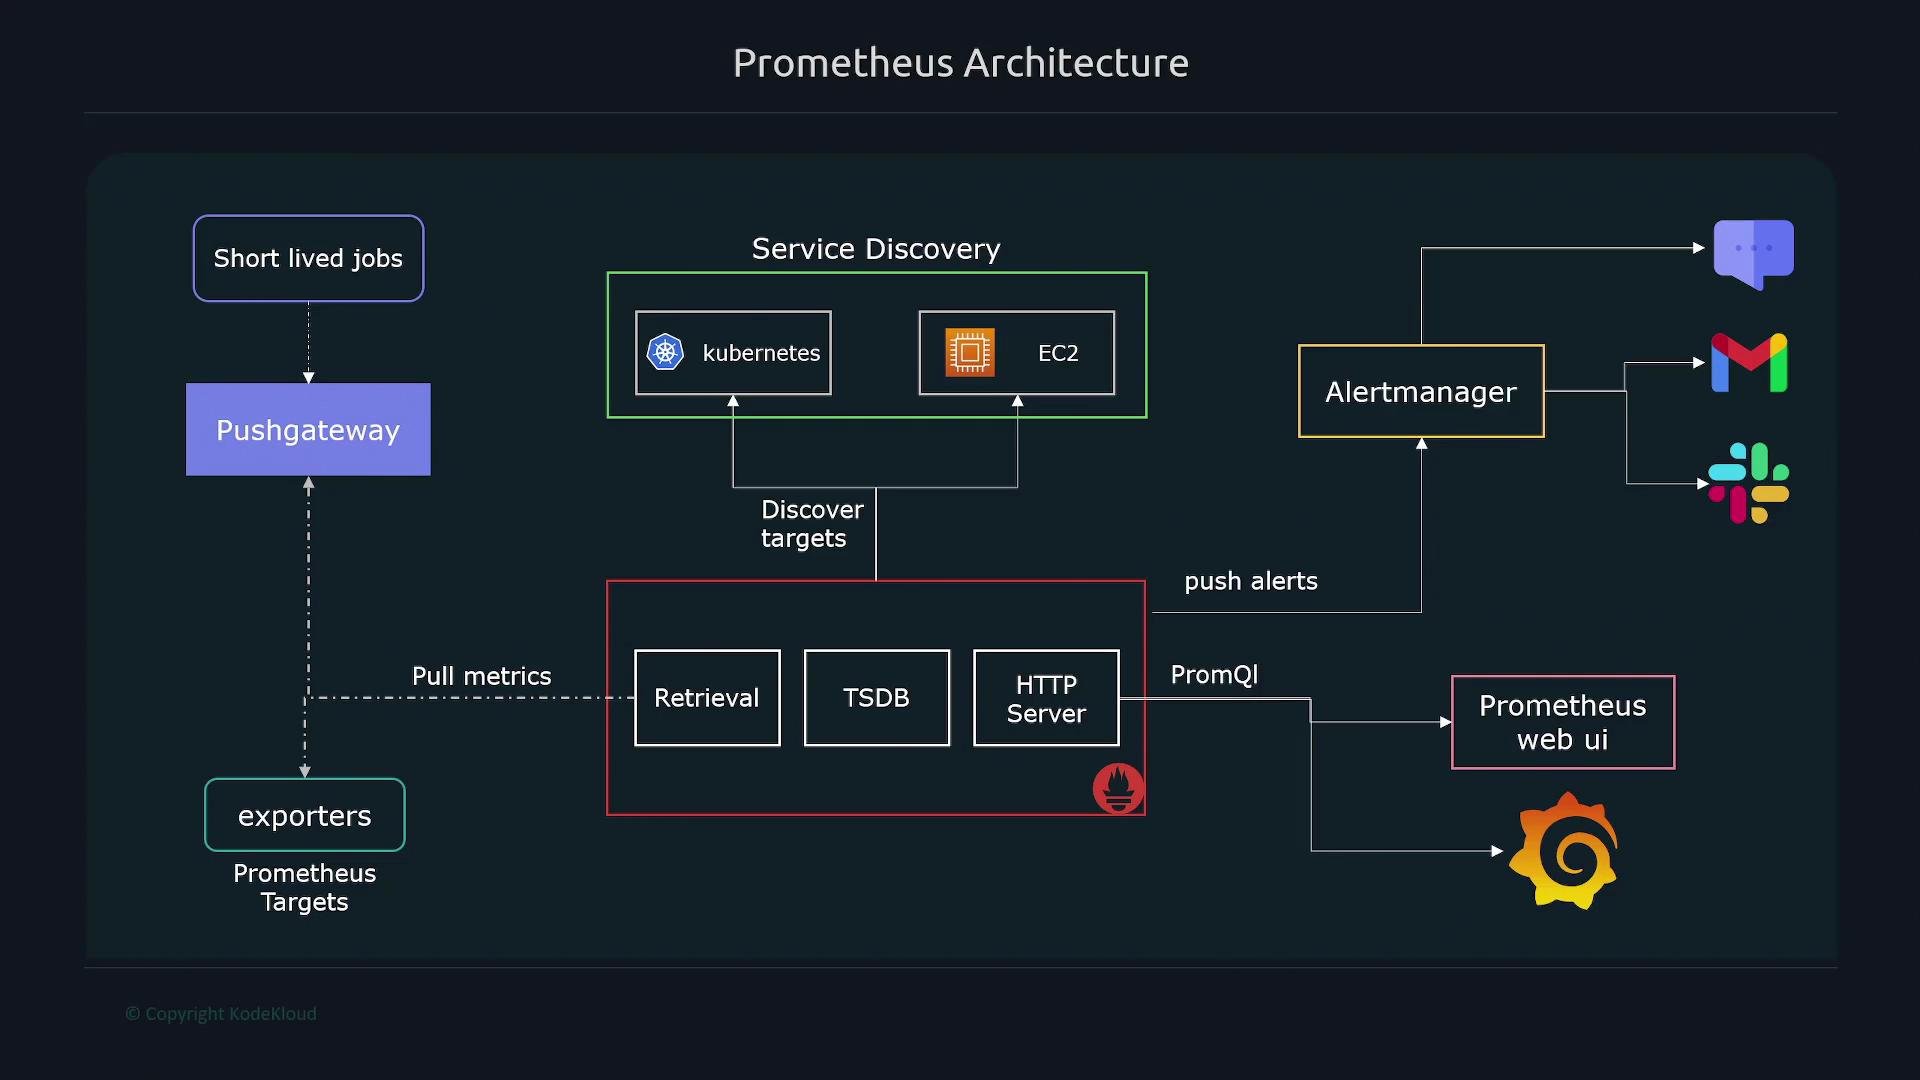
This lesson explains the Prometheus architecture, its core components, and how the wider Prometheus ecosystem fits together.
Prometheus server (the Prometheus core) is built from three primary components:
| Component | Responsibility |
| ------------------------------- | ------------------------------------------------------------------------------------------- |
| Data retrieval worker (scraper) | Periodically polls targets’ `\`/metrics\`\` endpoints and collects metrics. |
| Time series database (TSDB) | Stores scraped metrics as time-series data optimized for high write volume and compression. |
| HTTP server / query layer | Exposes the Prometheus HTTP API and UI for queries (PromQL) and visualization. |
The scraper discovers and polls targets, the TSDB persists the collected metrics, and the HTTP/query layer lets you query and visualize stored metrics using `PromQL`.
Prometheus is more than a single server — it’s an ecosystem of exporters, client libraries, discovery mechanisms, alerting integrations, and visualization tools that interact to provide full monitoring and alerting capabilities.
 Exporter processes
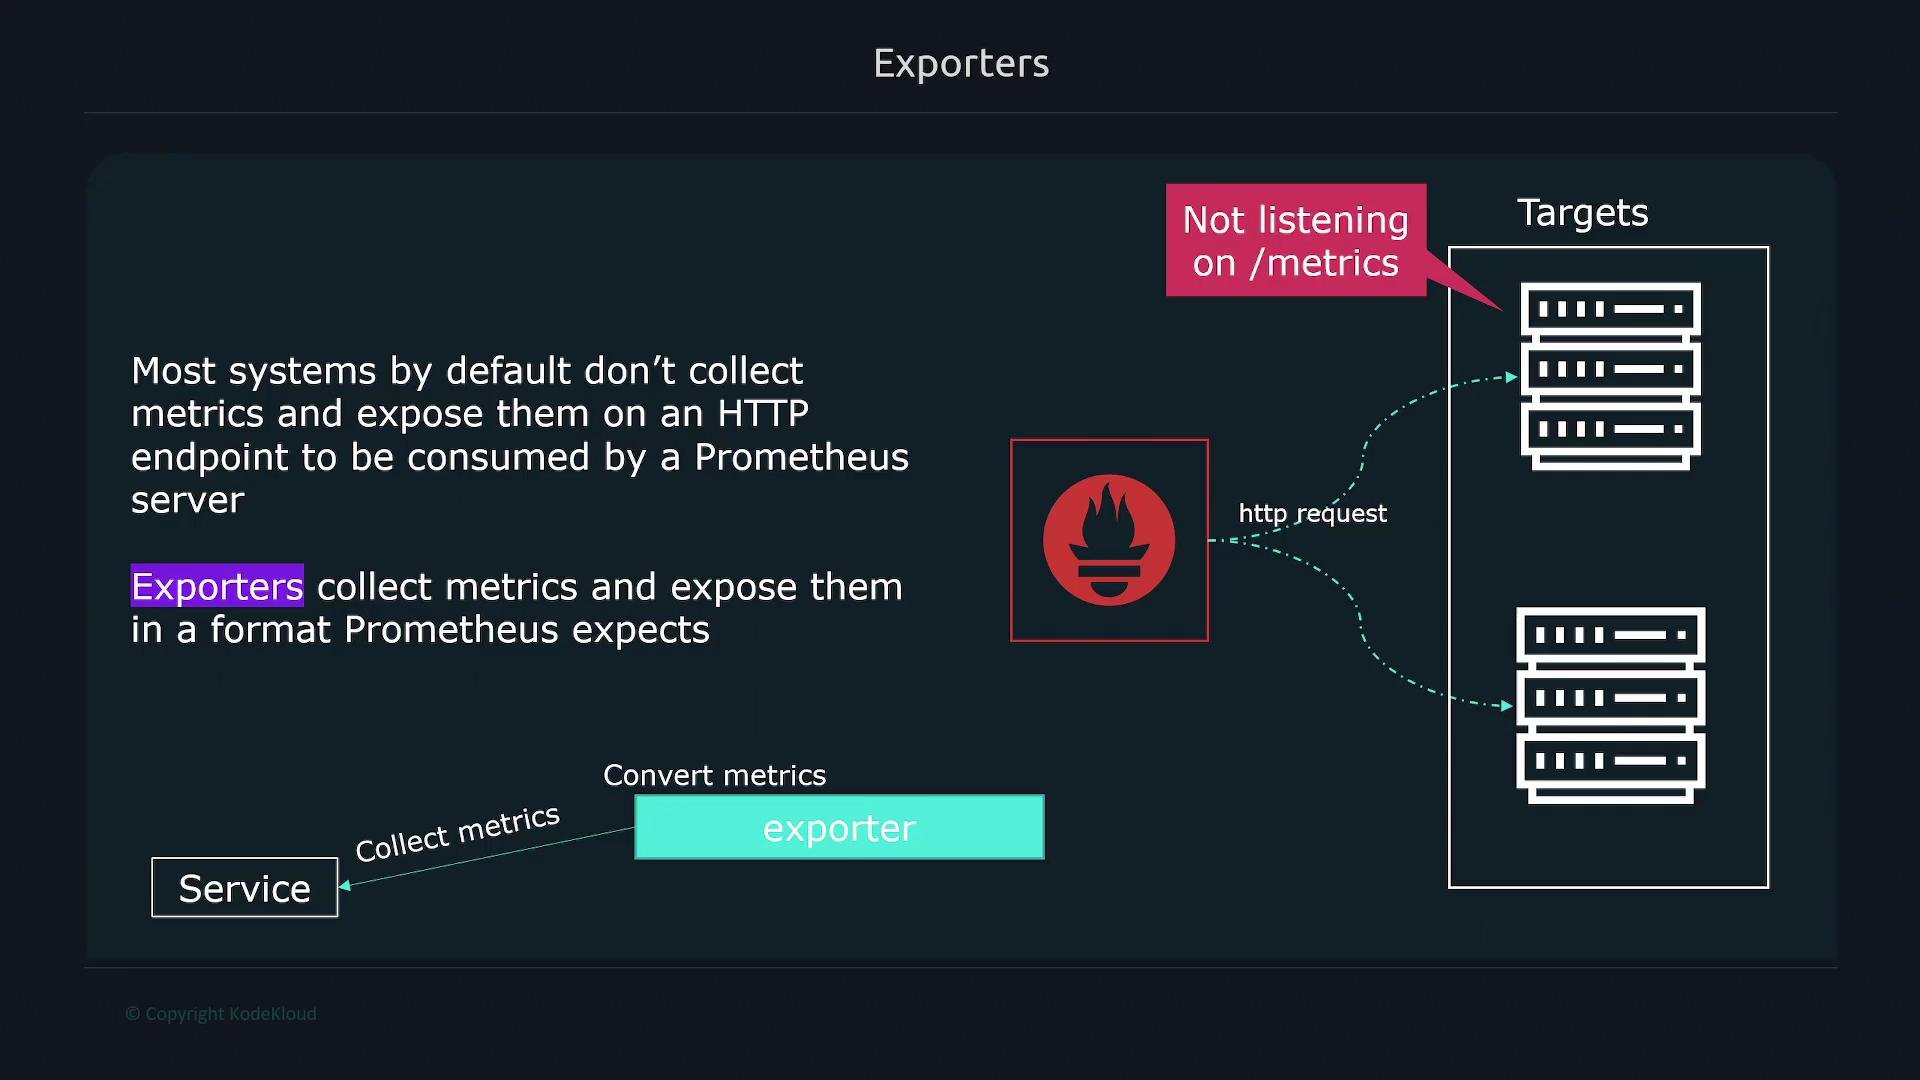
Most systems and applications do not expose Prometheus-formatted metrics by default on a `\`/metrics\`\` endpoint. Exporters are lightweight processes that:
* Collect internal metrics from an application or system.
* Convert those metrics into Prometheus’ exposition format.
* Expose the metrics on an HTTP endpoint (typically `\`/metrics\`\`) so Prometheus can scrape them.
Exporters can run alongside the instrumented application (sidecars), be deployed per host (node/host exporters), or run centrally depending on your architecture and requirements.
Exporter processes
Most systems and applications do not expose Prometheus-formatted metrics by default on a `\`/metrics\`\` endpoint. Exporters are lightweight processes that:
* Collect internal metrics from an application or system.
* Convert those metrics into Prometheus’ exposition format.
* Expose the metrics on an HTTP endpoint (typically `\`/metrics\`\`) so Prometheus can scrape them.
Exporters can run alongside the instrumented application (sidecars), be deployed per host (node/host exporters), or run centrally depending on your architecture and requirements.
 Native exporters
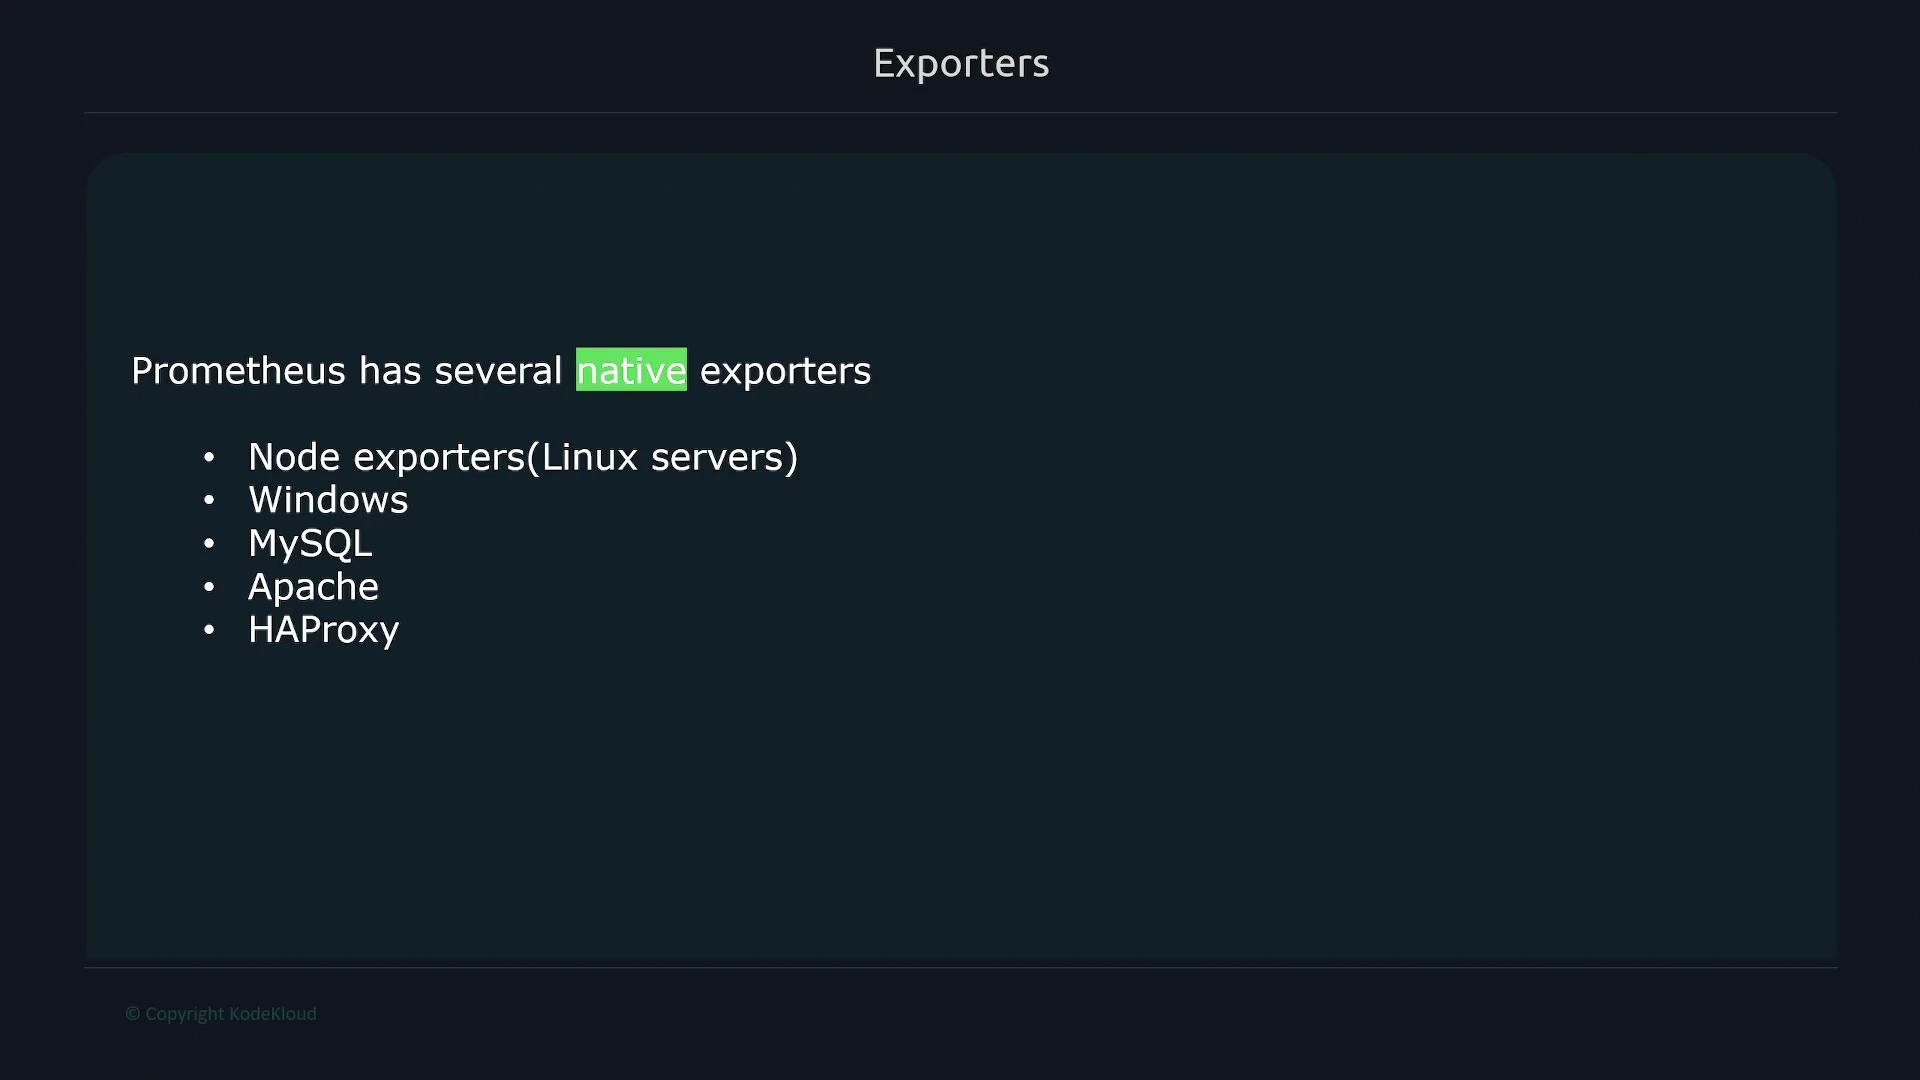
There are many official and community exporters for common software and infrastructure. These reduce the need to instrument systems yourself.
| Exporter | Typical use case |
| ------------------ | ----------------------------------------------- |
| `node_exporter` | Linux host metrics (CPU, memory, disk, network) |
| `windows_exporter` | Windows server metrics |
| `mysqld_exporter` | MySQL/MariaDB metrics |
| `apache_exporter` | Apache HTTP Server metrics |
| `haproxy_exporter` | HAProxy metrics |
These exporters let you collect OS- and application-level metrics without changing the target’s code.
Native exporters
There are many official and community exporters for common software and infrastructure. These reduce the need to instrument systems yourself.
| Exporter | Typical use case |
| ------------------ | ----------------------------------------------- |
| `node_exporter` | Linux host metrics (CPU, memory, disk, network) |
| `windows_exporter` | Windows server metrics |
| `mysqld_exporter` | MySQL/MariaDB metrics |
| `apache_exporter` | Apache HTTP Server metrics |
| `haproxy_exporter` | HAProxy metrics |
These exporters let you collect OS- and application-level metrics without changing the target’s code.
 Client libraries
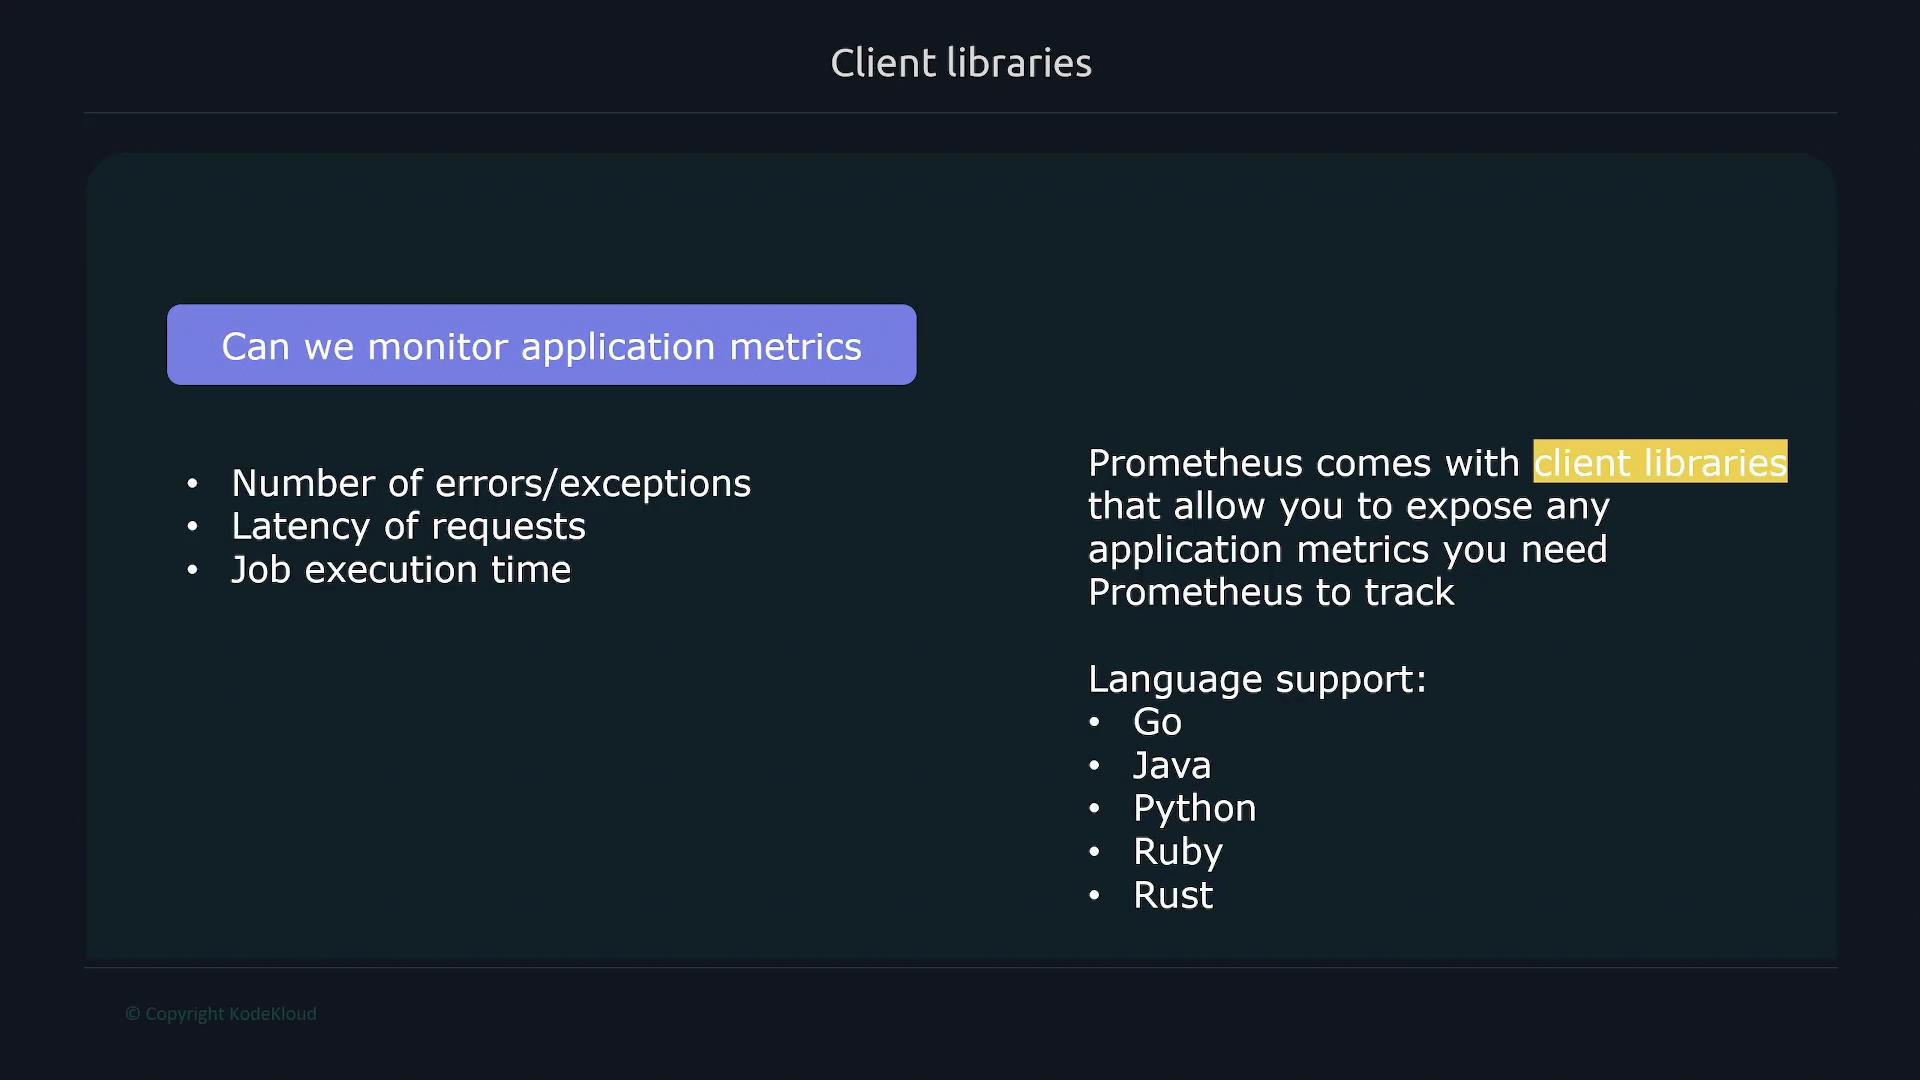
For domain-specific metrics (error counts, request latencies, job durations, custom counters/gauges/histograms), embed a Prometheus client library in your application. Official and community libraries are available for many languages:
* Go, Java, Python, Ruby, Rust (official or widely used libraries).
* Third-party libraries for additional languages and frameworks.
Instrumenting your application lets it expose business or application-level metrics directly on `\`/metrics\`\` to be scraped by Prometheus.
Client libraries
For domain-specific metrics (error counts, request latencies, job durations, custom counters/gauges/histograms), embed a Prometheus client library in your application. Official and community libraries are available for many languages:
* Go, Java, Python, Ruby, Rust (official or widely used libraries).
* Third-party libraries for additional languages and frameworks.
Instrumenting your application lets it expose business or application-level metrics directly on `\`/metrics\`\` to be scraped by Prometheus.
 Pull vs push model
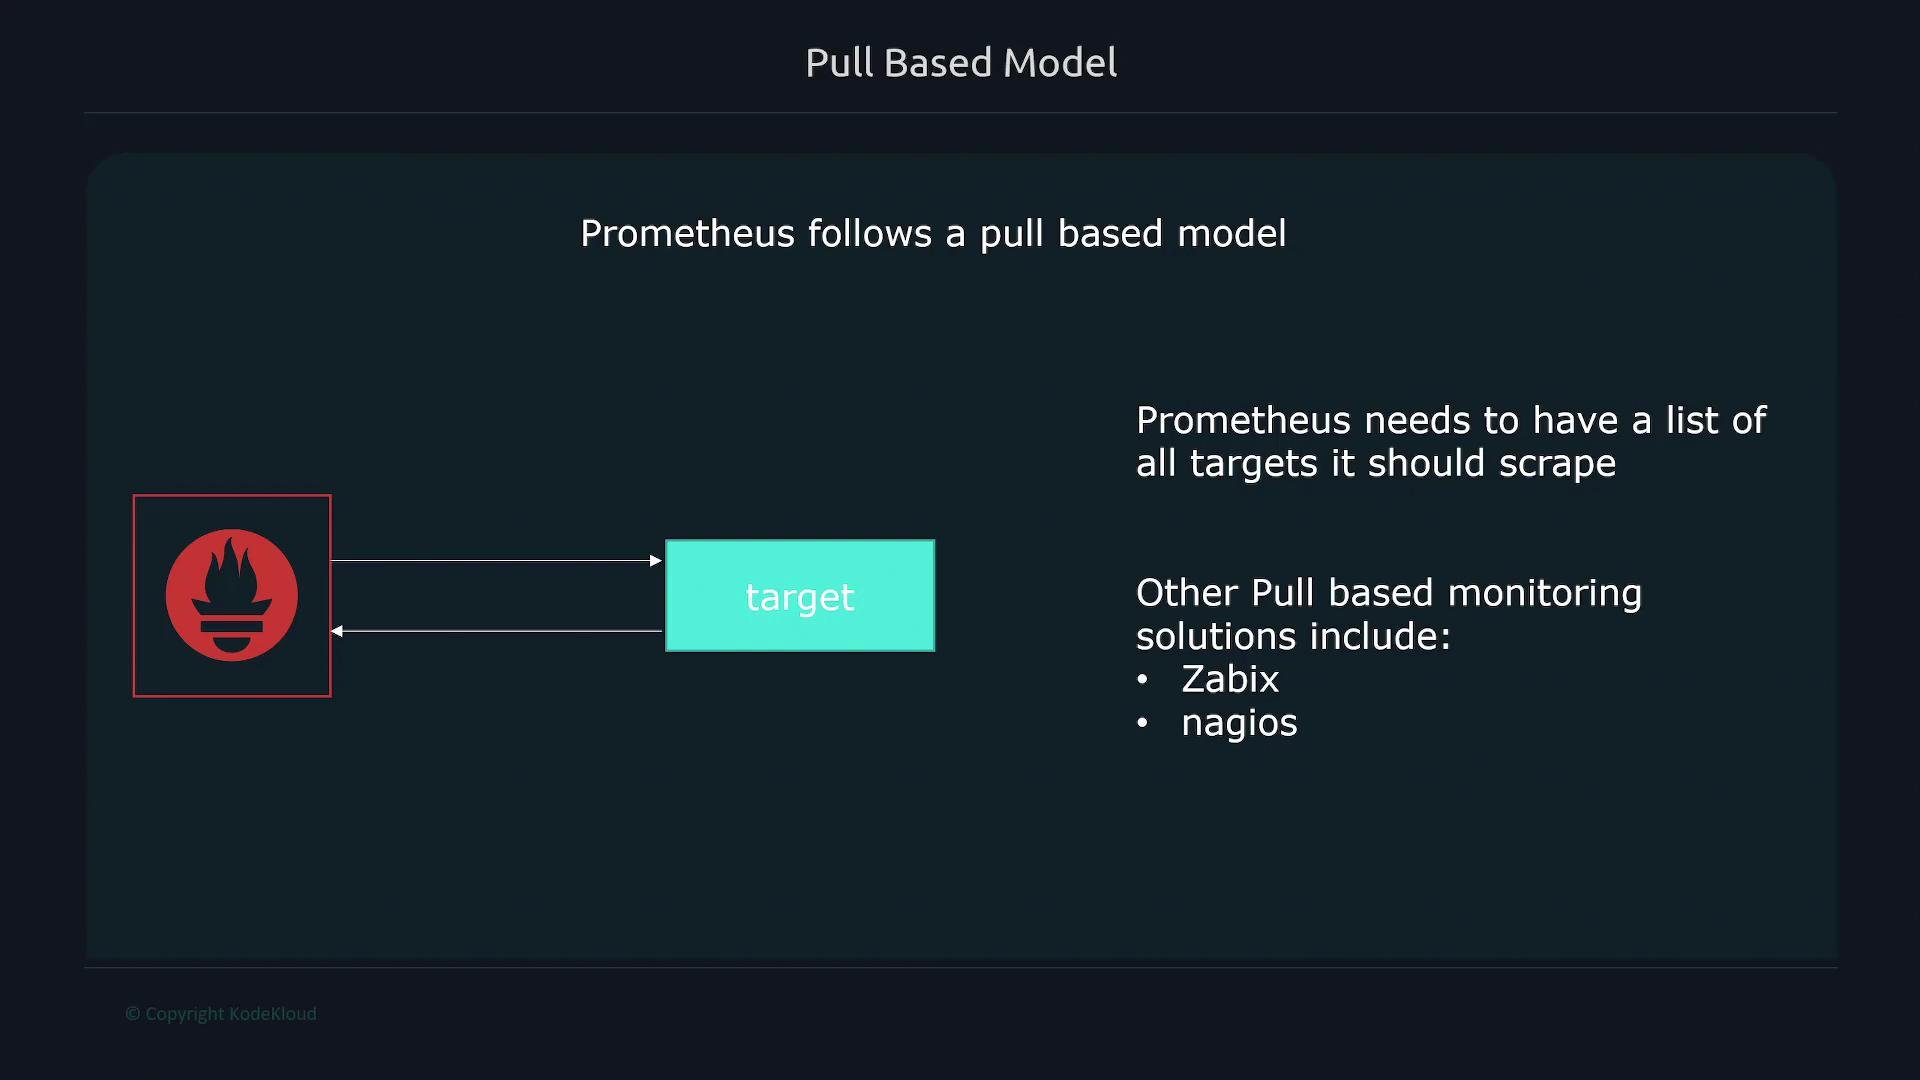
Prometheus primarily uses a pull-based model:
* The Prometheus server initiates HTTP requests to targets’ `\`/metrics\`\` endpoints on a schedule.
* Prometheus must therefore know which targets to monitor (via static config or service discovery).
* Pull models make it straightforward to detect failed scrapes (i.e., target is down) and to maintain a canonical list of targets.
Other monitoring systems also use pull-based approaches (for example, Zabbix, Nagios).
Pull vs push model
Prometheus primarily uses a pull-based model:
* The Prometheus server initiates HTTP requests to targets’ `\`/metrics\`\` endpoints on a schedule.
* Prometheus must therefore know which targets to monitor (via static config or service discovery).
* Pull models make it straightforward to detect failed scrapes (i.e., target is down) and to maintain a canonical list of targets.
Other monitoring systems also use pull-based approaches (for example, Zabbix, Nagios).
 Push-based systems
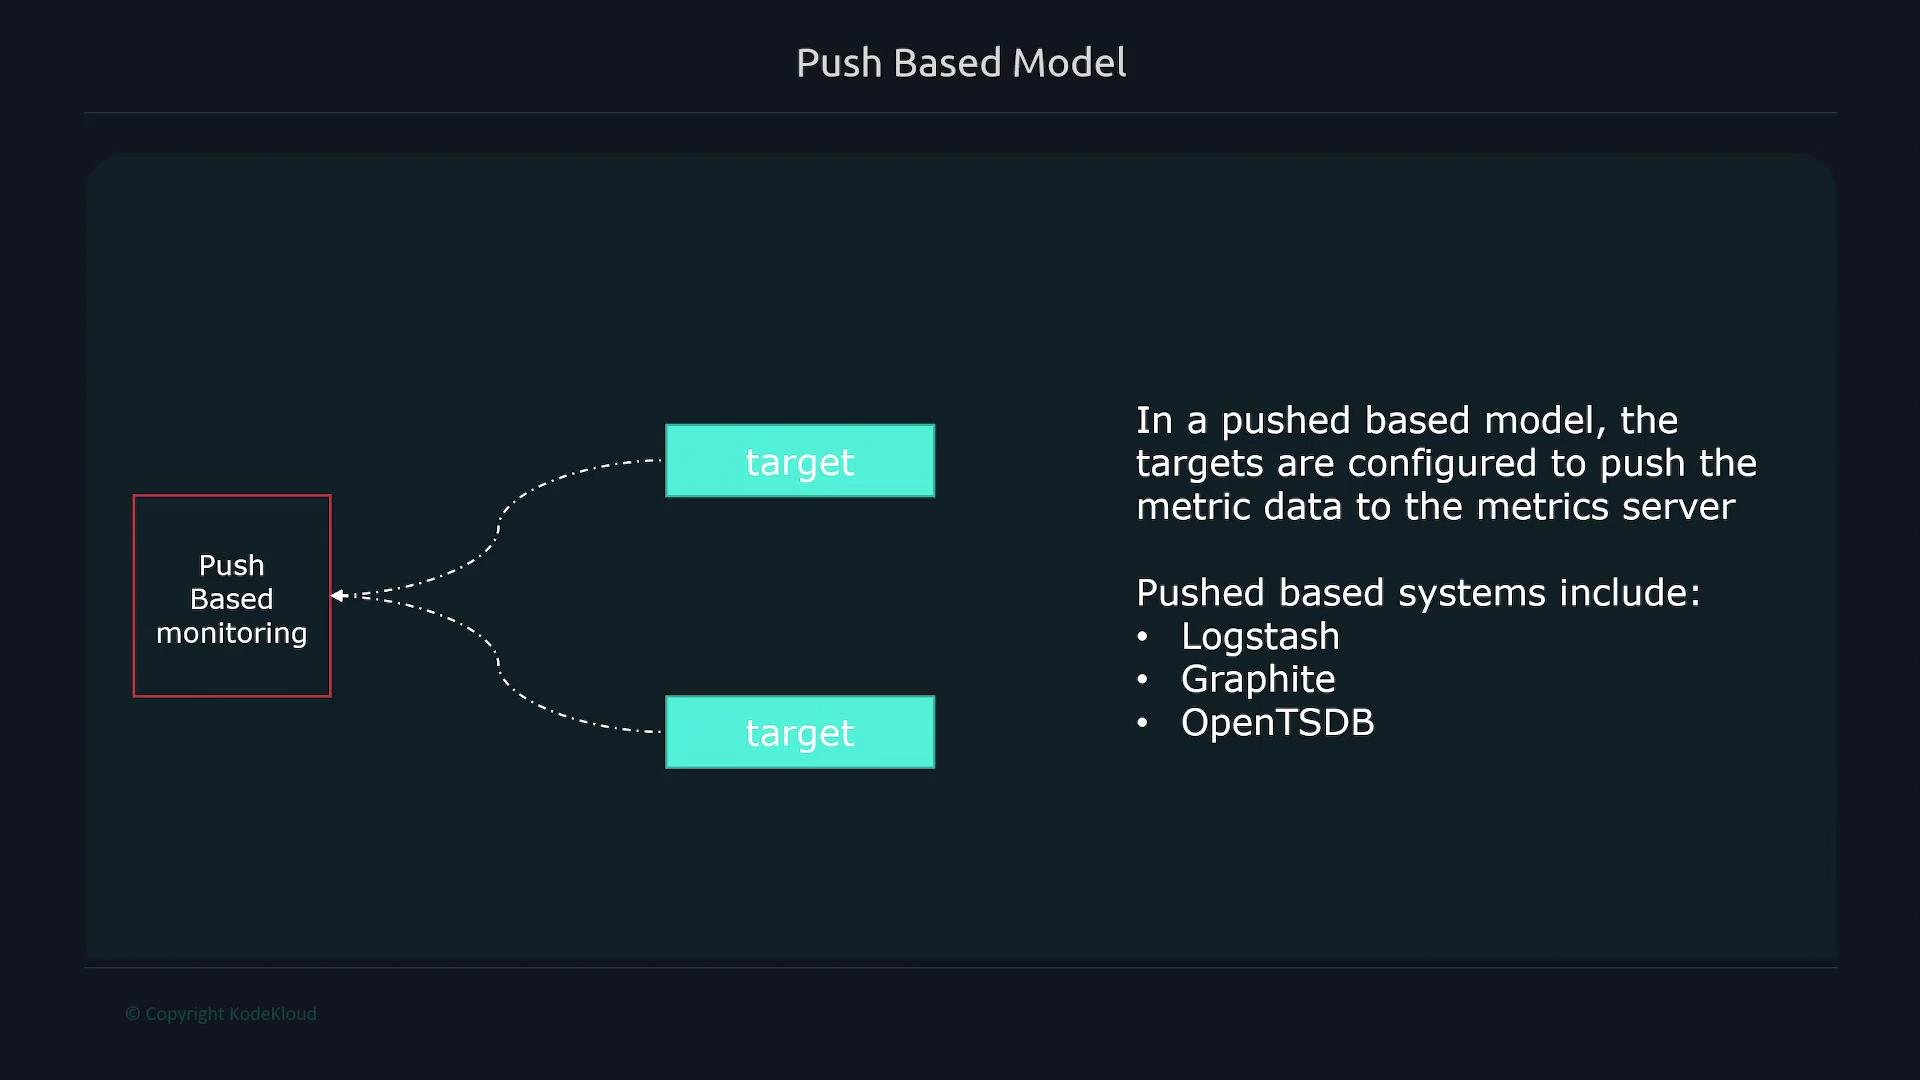
Push-based monitoring has targets send metrics directly to a central collector. Examples and use cases include:
* Graphite, OpenTSDB (typical push-capable setups).
* Logstash or custom metric collectors that accept pushed metrics/events.
Use push when the target cannot be reliably scraped (e.g., firewalled, behind NAT, or extremely short-lived jobs).
Push-based systems
Push-based monitoring has targets send metrics directly to a central collector. Examples and use cases include:
* Graphite, OpenTSDB (typical push-capable setups).
* Logstash or custom metric collectors that accept pushed metrics/events.
Use push when the target cannot be reliably scraped (e.g., firewalled, behind NAT, or extremely short-lived jobs).
 Benefits of pull-based monitoring
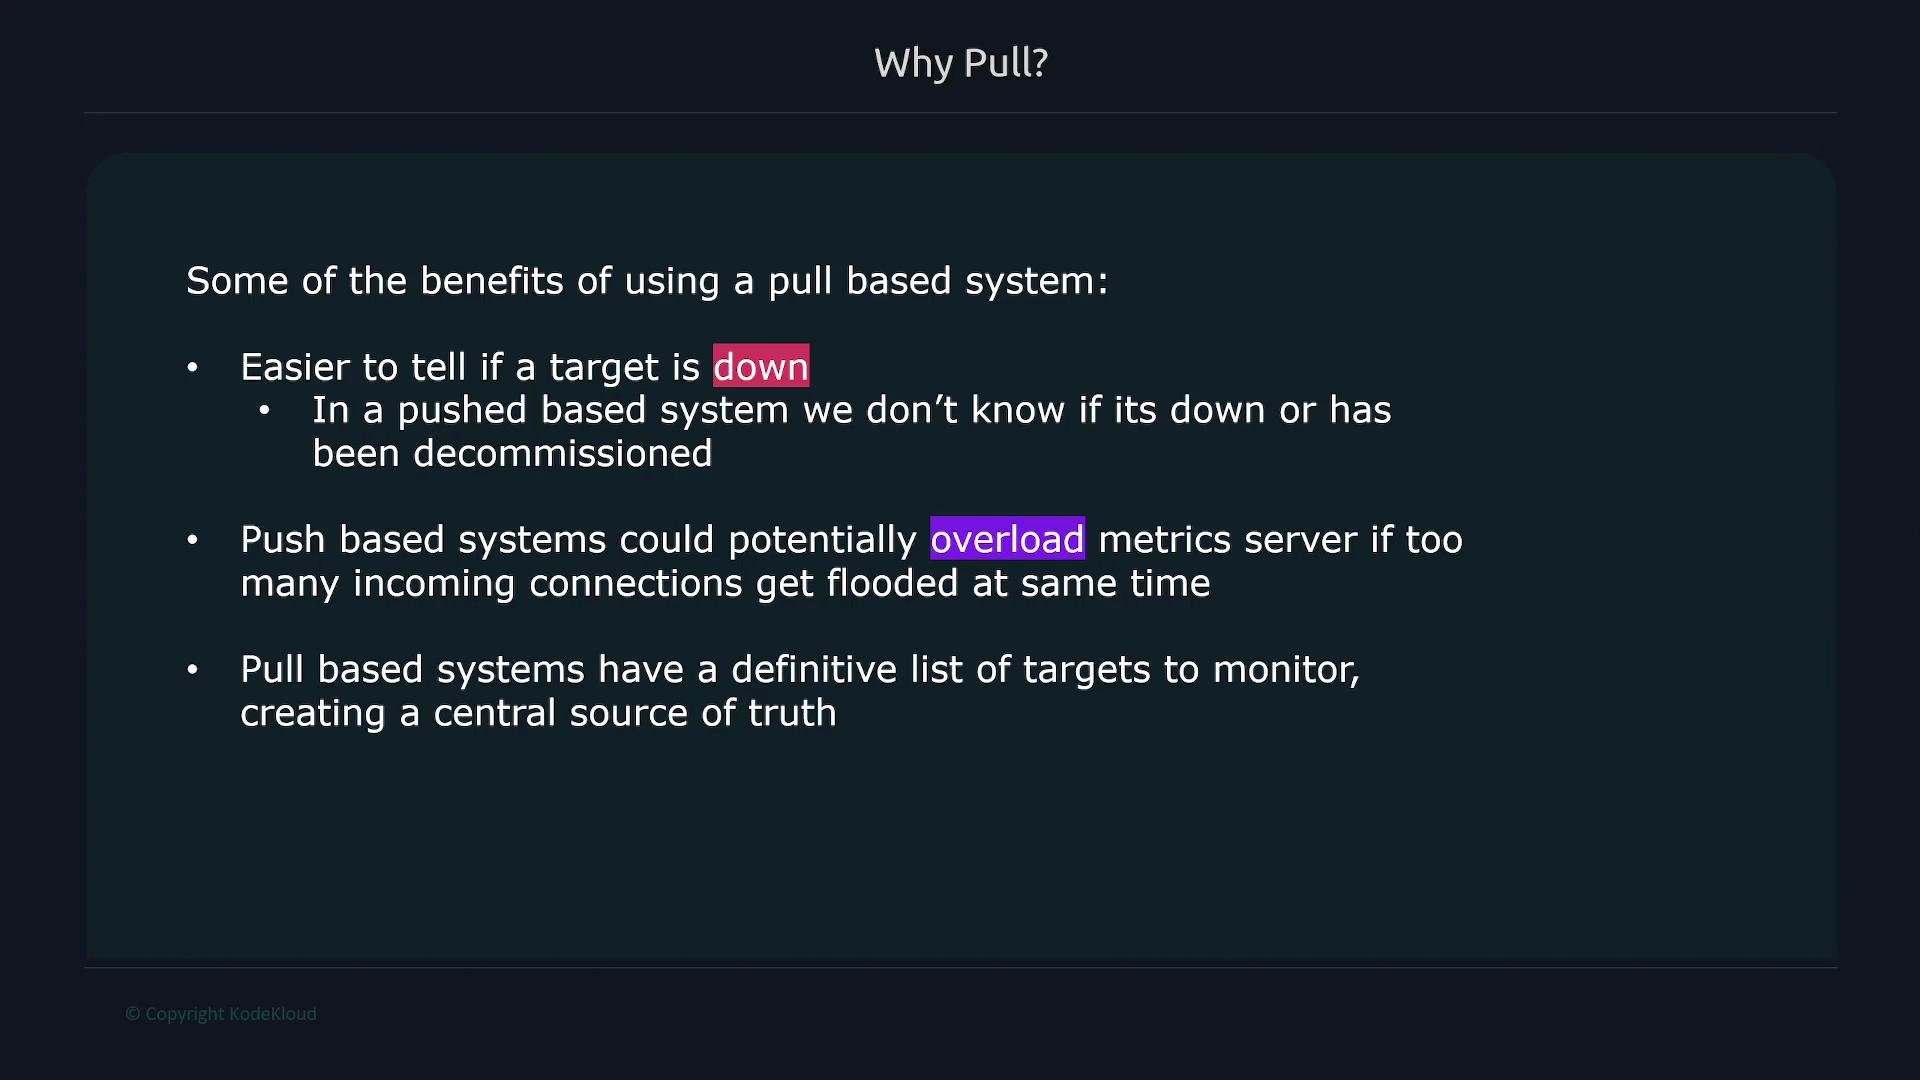
* Clear detection of target availability: failed scrape vs intentionally removed target.
* Prevents uncontrolled inbound connections from newly online devices that could overwhelm a central server.
* Maintains a centralized source of truth for monitored targets (static config + service discovery).
Benefits of pull-based monitoring
* Clear detection of target availability: failed scrape vs intentionally removed target.
* Prevents uncontrolled inbound connections from newly online devices that could overwhelm a central server.
* Maintains a centralized source of truth for monitored targets (static config + service discovery).
 When to use push
* Push is appropriate for short-lived, ephemeral jobs (batch jobs, short-lived containers) that terminate before a scrape can occur.
* Prometheus itself is designed for numeric metrics; it’s not an event or log ingestion system.
For ephemeral jobs, Prometheus provides the Pushgateway: a buffer that accepts pushed metrics from short-lived jobs and exposes those metrics so Prometheus can scrape them later.
Use the Pushgateway only when a job cannot be scraped directly (for example, very short-lived batch jobs). Prefer direct instrumentation or exporters for long-lived services.
The Pushgateway is intended for ephemeral or batch jobs only. It is not a general-purpose replacement for exporters or for instrumenting long-lived services.
Service discovery
Static target lists work for small environments, but dynamic infrastructures (Kubernetes, cloud auto-scaling, Consul, etc.) require automatic discovery. Prometheus supports many service discovery mechanisms to keep its target list current:
* Kubernetes service discovery
* AWS/EC2 discovery
* Consul, Docker, Azure, GCE, and more
These integrations let Prometheus automatically update targets as services and instances are created or destroyed.
Service discovery references:
* [Kubernetes Basics](https://kubernetes.io/docs/concepts/overview/what-is-kubernetes/)
* [Amazon EC2](https://aws.amazon.com/ec2/)
* [HashiCorp Consul](https://www.consul.io/)
Alerting and notifications
* Prometheus can evaluate alerting rules and generate alerts based on `PromQL` expressions.
* However, Prometheus does not handle notification delivery (email, Slack, PagerDuty, etc.) itself.
Alertmanager is the component that receives alerts from Prometheus and manages:
* Deduplication and grouping of similar alerts.
* Routing alerts to appropriate receivers.
* Notification delivery via email, Slack, PagerDuty, webhooks, and other integrations.
Visualization and querying
* Query Prometheus directly using `PromQL` via the HTTP API or the built-in Prometheus UI.
* For richer dashboards, use Grafana to visualize Prometheus metrics. (Grafana is commonly paired with Prometheus; Loki is used for log aggregation and can complement Prometheus-based monitoring.)
Common resources:
* Prometheus HTTP API / PromQL docs
* Grafana for dashboards and visualizations
Summary: core components and where they fit
| Component | Purpose |
| ----------------- | ----------------------------------------------------------------------------- |
| Prometheus server | Scrapes metrics, stores them in TSDB, exposes API/UI for queries |
| Exporters | Translate non-Prometheus metrics into the exposition format (`\`/metrics\`\`) |
| Client libraries | Instrument applications to expose custom, domain-specific metrics |
| Pushgateway | Temporary buffer for short-lived job metrics (ephemeral use only) |
| Service discovery | Keeps the scrape target list up-to-date in dynamic environments |
| Alertmanager | Handles alert routing, grouping, and notification delivery |
| Visualization | Grafana (dashboards) + Prometheus (PromQL) for queries and exploration |
Links and references
* [Prometheus documentation](https://prometheus.io/docs/)
* [PromQL basics](https://prometheus.io/docs/prometheus/latest/querying/basics/)
* [Grafana – official site](https://grafana.com/)
* Courses referenced (examples):
* [Kubernetes for the Absolute Beginners - Hands-on Tutorial](https://learn.kodekloud.com/user/courses/kubernetes-for-the-absolute-beginners-hands-on-tutorial)
* [Amazon Elastic Compute Cloud (EC2)](https://learn.kodekloud.com/user/courses/amazon-elastic-compute-cloud-ec2)
* [HashiCorp Certified: Consul Associate Certification](https://learn.kodekloud.com/user/courses/hashicorp-certified-consul-associate-certification)
When to use push
* Push is appropriate for short-lived, ephemeral jobs (batch jobs, short-lived containers) that terminate before a scrape can occur.
* Prometheus itself is designed for numeric metrics; it’s not an event or log ingestion system.
For ephemeral jobs, Prometheus provides the Pushgateway: a buffer that accepts pushed metrics from short-lived jobs and exposes those metrics so Prometheus can scrape them later.
Use the Pushgateway only when a job cannot be scraped directly (for example, very short-lived batch jobs). Prefer direct instrumentation or exporters for long-lived services.
The Pushgateway is intended for ephemeral or batch jobs only. It is not a general-purpose replacement for exporters or for instrumenting long-lived services.
Service discovery
Static target lists work for small environments, but dynamic infrastructures (Kubernetes, cloud auto-scaling, Consul, etc.) require automatic discovery. Prometheus supports many service discovery mechanisms to keep its target list current:
* Kubernetes service discovery
* AWS/EC2 discovery
* Consul, Docker, Azure, GCE, and more
These integrations let Prometheus automatically update targets as services and instances are created or destroyed.
Service discovery references:
* [Kubernetes Basics](https://kubernetes.io/docs/concepts/overview/what-is-kubernetes/)
* [Amazon EC2](https://aws.amazon.com/ec2/)
* [HashiCorp Consul](https://www.consul.io/)
Alerting and notifications
* Prometheus can evaluate alerting rules and generate alerts based on `PromQL` expressions.
* However, Prometheus does not handle notification delivery (email, Slack, PagerDuty, etc.) itself.
Alertmanager is the component that receives alerts from Prometheus and manages:
* Deduplication and grouping of similar alerts.
* Routing alerts to appropriate receivers.
* Notification delivery via email, Slack, PagerDuty, webhooks, and other integrations.
Visualization and querying
* Query Prometheus directly using `PromQL` via the HTTP API or the built-in Prometheus UI.
* For richer dashboards, use Grafana to visualize Prometheus metrics. (Grafana is commonly paired with Prometheus; Loki is used for log aggregation and can complement Prometheus-based monitoring.)
Common resources:
* Prometheus HTTP API / PromQL docs
* Grafana for dashboards and visualizations
Summary: core components and where they fit
| Component | Purpose |
| ----------------- | ----------------------------------------------------------------------------- |
| Prometheus server | Scrapes metrics, stores them in TSDB, exposes API/UI for queries |
| Exporters | Translate non-Prometheus metrics into the exposition format (`\`/metrics\`\`) |
| Client libraries | Instrument applications to expose custom, domain-specific metrics |
| Pushgateway | Temporary buffer for short-lived job metrics (ephemeral use only) |
| Service discovery | Keeps the scrape target list up-to-date in dynamic environments |
| Alertmanager | Handles alert routing, grouping, and notification delivery |
| Visualization | Grafana (dashboards) + Prometheus (PromQL) for queries and exploration |
Links and references
* [Prometheus documentation](https://prometheus.io/docs/)
* [PromQL basics](https://prometheus.io/docs/prometheus/latest/querying/basics/)
* [Grafana – official site](https://grafana.com/)
* Courses referenced (examples):
* [Kubernetes for the Absolute Beginners - Hands-on Tutorial](https://learn.kodekloud.com/user/courses/kubernetes-for-the-absolute-beginners-hands-on-tutorial)
* [Amazon Elastic Compute Cloud (EC2)](https://learn.kodekloud.com/user/courses/amazon-elastic-compute-cloud-ec2)
* [HashiCorp Certified: Consul Associate Certification](https://learn.kodekloud.com/user/courses/hashicorp-certified-consul-associate-certification)