> ## Documentation Index
> Fetch the complete documentation index at: https://notes.kodekloud.com/llms.txt
> Use this file to discover all available pages before exploring further.
# Prometheus Basics
> Overview of Prometheus fundamentals including metric collection, TSDB storage, PromQL queries, exporters, and Alertmanager alerting
In this guide you'll learn the fundamentals of Prometheus: what it is, how it collects metrics, where it fits in an observability stack, and a few concrete configuration and exposition examples to get started.
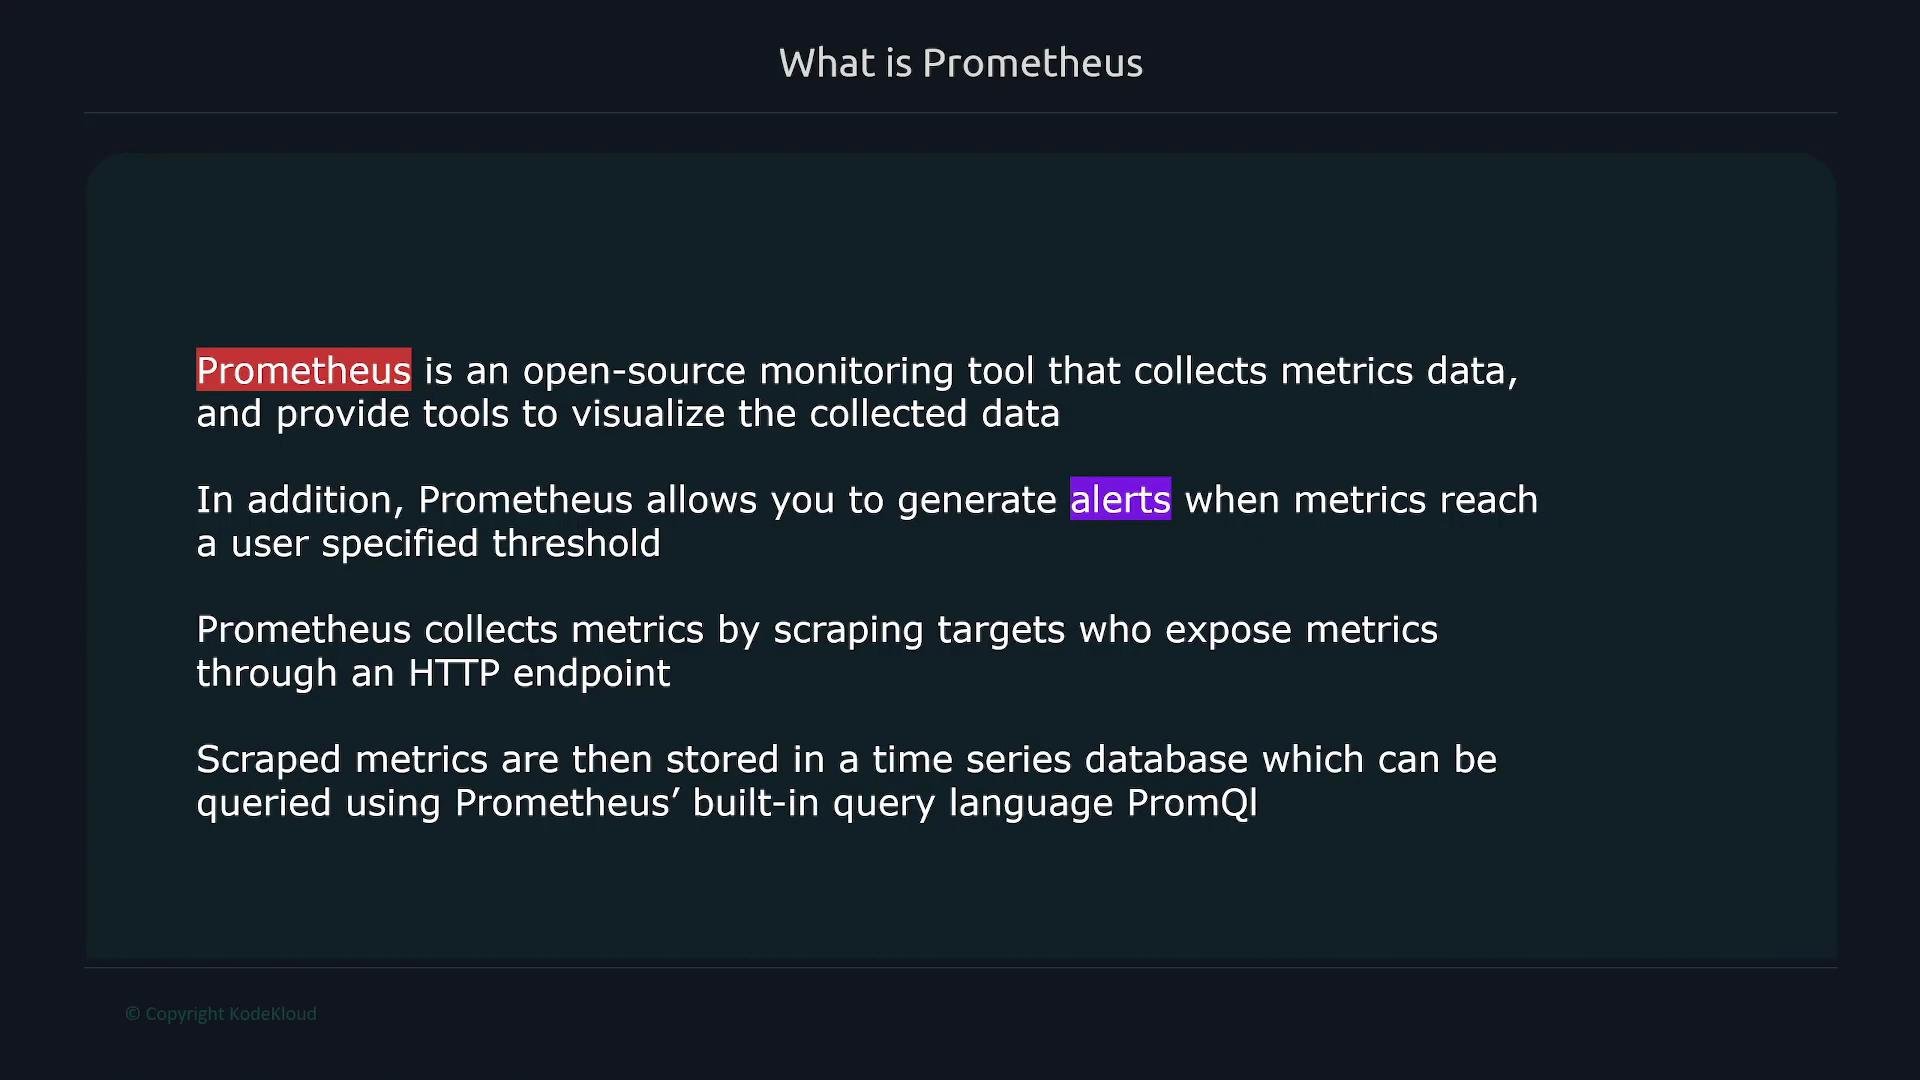
Prometheus is an open-source monitoring and alerting toolkit that:
* Collects numeric time-series metrics from configured targets.
* Stores metrics in a local time-series database (TSDB) optimized for high-write, high-query workloads.
* Provides a powerful query language, PromQL, for aggregating and analyzing time-series data.
* Integrates with an alerting pipeline (Alertmanager) to route notifications when metrics cross thresholds.
Prometheus uses a pull-based scrape model: it periodically sends HTTP GET requests to configured targets that expose metrics (commonly at the `/metrics` HTTP path). Scraped samples are persisted in the local TSDB and can be queried with PromQL or visualized in tools like Grafana.
 What you can query with PromQL
Prometheus focuses on numeric time-series data. Common queries include rates, aggregates, and quantiles over sliding time windows. Use PromQL to compute things like request rates, error ratios, or p95 latency across services.
What kinds of metrics can Prometheus monitor?
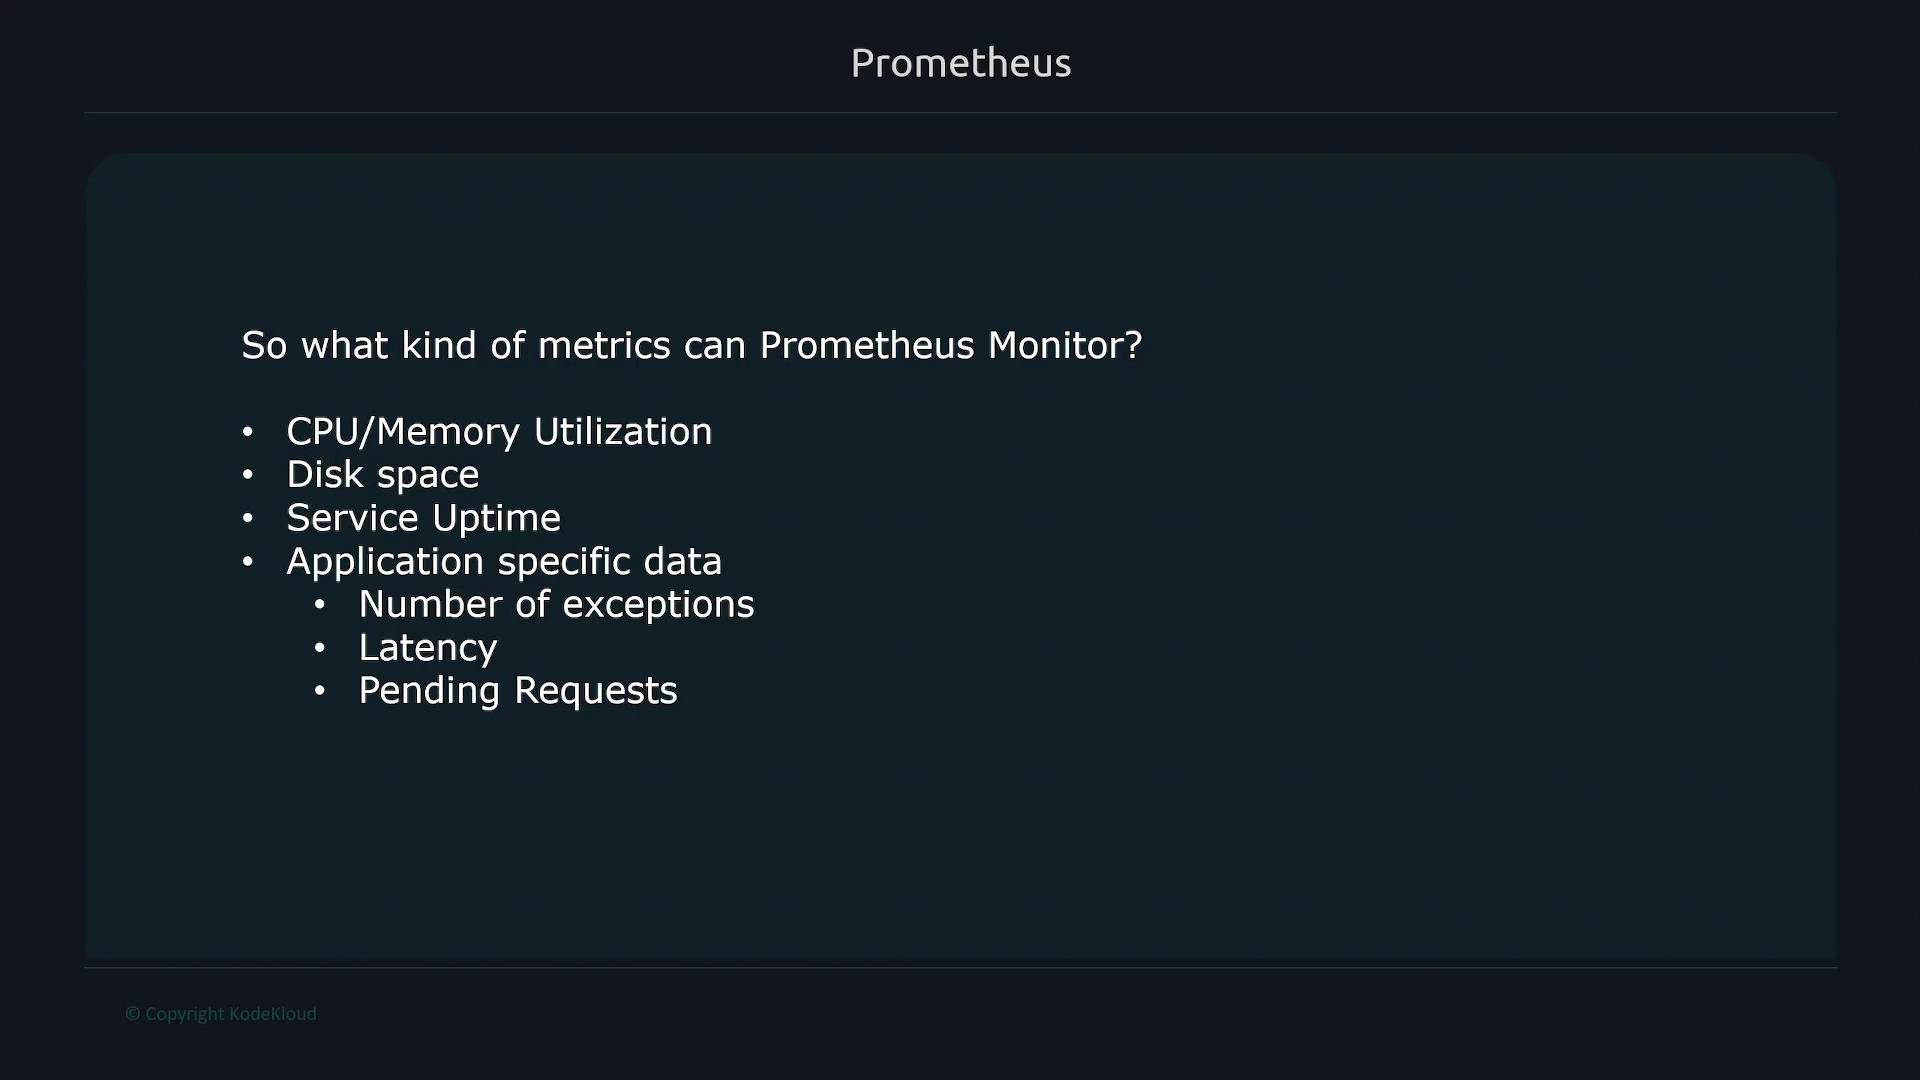
Prometheus is flexible and commonly collects:
* Host and OS metrics: CPU, memory, disk, and network statistics.
* Service metrics: uptime, request/sec, error rates, and latency percentiles (p50/p95/p99).
* Application/business metrics: exceptions, queue depth, job counts, revenue metrics.
Because Prometheus stores numeric time series, you can compute derivative metrics (e.g., per-second rates), windowed aggregates, and quantiles using PromQL.
What you can query with PromQL
Prometheus focuses on numeric time-series data. Common queries include rates, aggregates, and quantiles over sliding time windows. Use PromQL to compute things like request rates, error ratios, or p95 latency across services.
What kinds of metrics can Prometheus monitor?
Prometheus is flexible and commonly collects:
* Host and OS metrics: CPU, memory, disk, and network statistics.
* Service metrics: uptime, request/sec, error rates, and latency percentiles (p50/p95/p99).
* Application/business metrics: exceptions, queue depth, job counts, revenue metrics.
Because Prometheus stores numeric time series, you can compute derivative metrics (e.g., per-second rates), windowed aggregates, and quantiles using PromQL.
 Common metric ingestion patterns
* Instrument code directly using a Prometheus client library (Go, Java, Python, Ruby, etc.).
* Use exporters for systems that cannot be instrumented natively (for example, `node_exporter` for host metrics, `blackbox_exporter` for probing endpoints, or database exporters).
* Use Pushgateway for short-lived batch jobs that cannot be scraped periodically.
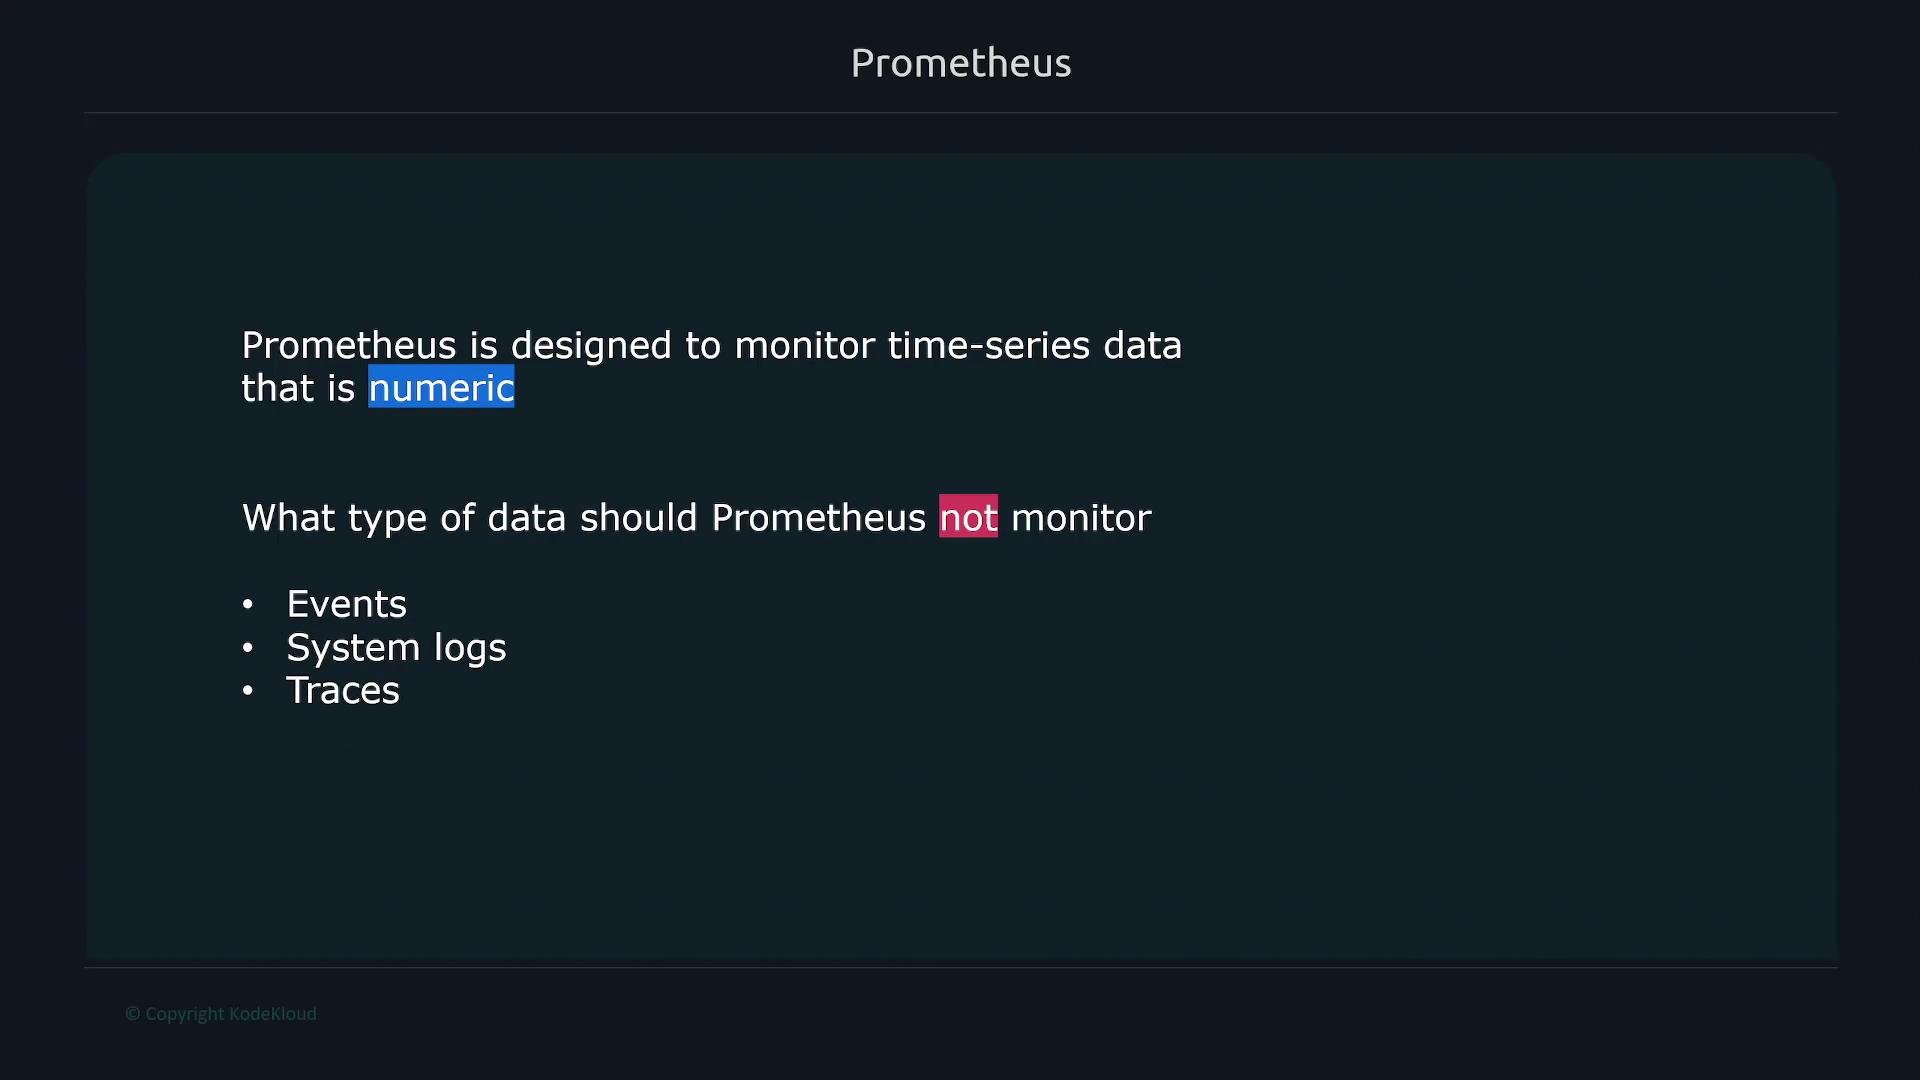
Prometheus is purpose-built for numeric time-series monitoring. It is not a replacement for log management or distributed tracing—use specialized tools for logs/traces and integrate them into your observability pipeline.
Common metric ingestion patterns
* Instrument code directly using a Prometheus client library (Go, Java, Python, Ruby, etc.).
* Use exporters for systems that cannot be instrumented natively (for example, `node_exporter` for host metrics, `blackbox_exporter` for probing endpoints, or database exporters).
* Use Pushgateway for short-lived batch jobs that cannot be scraped periodically.
Prometheus is purpose-built for numeric time-series monitoring. It is not a replacement for log management or distributed tracing—use specialized tools for logs/traces and integrate them into your observability pipeline.
 Prometheus includes an [Alertmanager](https://prometheus.io/docs/alerting/latest/alertmanager/) component for routing notifications (email, PagerDuty, Slack, etc.). For long-term metric retention beyond Prometheus' local TSDB retention window, integrate remote storage solutions using Prometheus' `remote_write`/`remote_read` APIs.
Quick example: Prometheus scrape configuration
```yaml theme={null}
global:
scrape_interval: 15s
scrape_configs:
- job_name: 'node'
static_configs:
- targets: ['localhost:9100']
- job_name: 'my-app'
static_configs:
- targets: ['my-app:8080']
```
Example: Prometheus text exposition format
```text theme={null}
# HELP http_requests_total Total number of HTTP requests
# TYPE http_requests_total counter
http_requests_total{method="GET",handler="/api"} 1027
# HELP cpu_seconds_total Total user and system CPU time spent in seconds
# TYPE cpu_seconds_total counter
cpu_seconds_total{cpu="0"} 12345.67
```
Metric types and when to use them
| Metric type | Purpose | Typical use cases |
| ----------- | ---------------------------------------------------------- | -------------------------------------------- |
| Counter | Monotonically increasing value; only increases (or resets) | Total requests served: `http_requests_total` |
| Gauge | Value that can go up or down | Current memory usage or temperature |
| Histogram | Buckets observations and counts/sums for quantiles | Request latency distributions |
| Summary | Client-side quantiles and counts over sliding time windows | Percentile latency at the client side |
Prometheus components at a glance
| Component | Role | Notes / Links |
| ----------------- | -------------------------------------------------------- | --------------------------------------------------------------------------------- |
| Prometheus server | Scrapes targets and stores metrics in the TSDB | Query with PromQL |
| Alertmanager | Receives alerts from Prometheus and routes notifications | See [Alertmanager docs](https://prometheus.io/docs/alerting/latest/alertmanager/) |
| Exporters | Translate non-Prometheus data into metrics | Examples: `node_exporter`, `blackbox_exporter` |
| Pushgateway | Accepts push metrics for short-lived jobs | Not intended for service metrics |
A few additional technical notes
* Service discovery: Prometheus supports multiple discovery mechanisms (Kubernetes, Consul, EC2, DNS) so targets can be discovered dynamically.
* Alerting rules: Define rules in Prometheus to evaluate conditions and send alerts to Alertmanager for notification and silencing.
* Retention and remote storage: Prometheus' local TSDB is optimized for recent data. For long-term retention, use compatible remote storage backends via `remote_write`/`remote_read`.
* Choosing metric types: Use counters for totals, gauges for instantaneous values, histograms/summaries for latency distributions.
Background and further reading
Prometheus originated at SoundCloud and joined the Cloud Native Computing Foundation (CNCF) in 2016. It is implemented primarily in Go. For full documentation, client libraries, and exporter examples, see the official Prometheus docs: `https://prometheus.io/docs/`.
Links and references
* [Prometheus querying basics (PromQL)](https://prometheus.io/docs/prometheus/latest/querying/basics/)
* [Grafana](https://grafana.com/)
* [node\_exporter](https://github.com/prometheus/node_exporter)
* [blackbox\_exporter](https://github.com/prometheus/blackbox_exporter)
* [Pushgateway](https://github.com/prometheus/pushgateway)
* [Prometheus documentation](https://prometheus.io/docs/)
Prometheus includes an [Alertmanager](https://prometheus.io/docs/alerting/latest/alertmanager/) component for routing notifications (email, PagerDuty, Slack, etc.). For long-term metric retention beyond Prometheus' local TSDB retention window, integrate remote storage solutions using Prometheus' `remote_write`/`remote_read` APIs.
Quick example: Prometheus scrape configuration
```yaml theme={null}
global:
scrape_interval: 15s
scrape_configs:
- job_name: 'node'
static_configs:
- targets: ['localhost:9100']
- job_name: 'my-app'
static_configs:
- targets: ['my-app:8080']
```
Example: Prometheus text exposition format
```text theme={null}
# HELP http_requests_total Total number of HTTP requests
# TYPE http_requests_total counter
http_requests_total{method="GET",handler="/api"} 1027
# HELP cpu_seconds_total Total user and system CPU time spent in seconds
# TYPE cpu_seconds_total counter
cpu_seconds_total{cpu="0"} 12345.67
```
Metric types and when to use them
| Metric type | Purpose | Typical use cases |
| ----------- | ---------------------------------------------------------- | -------------------------------------------- |
| Counter | Monotonically increasing value; only increases (or resets) | Total requests served: `http_requests_total` |
| Gauge | Value that can go up or down | Current memory usage or temperature |
| Histogram | Buckets observations and counts/sums for quantiles | Request latency distributions |
| Summary | Client-side quantiles and counts over sliding time windows | Percentile latency at the client side |
Prometheus components at a glance
| Component | Role | Notes / Links |
| ----------------- | -------------------------------------------------------- | --------------------------------------------------------------------------------- |
| Prometheus server | Scrapes targets and stores metrics in the TSDB | Query with PromQL |
| Alertmanager | Receives alerts from Prometheus and routes notifications | See [Alertmanager docs](https://prometheus.io/docs/alerting/latest/alertmanager/) |
| Exporters | Translate non-Prometheus data into metrics | Examples: `node_exporter`, `blackbox_exporter` |
| Pushgateway | Accepts push metrics for short-lived jobs | Not intended for service metrics |
A few additional technical notes
* Service discovery: Prometheus supports multiple discovery mechanisms (Kubernetes, Consul, EC2, DNS) so targets can be discovered dynamically.
* Alerting rules: Define rules in Prometheus to evaluate conditions and send alerts to Alertmanager for notification and silencing.
* Retention and remote storage: Prometheus' local TSDB is optimized for recent data. For long-term retention, use compatible remote storage backends via `remote_write`/`remote_read`.
* Choosing metric types: Use counters for totals, gauges for instantaneous values, histograms/summaries for latency distributions.
Background and further reading
Prometheus originated at SoundCloud and joined the Cloud Native Computing Foundation (CNCF) in 2016. It is implemented primarily in Go. For full documentation, client libraries, and exporter examples, see the official Prometheus docs: `https://prometheus.io/docs/`.
Links and references
* [Prometheus querying basics (PromQL)](https://prometheus.io/docs/prometheus/latest/querying/basics/)
* [Grafana](https://grafana.com/)
* [node\_exporter](https://github.com/prometheus/node_exporter)
* [blackbox\_exporter](https://github.com/prometheus/blackbox_exporter)
* [Pushgateway](https://github.com/prometheus/pushgateway)
* [Prometheus documentation](https://prometheus.io/docs/)