> ## Documentation Index
> Fetch the complete documentation index at: https://notes.kodekloud.com/llms.txt
> Use this file to discover all available pages before exploring further.
# Prometheus Installation
> Guide to installing and starting Prometheus on a Linux bare-metal or VM using precompiled binaries, configuring, and verifying with the web UI and a basic PromQL query.
This guide walks through installing a Prometheus server on a Bare-Metal/VM system using the precompiled Linux binary. It covers downloading the release, extracting the archive, inspecting the directory layout, starting the server, and verifying the installation with the web UI and a simple PromQL query.
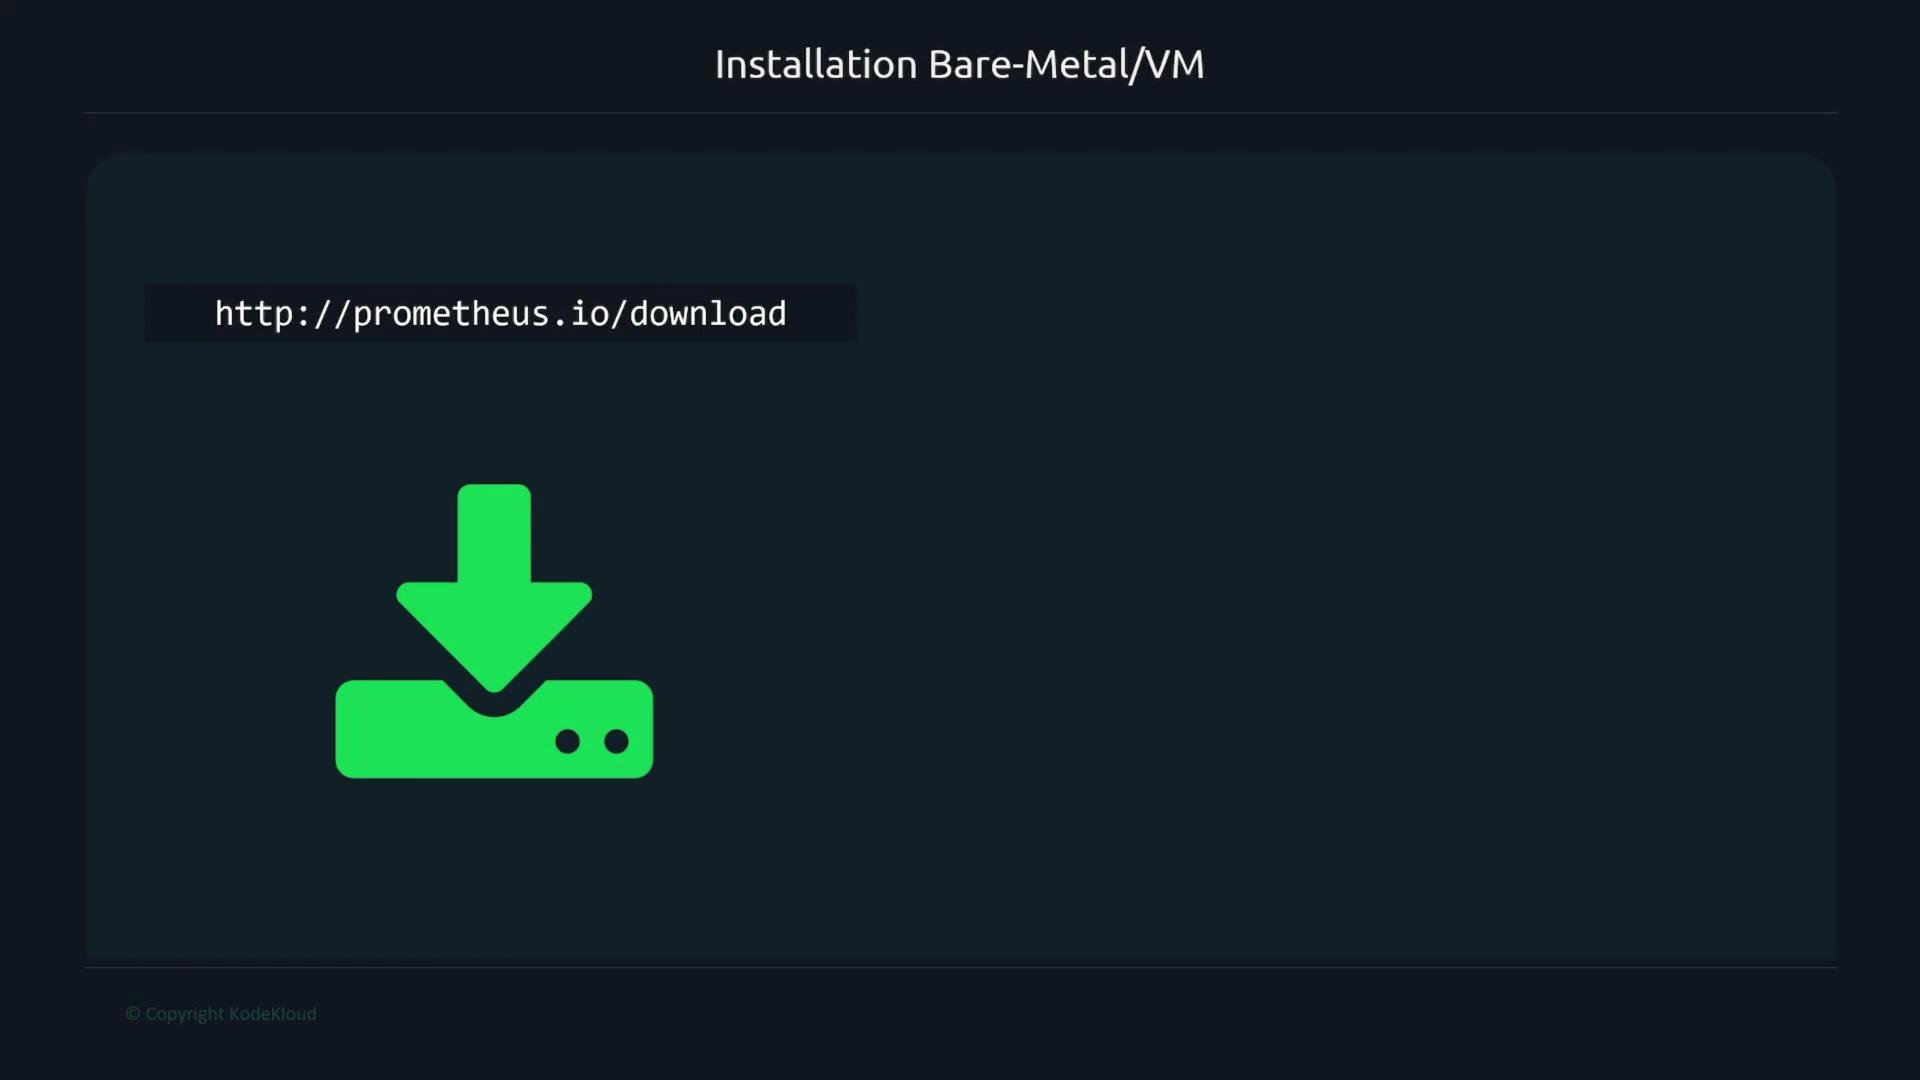 ## Overview — high level
* Download the Prometheus tarball for your OS/architecture from the official downloads page.
* Extract the tarball to get the `prometheus` binary, `promtool`, and `prometheus.yml`.
* Start the server with `./prometheus`.
* Visit the web UI at `http://:9090` and run a basic `up` query to confirm the server is scraping itself.
Always download the latest stable Prometheus release from the official site: [https://prometheus.io/download/](https://prometheus.io/download/). New releases include bug fixes and new features; examples in this guide use older version filenames for illustration only.
## 1) Download the Prometheus binary
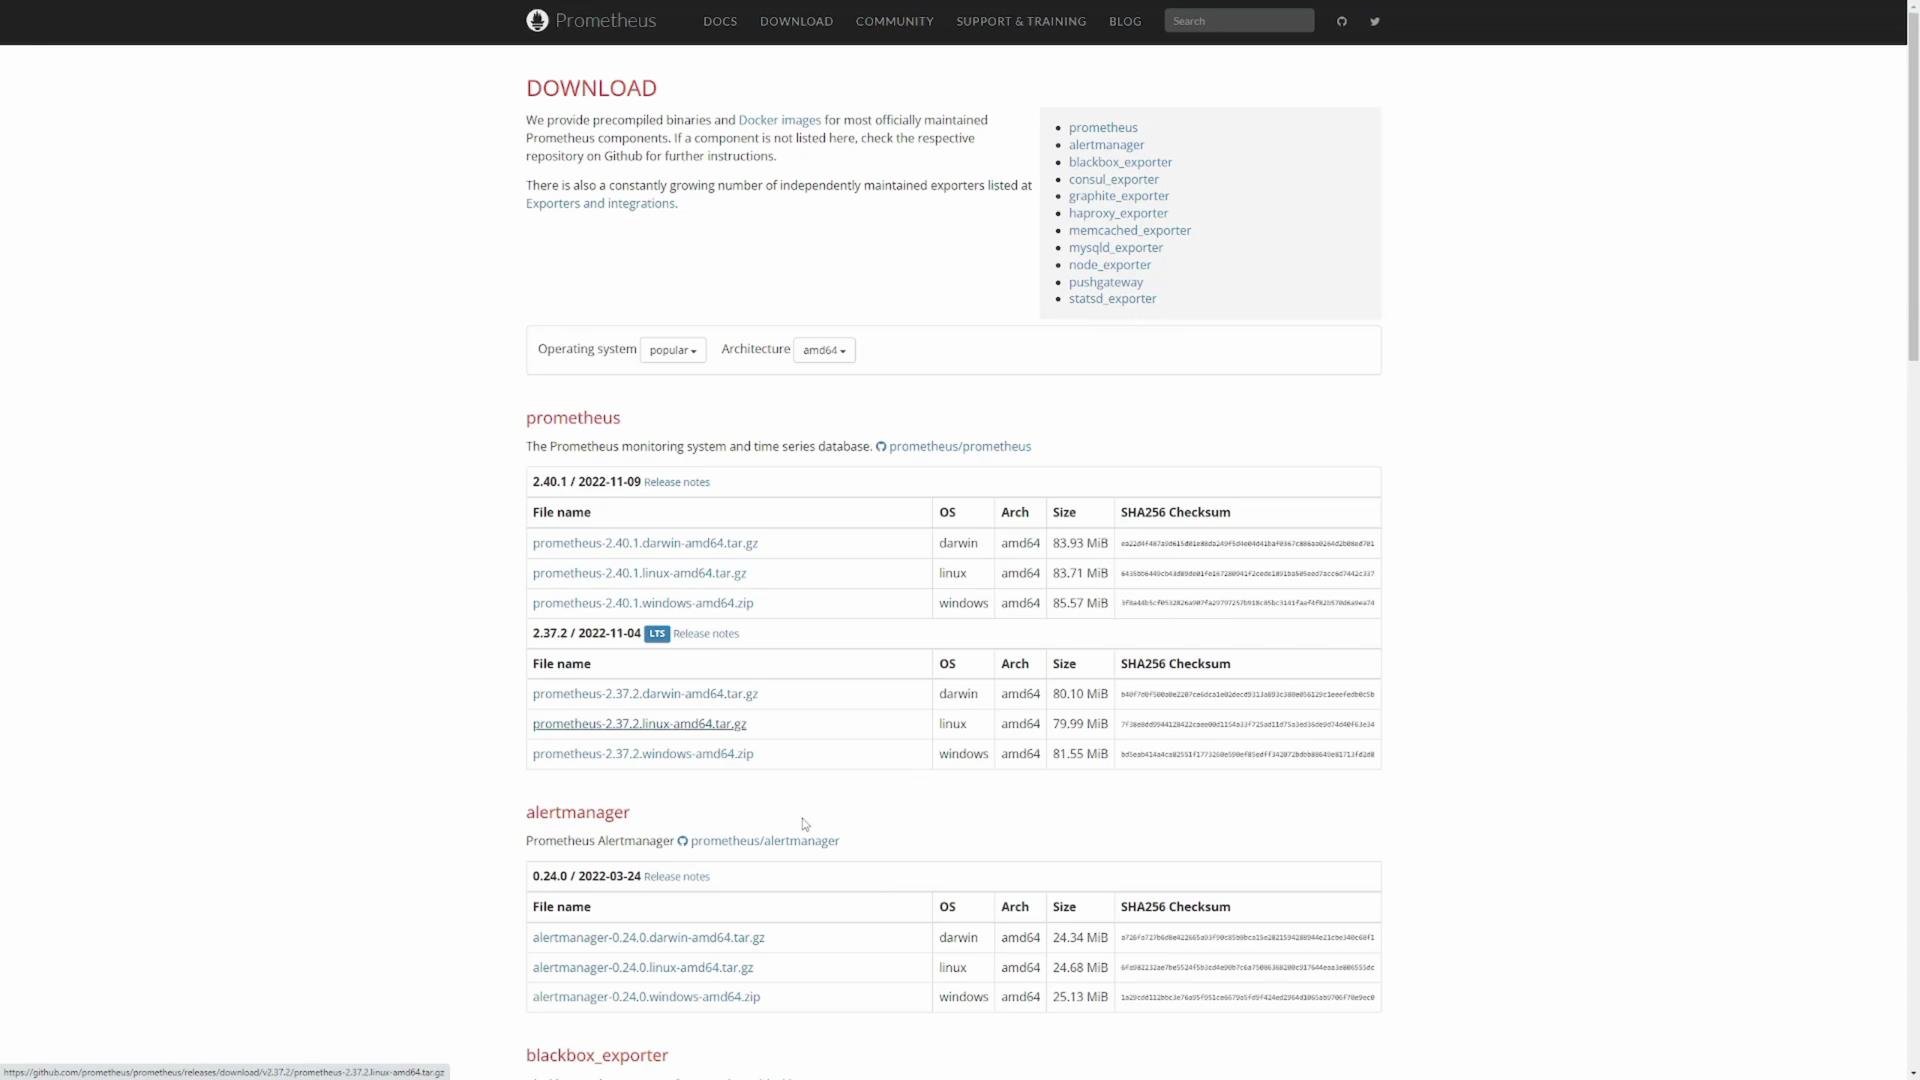
Visit the Prometheus download page, select the Linux AMD64 (or the correct OS/arch), and copy the link to the tarball. You can fetch it directly on the target machine with `wget` (paste the copied URL).
Example (replace with the URL you copied):
```bash theme={null}
# Example: download a particular release (replace with the latest or your desired version)
wget https://github.com/prometheus/prometheus/releases/download/v2.37.0/prometheus-2.37.0.linux-amd64.tar.gz
```
After downloading, verify the tarball exists:
```bash theme={null}
ls -l
# Example output
# -rw-r--r-- 1 user1 user1 83782323 Jul 14 11:38 prometheus-2.37.0.linux-amd64.tar.gz
```
## 2) Extract the tarball and inspect contents
Extract the downloaded tarball:
```bash theme={null}
tar xvf prometheus-2.37.0.linux-amd64.tar.gz
```
Move into the extracted directory and list its contents:
```bash theme={null}
cd prometheus-2.37.0.linux-amd64/
ls -l
# Example output:
# drwxr-xr-x 2 user1 user1 4096 Jul 14 11:30 console_libraries
# drwxr-xr-x 2 user1 user1 4096 Jul 14 11:30 consoles
# -rw-r--r-- 1 user1 user1 11357 Jul 14 11:30 LICENSE
# -rw-r--r-- 1 user1 user1 3773 Jul 14 11:30 NOTICE
# -rwxr-xr-x 1 user1 user1 109655433 Jul 14 11:30 prometheus
# -rw-r--r-- 1 user1 user1 934 Jul 14 11:30 prometheus.yml
# -rwxr-xr-x 1 user1 user1 101469395 Jul 14 11:18 promtool
```
What each important file is for:
* `prometheus` — the Prometheus server executable.
* `prometheus.yml` — the main configuration file; defines scrape targets and jobs.
* `promtool` — CLI utility to validate configuration and assist with rule files.
* `consoles/` and `console_libraries/` — optional UI console templates.
## 3) Start the Prometheus server
From the extracted directory run:
```bash theme={null}
./prometheus
```
You should see logs indicating the server and TSDB started, the configuration file was loaded, and the HTTP server is ready. Example lines:
```bash theme={null}
ts=2022-09-02T03:25:25.910Z caller=main.go:996 level=info msg="TSDB started"
ts=2022-09-02T03:25:25.910Z caller=main.go:1177 level=info msg="Loading configuration file" filename=prometheus.yml
ts=2022-09-02T03:25:25.910Z caller=main.go:957 level=info msg="Server is ready to receive web requests."
ts=2022-09-02T03:25:25.910Z caller=manager.go:941 level=info component="rule manager" msg="Starting rule manager..."
```
If running on a remote machine, ensure port `9090` is reachable (open in firewall/security group) before connecting with a browser. Also avoid running Prometheus as root; use a dedicated user for production deployments.
## 4) Verify via the web UI and a simple query
Open a browser to the Prometheus web UI:
* Local: `http://localhost:9090`
* Remote: `http://:9090`
The default web expression browser lets you execute PromQL queries. To verify Prometheus is scraping itself, run the simplest query:
```text theme={null}
up
```
You should see a result similar to:
`up{instance="localhost:9090", job="prometheus"}`
A value of `1` indicates the target is up; `0` indicates down.
## Visual: Prometheus website and download block
Here’s the Prometheus website download block where you choose the binary and version:
## Overview — high level
* Download the Prometheus tarball for your OS/architecture from the official downloads page.
* Extract the tarball to get the `prometheus` binary, `promtool`, and `prometheus.yml`.
* Start the server with `./prometheus`.
* Visit the web UI at `http://:9090` and run a basic `up` query to confirm the server is scraping itself.
Always download the latest stable Prometheus release from the official site: [https://prometheus.io/download/](https://prometheus.io/download/). New releases include bug fixes and new features; examples in this guide use older version filenames for illustration only.
## 1) Download the Prometheus binary
Visit the Prometheus download page, select the Linux AMD64 (or the correct OS/arch), and copy the link to the tarball. You can fetch it directly on the target machine with `wget` (paste the copied URL).
Example (replace with the URL you copied):
```bash theme={null}
# Example: download a particular release (replace with the latest or your desired version)
wget https://github.com/prometheus/prometheus/releases/download/v2.37.0/prometheus-2.37.0.linux-amd64.tar.gz
```
After downloading, verify the tarball exists:
```bash theme={null}
ls -l
# Example output
# -rw-r--r-- 1 user1 user1 83782323 Jul 14 11:38 prometheus-2.37.0.linux-amd64.tar.gz
```
## 2) Extract the tarball and inspect contents
Extract the downloaded tarball:
```bash theme={null}
tar xvf prometheus-2.37.0.linux-amd64.tar.gz
```
Move into the extracted directory and list its contents:
```bash theme={null}
cd prometheus-2.37.0.linux-amd64/
ls -l
# Example output:
# drwxr-xr-x 2 user1 user1 4096 Jul 14 11:30 console_libraries
# drwxr-xr-x 2 user1 user1 4096 Jul 14 11:30 consoles
# -rw-r--r-- 1 user1 user1 11357 Jul 14 11:30 LICENSE
# -rw-r--r-- 1 user1 user1 3773 Jul 14 11:30 NOTICE
# -rwxr-xr-x 1 user1 user1 109655433 Jul 14 11:30 prometheus
# -rw-r--r-- 1 user1 user1 934 Jul 14 11:30 prometheus.yml
# -rwxr-xr-x 1 user1 user1 101469395 Jul 14 11:18 promtool
```
What each important file is for:
* `prometheus` — the Prometheus server executable.
* `prometheus.yml` — the main configuration file; defines scrape targets and jobs.
* `promtool` — CLI utility to validate configuration and assist with rule files.
* `consoles/` and `console_libraries/` — optional UI console templates.
## 3) Start the Prometheus server
From the extracted directory run:
```bash theme={null}
./prometheus
```
You should see logs indicating the server and TSDB started, the configuration file was loaded, and the HTTP server is ready. Example lines:
```bash theme={null}
ts=2022-09-02T03:25:25.910Z caller=main.go:996 level=info msg="TSDB started"
ts=2022-09-02T03:25:25.910Z caller=main.go:1177 level=info msg="Loading configuration file" filename=prometheus.yml
ts=2022-09-02T03:25:25.910Z caller=main.go:957 level=info msg="Server is ready to receive web requests."
ts=2022-09-02T03:25:25.910Z caller=manager.go:941 level=info component="rule manager" msg="Starting rule manager..."
```
If running on a remote machine, ensure port `9090` is reachable (open in firewall/security group) before connecting with a browser. Also avoid running Prometheus as root; use a dedicated user for production deployments.
## 4) Verify via the web UI and a simple query
Open a browser to the Prometheus web UI:
* Local: `http://localhost:9090`
* Remote: `http://:9090`
The default web expression browser lets you execute PromQL queries. To verify Prometheus is scraping itself, run the simplest query:
```text theme={null}
up
```
You should see a result similar to:
`up{instance="localhost:9090", job="prometheus"}`
A value of `1` indicates the target is up; `0` indicates down.
## Visual: Prometheus website and download block
Here’s the Prometheus website download block where you choose the binary and version:
 And the releases page listing precompiled binaries and checksums (select the correct OS/arch and copy the link address for wget):
 ## Quick reference table
| Resource | Default / Example | Notes |
| ----------------- | ------------------------------------------------: | ------------------------------------------ |
| Web UI port | `:9090` | Access via `http://:9090` |
| Config file | `prometheus.yml` | Located in the extracted directory |
| Prometheus binary | `./prometheus` | Start the server from the extracted folder |
| Promtool | `promtool` | Validate config and rules |
| Example PromQL | `up{instance="localhost:9090", job="prometheus"}` | `1` = up, `0` = down |
## Useful links and references
* Prometheus download page: [https://prometheus.io/download/](https://prometheus.io/download/)
* Prometheus documentation (configuration & PromQL): [https://prometheus.io/docs/](https://prometheus.io/docs/)
* Prometheus GitHub releases: [https://github.com/prometheus/prometheus/releases](https://github.com/prometheus/prometheus/releases)
Follow these steps to get a local Prometheus server running quickly. Once confirmed, you can customize `prometheus.yml` to add scrape targets and integrate Alertmanager, Grafana, or other monitoring components.
## Quick reference table
| Resource | Default / Example | Notes |
| ----------------- | ------------------------------------------------: | ------------------------------------------ |
| Web UI port | `:9090` | Access via `http://:9090` |
| Config file | `prometheus.yml` | Located in the extracted directory |
| Prometheus binary | `./prometheus` | Start the server from the extracted folder |
| Promtool | `promtool` | Validate config and rules |
| Example PromQL | `up{instance="localhost:9090", job="prometheus"}` | `1` = up, `0` = down |
## Useful links and references
* Prometheus download page: [https://prometheus.io/download/](https://prometheus.io/download/)
* Prometheus documentation (configuration & PromQL): [https://prometheus.io/docs/](https://prometheus.io/docs/)
* Prometheus GitHub releases: [https://github.com/prometheus/prometheus/releases](https://github.com/prometheus/prometheus/releases)
Follow these steps to get a local Prometheus server running quickly. Once confirmed, you can customize `prometheus.yml` to add scrape targets and integrate Alertmanager, Grafana, or other monitoring components.