> ## Documentation Index
> Fetch the complete documentation index at: https://notes.kodekloud.com/llms.txt
> Use this file to discover all available pages before exploring further.
# Prometheus Use Case
> Overview of Prometheus production use cases including metric aggregation across sites, alerting for resource exhaustion, and correlating application metrics to identify performance thresholds.
In this lesson we cover three common Prometheus production use cases: aggregating metrics across locations, alerting on resource exhaustion, and correlating application metrics to identify performance thresholds. These examples show why Prometheus is widely adopted for monitoring and how teams typically operate it in real environments.
Start with a common scenario: multiple data centers across the country plus workloads in a cloud provider (for example, [AWS](https://learn.kodekloud.com/user/courses/aws-for-beginners-with-hands-on-labs)). Your goal is a single, unified view of key metrics from all locations—CPU, memory, request latency, error rates, and more.
Prometheus can collect and present this data. Typical deployment patterns include running one Prometheus instance per site or environment, then aggregating metrics with federation or centralizing them via `remote_write` to a long-term store. Prometheus also includes a built-in expression browser and graphing UI for quick exploration. For richer dashboards, teams commonly pair Prometheus with [Grafana](https://learn.kodekloud.com/user/courses/grafana-loki).
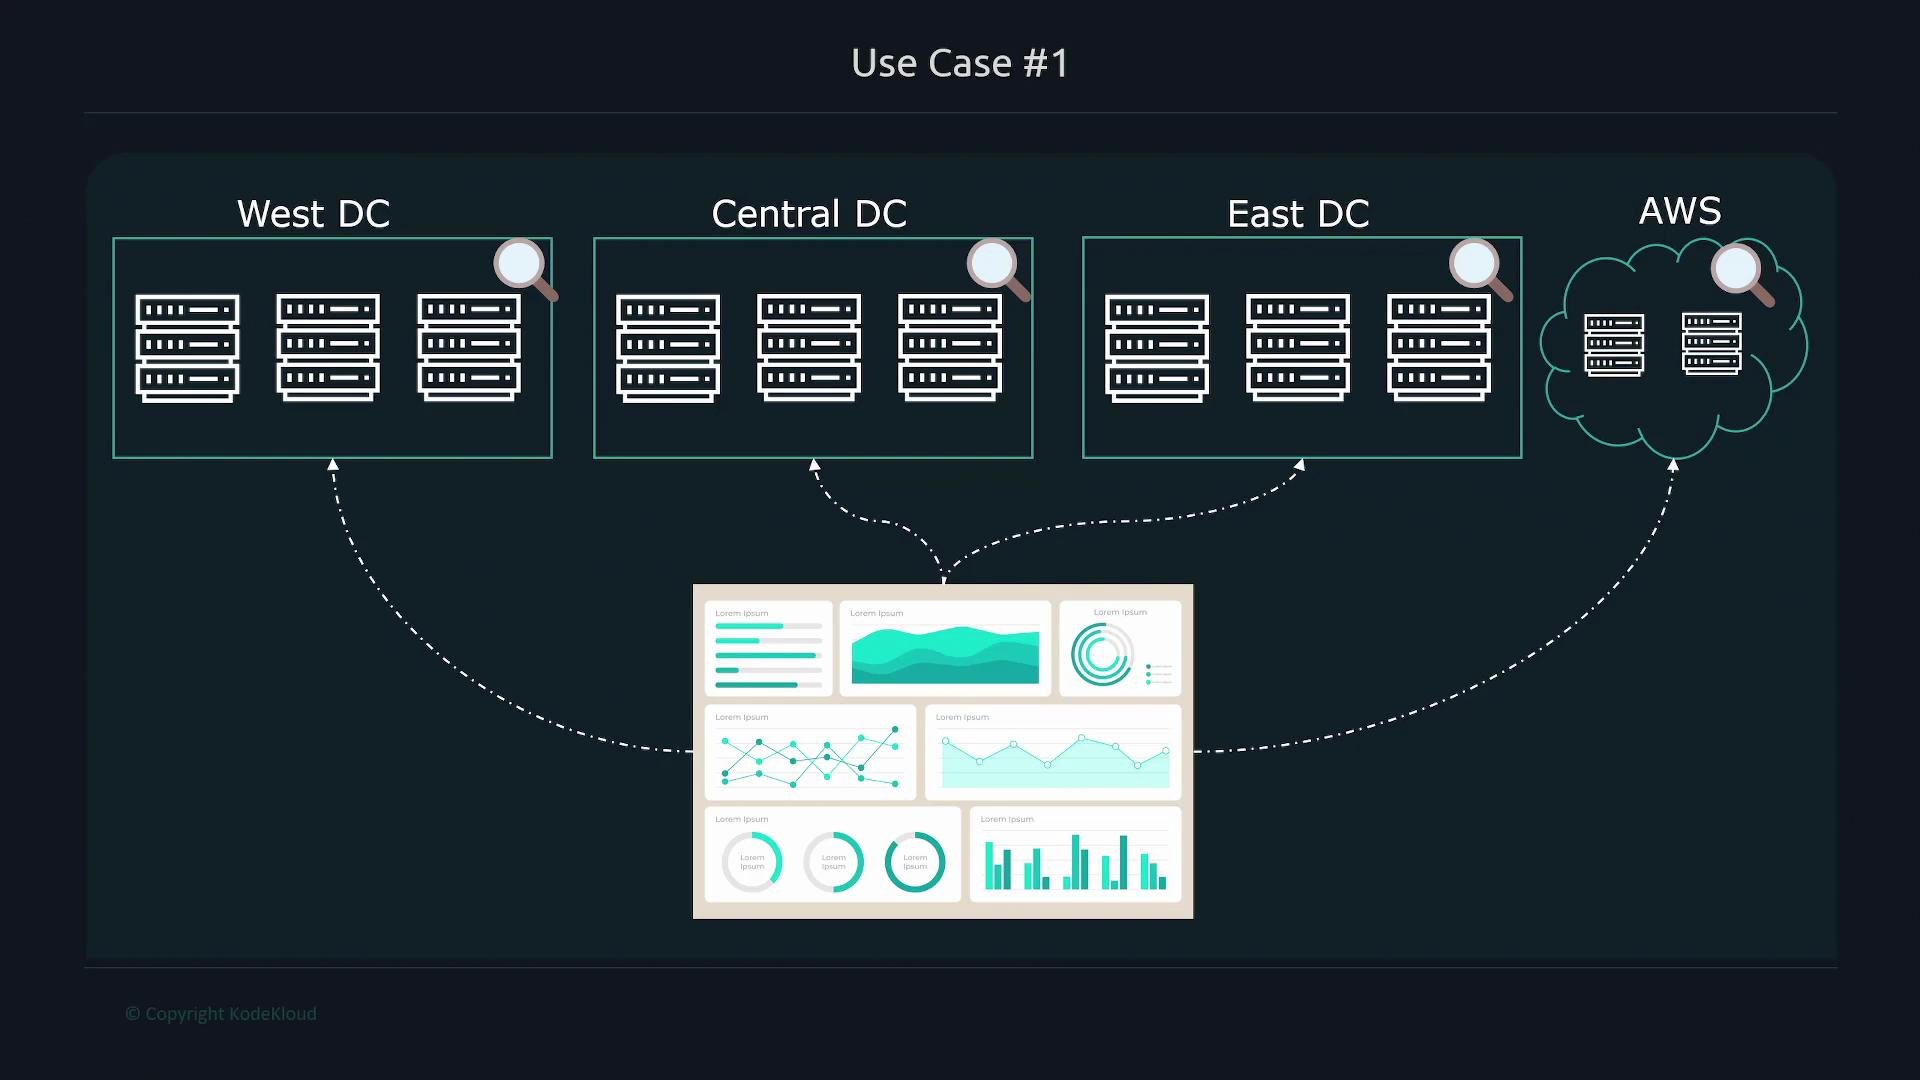 All of that data can be displayed on a single dashboard by scraping instrumented services or exporters at each location and aggregating results using one of the approaches below.
| Aggregation approach | When to use | Key trade-offs |
| ----------------------------------------- | ----------------------------------------------------------------------------------: | ------------------------------------------------------------------------------------- |
| Per-site Prometheus + federation | Multiple independent sites with occasional cross-site queries | Simpler isolation, lower coupling; federation can be complex for global queries |
| Centralized remote write (`remote_write`) | Long-term storage (clickhouse, Cortex, Thanos, VictoriaMetrics) and unified queries | Enables high-availability and long retention, but adds external storage/manageability |
| Hybrid (federation + remote\_write) | Mix of local alerting and long-term analytics | Balances local resilience with centralized analytics |
## Use case 2: Alerting on memory saturation
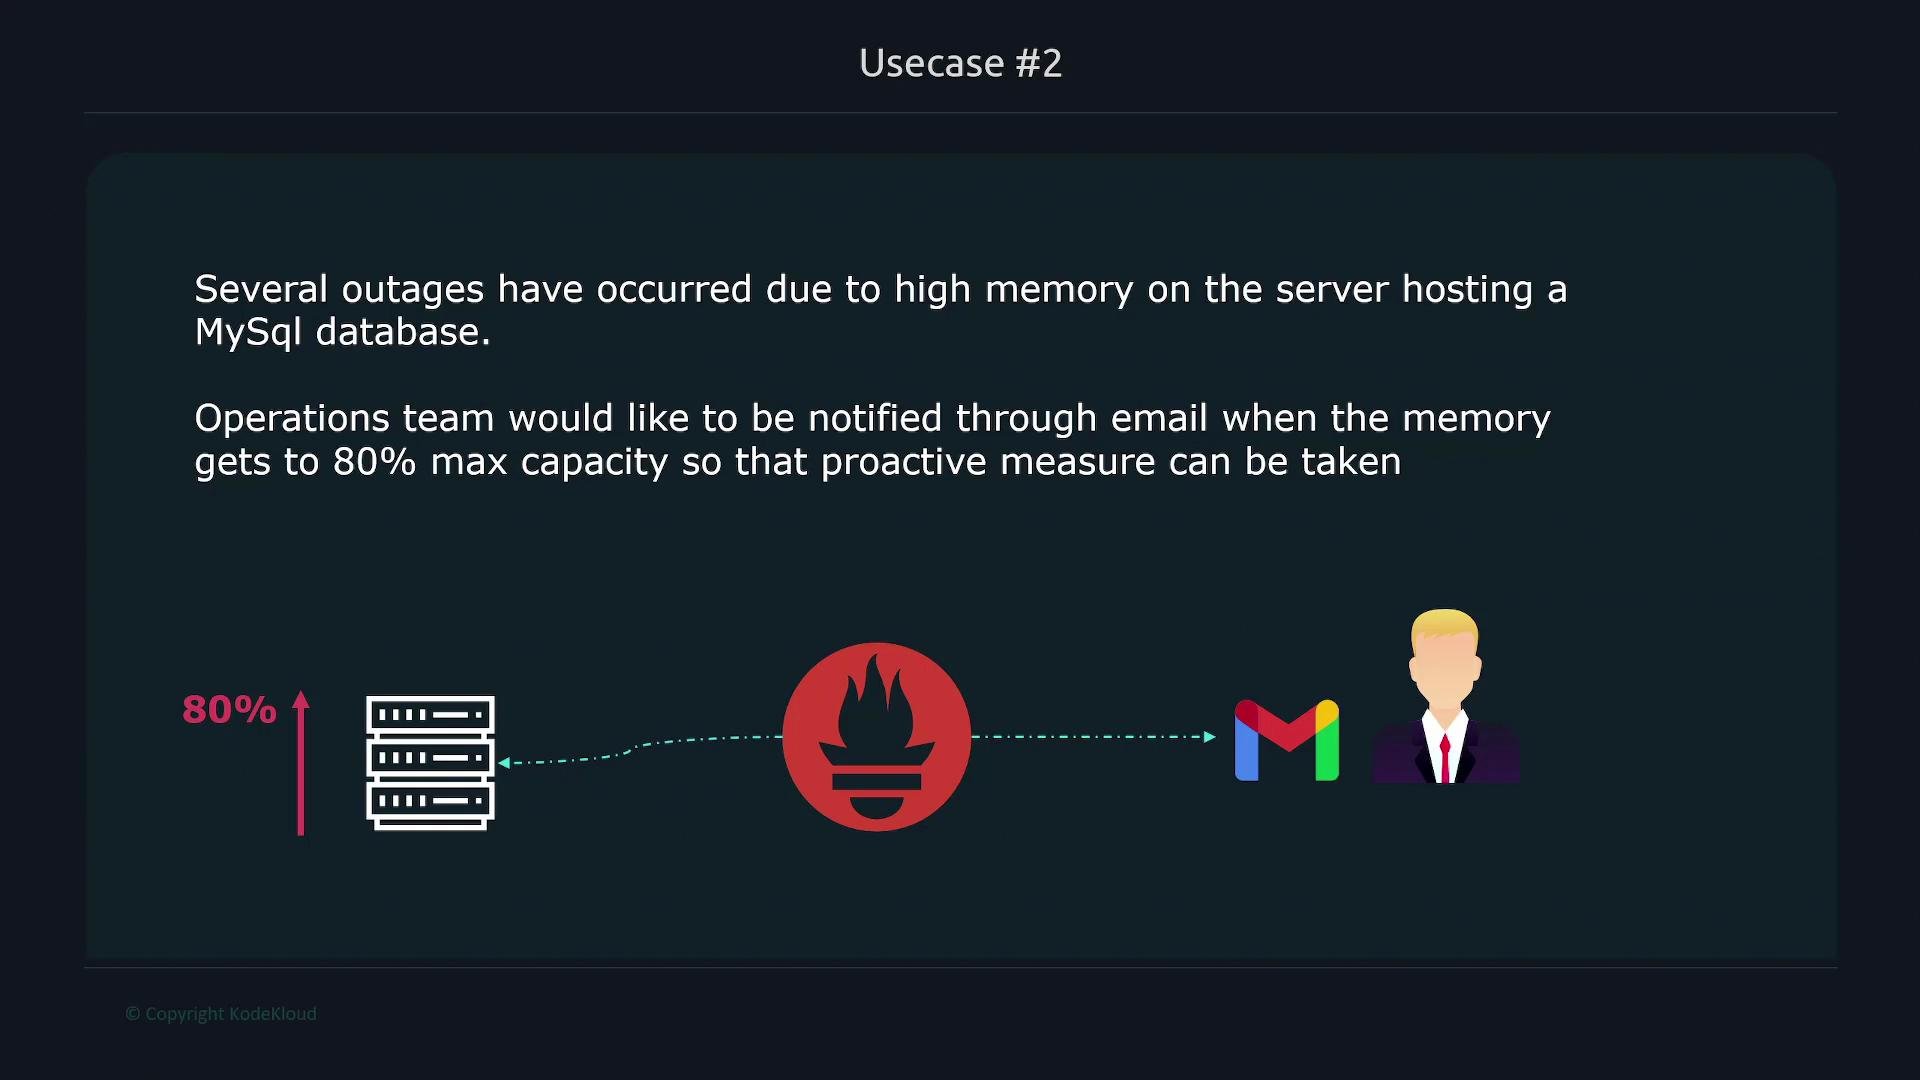
Imagine repeated outages caused by high memory usage on the MySQL host. The operations team wants alerts (email, Slack, PagerDuty) when memory usage hits 80% so they can intervene before users are affected.
Prometheus evaluates alerting rules (PromQL) and emits alerts when conditions are true. Alertmanager receives those alerts and handles deduplication, grouping, inhibition, and delivery to receivers such as email, Slack, or PagerDuty.
All of that data can be displayed on a single dashboard by scraping instrumented services or exporters at each location and aggregating results using one of the approaches below.
| Aggregation approach | When to use | Key trade-offs |
| ----------------------------------------- | ----------------------------------------------------------------------------------: | ------------------------------------------------------------------------------------- |
| Per-site Prometheus + federation | Multiple independent sites with occasional cross-site queries | Simpler isolation, lower coupling; federation can be complex for global queries |
| Centralized remote write (`remote_write`) | Long-term storage (clickhouse, Cortex, Thanos, VictoriaMetrics) and unified queries | Enables high-availability and long retention, but adds external storage/manageability |
| Hybrid (federation + remote\_write) | Mix of local alerting and long-term analytics | Balances local resilience with centralized analytics |
## Use case 2: Alerting on memory saturation
Imagine repeated outages caused by high memory usage on the MySQL host. The operations team wants alerts (email, Slack, PagerDuty) when memory usage hits 80% so they can intervene before users are affected.
Prometheus evaluates alerting rules (PromQL) and emits alerts when conditions are true. Alertmanager receives those alerts and handles deduplication, grouping, inhibition, and delivery to receivers such as email, Slack, or PagerDuty.
 A straightforward alerting rule for high memory usage:
```yaml theme={null}
groups:
- name: node.rules
rules:
- alert: HighMemoryUsage
expr: (node_memory_MemTotal_bytes - node_memory_MemAvailable_bytes) / node_memory_MemTotal_bytes * 100 > 80
for: 5m
labels:
severity: critical
annotations:
summary: "High memory usage on `{{ $labels.instance }}`"
description: "Memory usage is above 80% for more than 5 minutes on `{{ $labels.instance }}`."
```
Prometheus evaluates alerting rules; Alertmanager is responsible for routing and delivering alerts to channels (email, Slack, PagerDuty, SMS). Configure Alertmanager receivers and routing rules to control notification behavior and silence management.
## Use case 3: Finding the upload size where latency degrades
You’ve shipped a video upload feature and need to know the file size at which request latency begins to increase noticeably. The recommended approach:
* Instrument the application to expose upload metrics:
* Use a histogram for request durations, e.g. `upload_request_duration_seconds_bucket`.
* Record upload sizes as a gauge or histogram (e.g., `upload_size_bytes`).
* Attach meaningful labels (endpoint, status\_code, instance) when appropriate.
* Scrape these metrics with Prometheus and visualize them in Grafana or the Prometheus expression browser.
* Use PromQL to correlate average upload size and latency over time.
Useful PromQL examples:
* Average upload size over the last 5 minutes (if each upload reports `upload_size_bytes` as a per-request gauge):
```promql theme={null}
avg_over_time(upload_size_bytes[5m])
```
* 95th percentile request duration over the last 5 minutes (based on a histogram named `upload_request_duration_seconds_bucket`):
```promql theme={null}
histogram_quantile(0.95, sum(rate(upload_request_duration_seconds_bucket[5m])) by (le))
```
Plot both series on a dashboard to visually identify the file-size range where latency increases. You can also create an alert that fires only when both average size and high latency occur together:
```promql theme={null}
(
avg_over_time(upload_size_bytes[5m]) > 50 * 1024 * 1024
)
and
(
histogram_quantile(0.95, sum(rate(upload_request_duration_seconds_bucket[5m])) by (le)) > 2
)
```
This expression becomes true when the 5-minute average upload size exceeds 50 MiB and the 95th-percentile latency exceeds 2 seconds.
When combining vector results with logical operators (for example `and`), ensure the vectors have compatible label sets. Use aggregation or vector matching (for example, `on(instance)`) to align labels so the compound expression behaves as intended.
## Putting it all together
Prometheus supports the full workflow for these use cases:
* Distributed collection and aggregation: run per-site Prometheus instances and consolidate with federation or `remote_write`.
* Alerting: express rules in PromQL, evaluate them in Prometheus, and manage delivery through Alertmanager.
* Instrumentation-driven observability: use histograms for latency and size, counters for counts, and gauges for instantaneous values to correlate metrics and drive data-informed decisions.
Recommended checklist for production readiness:
* Instrument services with appropriate metric types (histogram for latency, gauge for sizes, counters for totals).
* Scrape application endpoints and exporters reliably (configure scrape intervals and relabeling).
* Define and test PromQL queries in the expression browser and dashboards.
* Create alerting rules with appropriate `for` durations to avoid flapping.
* Configure Alertmanager routes and receivers for on-call workflows.
* Choose aggregation/retention strategy (federation vs `remote_write`) based on query needs and retention requirements.
Links and references
* [Prometheus documentation](https://prometheus.io/docs/)
* [Alertmanager documentation](https://prometheus.io/docs/alerting/latest/alertmanager/)
* [PromQL quick reference](https://prometheus.io/docs/prometheus/latest/querying/basics/)
* [Grafana](https://learn.kodekloud.com/user/courses/grafana-loki)
A straightforward alerting rule for high memory usage:
```yaml theme={null}
groups:
- name: node.rules
rules:
- alert: HighMemoryUsage
expr: (node_memory_MemTotal_bytes - node_memory_MemAvailable_bytes) / node_memory_MemTotal_bytes * 100 > 80
for: 5m
labels:
severity: critical
annotations:
summary: "High memory usage on `{{ $labels.instance }}`"
description: "Memory usage is above 80% for more than 5 minutes on `{{ $labels.instance }}`."
```
Prometheus evaluates alerting rules; Alertmanager is responsible for routing and delivering alerts to channels (email, Slack, PagerDuty, SMS). Configure Alertmanager receivers and routing rules to control notification behavior and silence management.
## Use case 3: Finding the upload size where latency degrades
You’ve shipped a video upload feature and need to know the file size at which request latency begins to increase noticeably. The recommended approach:
* Instrument the application to expose upload metrics:
* Use a histogram for request durations, e.g. `upload_request_duration_seconds_bucket`.
* Record upload sizes as a gauge or histogram (e.g., `upload_size_bytes`).
* Attach meaningful labels (endpoint, status\_code, instance) when appropriate.
* Scrape these metrics with Prometheus and visualize them in Grafana or the Prometheus expression browser.
* Use PromQL to correlate average upload size and latency over time.
Useful PromQL examples:
* Average upload size over the last 5 minutes (if each upload reports `upload_size_bytes` as a per-request gauge):
```promql theme={null}
avg_over_time(upload_size_bytes[5m])
```
* 95th percentile request duration over the last 5 minutes (based on a histogram named `upload_request_duration_seconds_bucket`):
```promql theme={null}
histogram_quantile(0.95, sum(rate(upload_request_duration_seconds_bucket[5m])) by (le))
```
Plot both series on a dashboard to visually identify the file-size range where latency increases. You can also create an alert that fires only when both average size and high latency occur together:
```promql theme={null}
(
avg_over_time(upload_size_bytes[5m]) > 50 * 1024 * 1024
)
and
(
histogram_quantile(0.95, sum(rate(upload_request_duration_seconds_bucket[5m])) by (le)) > 2
)
```
This expression becomes true when the 5-minute average upload size exceeds 50 MiB and the 95th-percentile latency exceeds 2 seconds.
When combining vector results with logical operators (for example `and`), ensure the vectors have compatible label sets. Use aggregation or vector matching (for example, `on(instance)`) to align labels so the compound expression behaves as intended.
## Putting it all together
Prometheus supports the full workflow for these use cases:
* Distributed collection and aggregation: run per-site Prometheus instances and consolidate with federation or `remote_write`.
* Alerting: express rules in PromQL, evaluate them in Prometheus, and manage delivery through Alertmanager.
* Instrumentation-driven observability: use histograms for latency and size, counters for counts, and gauges for instantaneous values to correlate metrics and drive data-informed decisions.
Recommended checklist for production readiness:
* Instrument services with appropriate metric types (histogram for latency, gauge for sizes, counters for totals).
* Scrape application endpoints and exporters reliably (configure scrape intervals and relabeling).
* Define and test PromQL queries in the expression browser and dashboards.
* Create alerting rules with appropriate `for` durations to avoid flapping.
* Configure Alertmanager routes and receivers for on-call workflows.
* Choose aggregation/retention strategy (federation vs `remote_write`) based on query needs and retention requirements.
Links and references
* [Prometheus documentation](https://prometheus.io/docs/)
* [Alertmanager documentation](https://prometheus.io/docs/alerting/latest/alertmanager/)
* [PromQL quick reference](https://prometheus.io/docs/prometheus/latest/querying/basics/)
* [Grafana](https://learn.kodekloud.com/user/courses/grafana-loki)