> ## Documentation Index
> Fetch the complete documentation index at: https://notes.kodekloud.com/llms.txt
> Use this file to discover all available pages before exploring further.
# Prometheus in Docker Container
> Guide to running Prometheus in a Docker container using bind-mounted configuration, exposing port 9090, and handling Docker networking and data persistence
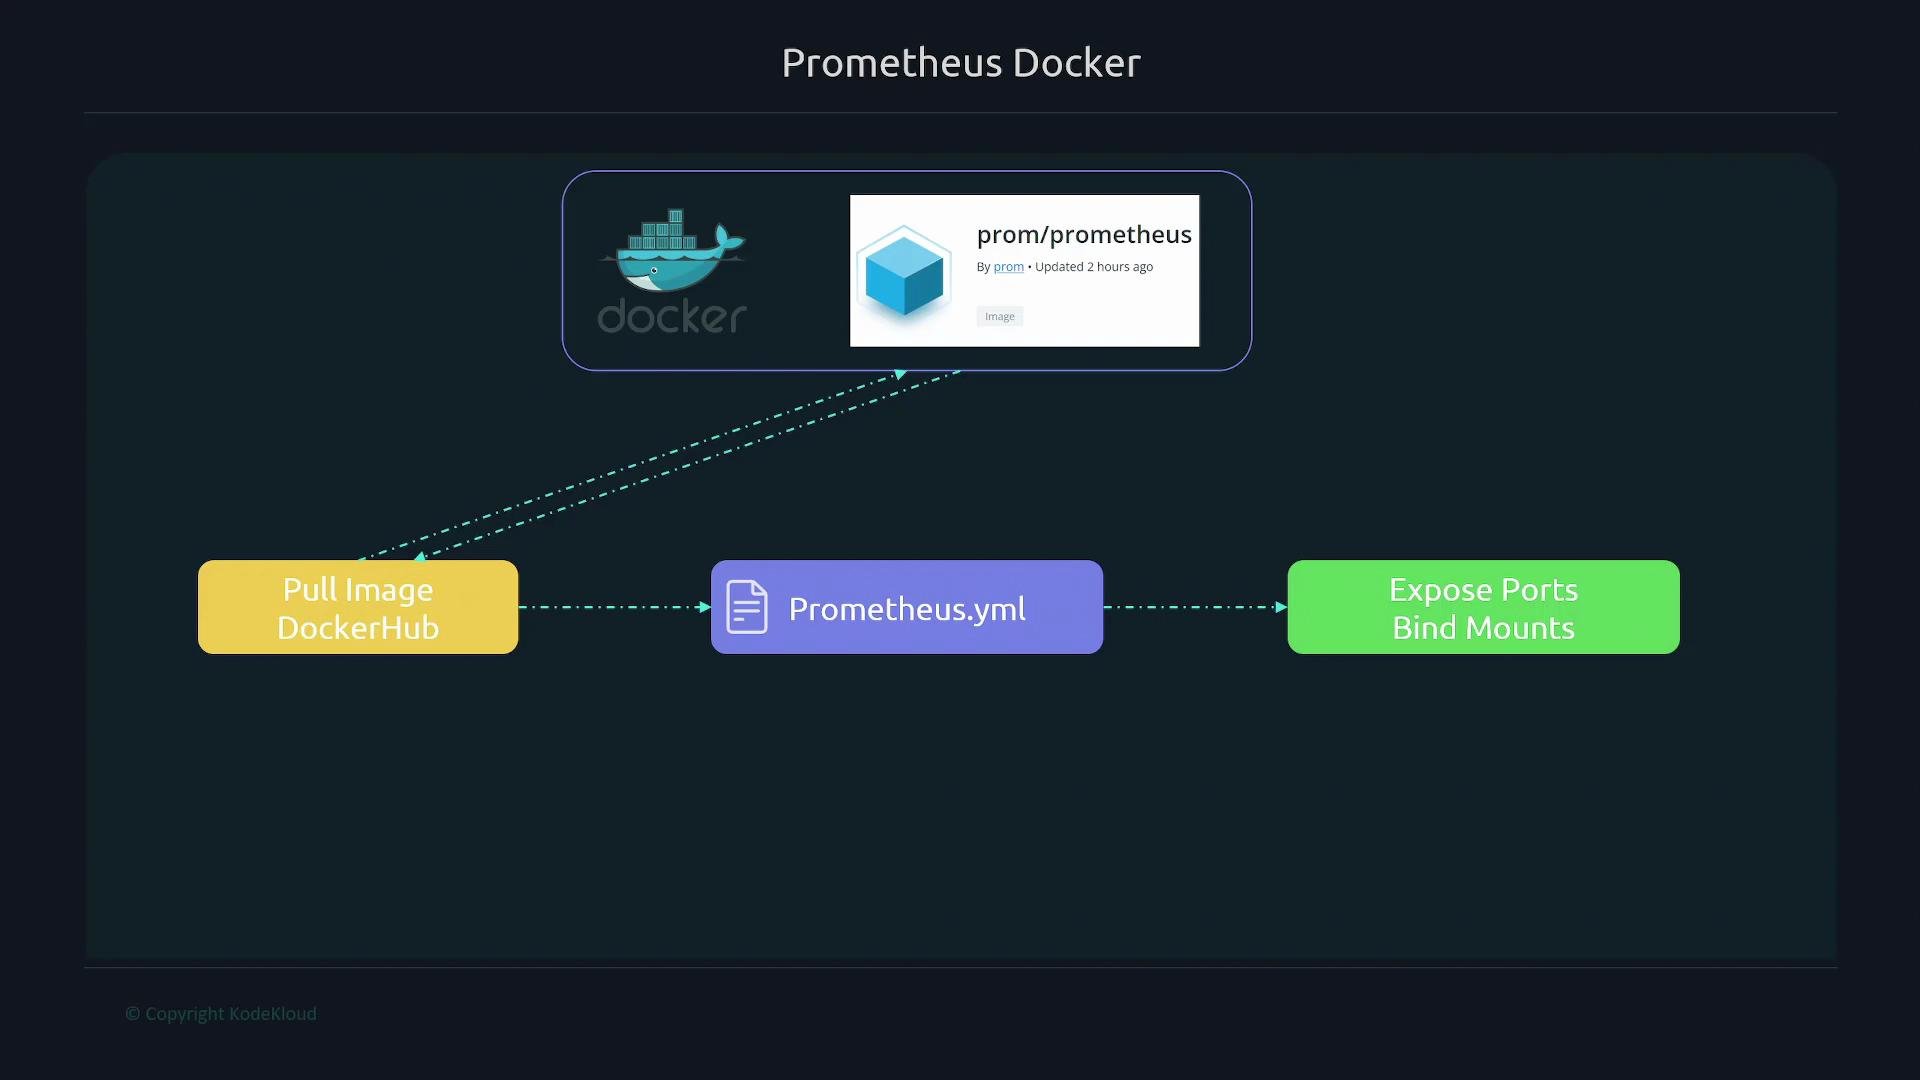
This guide shows how to run Prometheus inside a Docker container. The typical workflow is simple:
* Pull the official Prometheus image from Docker Hub.
* Provide a Prometheus configuration file (`prometheus.yml`) from the host into the container using a bind mount.
* Expose Prometheus' HTTP port so you can access the UI and API.
When running Prometheus in a container, the configuration format remains identical to running on a VM or bare-metal server. You still provide a `prometheus.yml` with your `scrape_configs` and `global` settings. Below is a minimal configuration that instructs Prometheus to scrape itself.
 Example `prometheus.yml`:
```yaml theme={null}
global:
scrape_interval: 15s
scrape_configs:
- job_name: "prometheus"
static_configs:
- targets: ["localhost:9090"]
```
Notes about `localhost` inside a container
* `localhost:9090` refers to the container's loopback interface. Use this target when Prometheus scrapes metrics exposed by processes running in the same container (for example, Prometheus scraping itself).
* To scrape services running on the Docker host from inside the container, use `host.docker.internal:PORT` (supported on Docker Desktop) or run the container with `--network=host` on Linux. See Docker networking docs for more details: [https://docs.docker.com/desktop/networking/](https://docs.docker.com/desktop/networking/)
If you need Prometheus inside the container to reach services on the Docker host, prefer `host.docker.internal` on Docker Desktop. On Linux, `--network=host` is an easy option, but it only works on Linux hosts.
Create the `prometheus.yml` on your host (for example with `vi` or your preferred editor), then run the Prometheus container with a bind mount that maps your host configuration into `/etc/prometheus/prometheus.yml` inside the container. Expose port `9090` so you can access Prometheus from the host browser.
Example commands:
```bash theme={null}
# Edit or create the configuration file on the host
vi prometheus.yml
# Run Prometheus in Docker with a bind mount and port mapping
docker run -d \
--name prometheus \
-v /path/to/prometheus.yml:/etc/prometheus/prometheus.yml:ro \
-v /path/to/data:/prometheus \
-p 9090:9090 \
prom/prometheus
```
Prometheus Docker run flags and their purpose
| Flag / Option | Purpose | Example / Notes |
| -------------------------------------------------------------- | ---------------------------------------------------- | ------------------------------------------------------------------------------------ |
| `-d` | Run the container in detached mode | Keeps container running in background |
| `--name prometheus` | Assign a friendly container name | Use this instead of container ID when managing |
| `-v /path/to/prometheus.yml:/etc/prometheus/prometheus.yml:ro` | Bind mount host config into container (read-only) | Replace `/path/to/prometheus.yml` with the absolute path on your host |
| `-v /path/to/data:/prometheus` | Persist Prometheus TSDB data outside the container | Optional but recommended for long-term metrics |
| `-p 9090:9090` | Map host port 9090 to container port 9090 | Access UI at `http://localhost:9090` on the host |
| `prom/prometheus` | Image name (official Prometheus image on Docker Hub) | [https://hub.docker.com/r/prom/prometheus](https://hub.docker.com/r/prom/prometheus) |
Best practices and operational notes
* Always use an absolute path for the host side of bind mounts (e.g., `/home/user/prometheus.yml`), otherwise Docker may create unexpected anonymous volumes.
* The bind mount keeps the container's Prometheus configuration in sync with the host file: editing the host `prometheus.yml` will immediately update the file inside the container. Prometheus, however, needs to reload the configuration for changes to take effect.
Prometheus will not automatically apply edited configs unless it reloads them. Either restart the container or trigger a config reload via Prometheus' reload mechanism (for example, POST to `/-/reload` if available). Check the Prometheus configuration reloading docs: [https://prometheus.io/docs/prometheus/latest/configuration/configuration/#reloading-configuration](https://prometheus.io/docs/prometheus/latest/configuration/configuration/#reloading-configuration)
Accessing the Prometheus UI
After the container starts, open your browser and go to:
[http://localhost:9090](http://localhost:9090)
This opens the Prometheus expression browser, status pages, and API endpoints.
Links and references
* Prometheus configuration and reloading: [https://prometheus.io/docs/prometheus/latest/configuration/configuration/](https://prometheus.io/docs/prometheus/latest/configuration/configuration/)
* Docker networking (host.docker.internal, networking details): [https://docs.docker.com/desktop/networking/](https://docs.docker.com/desktop/networking/)
* Official Prometheus Docker image on Docker Hub: [https://hub.docker.com/r/prom/prometheus](https://hub.docker.com/r/prom/prometheus)
Example `prometheus.yml`:
```yaml theme={null}
global:
scrape_interval: 15s
scrape_configs:
- job_name: "prometheus"
static_configs:
- targets: ["localhost:9090"]
```
Notes about `localhost` inside a container
* `localhost:9090` refers to the container's loopback interface. Use this target when Prometheus scrapes metrics exposed by processes running in the same container (for example, Prometheus scraping itself).
* To scrape services running on the Docker host from inside the container, use `host.docker.internal:PORT` (supported on Docker Desktop) or run the container with `--network=host` on Linux. See Docker networking docs for more details: [https://docs.docker.com/desktop/networking/](https://docs.docker.com/desktop/networking/)
If you need Prometheus inside the container to reach services on the Docker host, prefer `host.docker.internal` on Docker Desktop. On Linux, `--network=host` is an easy option, but it only works on Linux hosts.
Create the `prometheus.yml` on your host (for example with `vi` or your preferred editor), then run the Prometheus container with a bind mount that maps your host configuration into `/etc/prometheus/prometheus.yml` inside the container. Expose port `9090` so you can access Prometheus from the host browser.
Example commands:
```bash theme={null}
# Edit or create the configuration file on the host
vi prometheus.yml
# Run Prometheus in Docker with a bind mount and port mapping
docker run -d \
--name prometheus \
-v /path/to/prometheus.yml:/etc/prometheus/prometheus.yml:ro \
-v /path/to/data:/prometheus \
-p 9090:9090 \
prom/prometheus
```
Prometheus Docker run flags and their purpose
| Flag / Option | Purpose | Example / Notes |
| -------------------------------------------------------------- | ---------------------------------------------------- | ------------------------------------------------------------------------------------ |
| `-d` | Run the container in detached mode | Keeps container running in background |
| `--name prometheus` | Assign a friendly container name | Use this instead of container ID when managing |
| `-v /path/to/prometheus.yml:/etc/prometheus/prometheus.yml:ro` | Bind mount host config into container (read-only) | Replace `/path/to/prometheus.yml` with the absolute path on your host |
| `-v /path/to/data:/prometheus` | Persist Prometheus TSDB data outside the container | Optional but recommended for long-term metrics |
| `-p 9090:9090` | Map host port 9090 to container port 9090 | Access UI at `http://localhost:9090` on the host |
| `prom/prometheus` | Image name (official Prometheus image on Docker Hub) | [https://hub.docker.com/r/prom/prometheus](https://hub.docker.com/r/prom/prometheus) |
Best practices and operational notes
* Always use an absolute path for the host side of bind mounts (e.g., `/home/user/prometheus.yml`), otherwise Docker may create unexpected anonymous volumes.
* The bind mount keeps the container's Prometheus configuration in sync with the host file: editing the host `prometheus.yml` will immediately update the file inside the container. Prometheus, however, needs to reload the configuration for changes to take effect.
Prometheus will not automatically apply edited configs unless it reloads them. Either restart the container or trigger a config reload via Prometheus' reload mechanism (for example, POST to `/-/reload` if available). Check the Prometheus configuration reloading docs: [https://prometheus.io/docs/prometheus/latest/configuration/configuration/#reloading-configuration](https://prometheus.io/docs/prometheus/latest/configuration/configuration/#reloading-configuration)
Accessing the Prometheus UI
After the container starts, open your browser and go to:
[http://localhost:9090](http://localhost:9090)
This opens the Prometheus expression browser, status pages, and API endpoints.
Links and references
* Prometheus configuration and reloading: [https://prometheus.io/docs/prometheus/latest/configuration/configuration/](https://prometheus.io/docs/prometheus/latest/configuration/configuration/)
* Docker networking (host.docker.internal, networking details): [https://docs.docker.com/desktop/networking/](https://docs.docker.com/desktop/networking/)
* Official Prometheus Docker image on Docker Hub: [https://hub.docker.com/r/prom/prometheus](https://hub.docker.com/r/prom/prometheus)