> ## Documentation Index
> Fetch the complete documentation index at: https://notes.kodekloud.com/llms.txt
> Use this file to discover all available pages before exploring further.
# Installation
> Installing and running Prometheus Pushgateway, configuring systemd and Prometheus to scrape it, usage for short-lived or batch jobs, verification and troubleshooting
This lesson shows how to install Prometheus Pushgateway, run it for testing, and configure Prometheus to scrape it. Use Pushgateway when short-lived or batch jobs need to push metrics to Prometheus.
## 1) Download Pushgateway
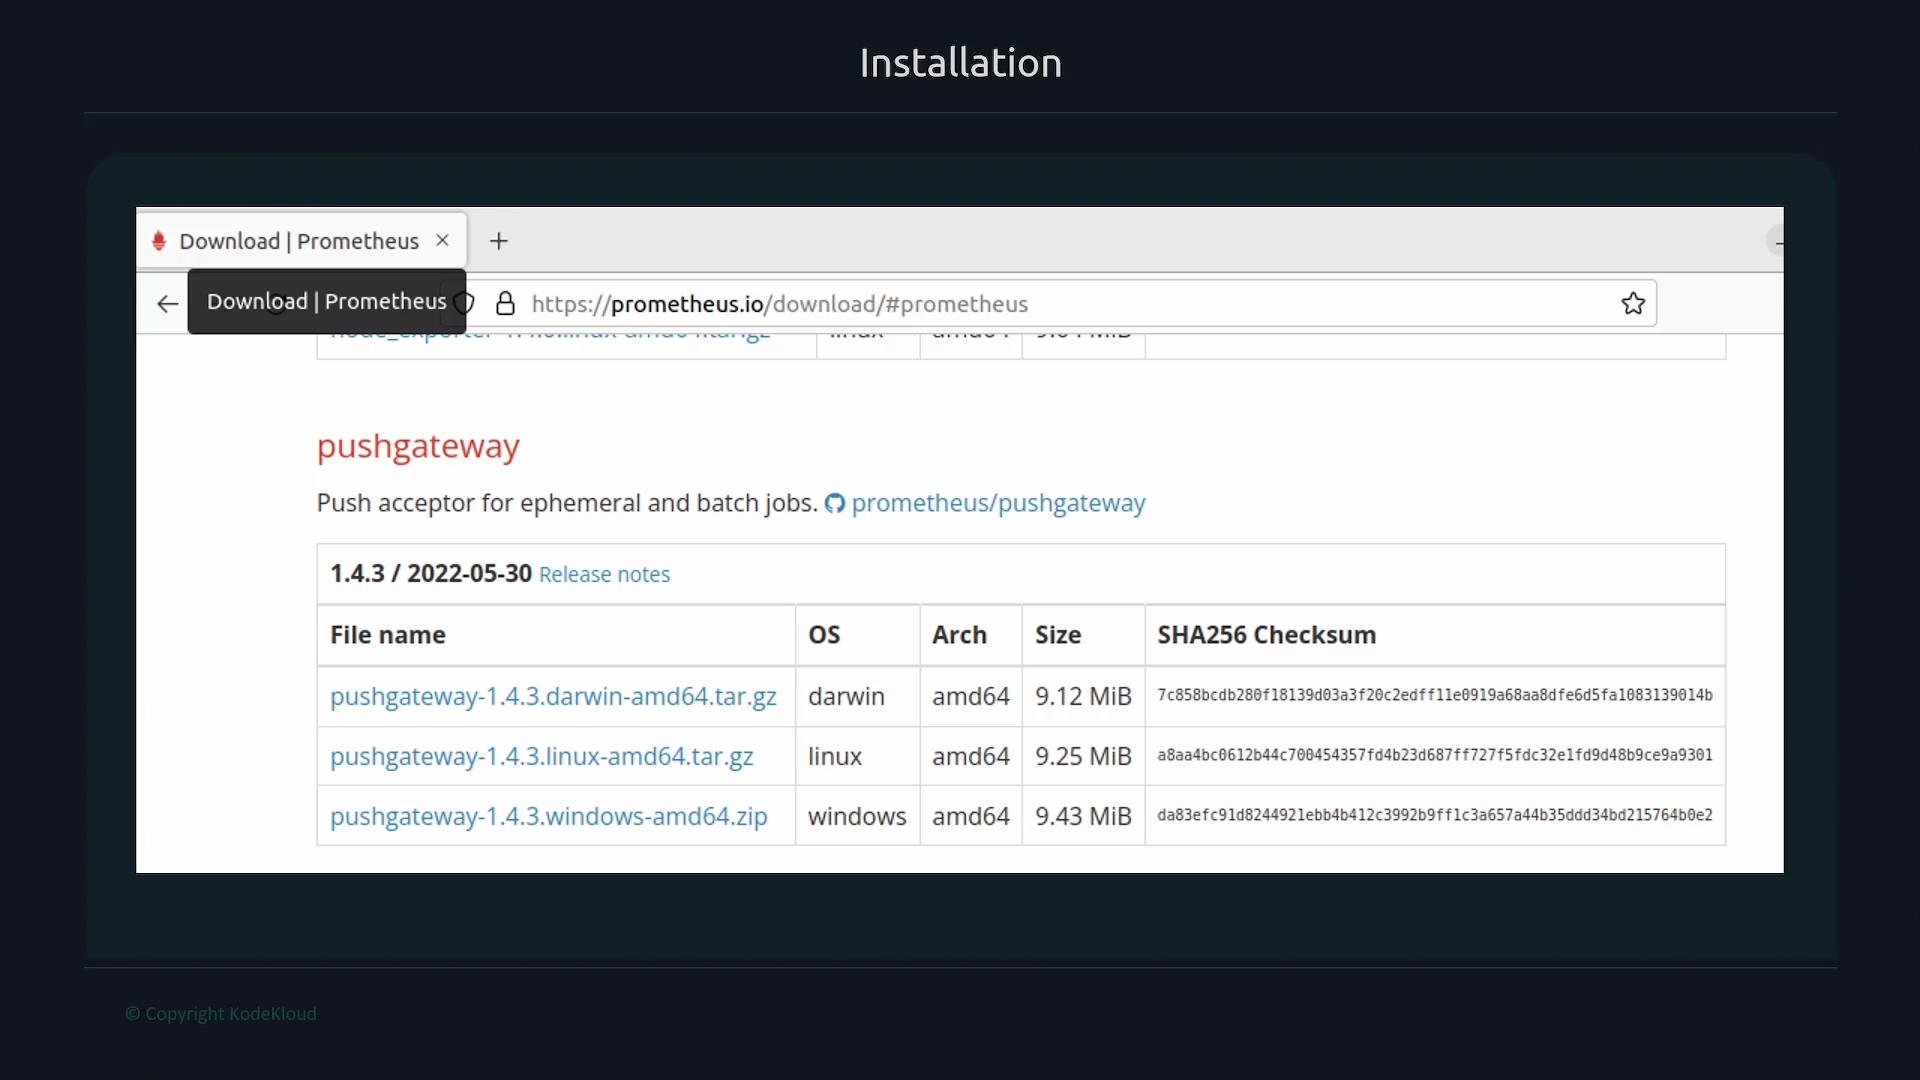
Download the latest Pushgateway release from the official GitHub Releases page:
* [https://github.com/prometheus/pushgateway/releases](https://github.com/prometheus/pushgateway/releases)
 ## 2) Extract and run (quick test)
After downloading the release tarball on your server, extract it and change into the extracted directory:
```bash theme={null}
wget https://github.com/prometheus/pushgateway/releases/download/v1.4.3/pushgateway-1.4.3.linux-amd64.tar.gz
tar xvzf pushgateway-1.4.3.linux-amd64.tar.gz
cd pushgateway-1.4.3.linux-amd64
```
For a quick test you can run the `pushgateway` binary directly; it listens on port `9091` by default:
```bash theme={null}
./pushgateway
```
Open another terminal and verify the metrics endpoint:
```bash theme={null}
curl localhost:9091/metrics
# HELP process_start_time_seconds Start time of the process since unix epoch in seconds.
# TYPE process_start_time_seconds gauge
process_start_time_seconds 1.665721119292e+09
# HELP process_virtual_memory_bytes Virtual memory size in bytes.
# TYPE process_virtual_memory_bytes gauge
process_virtual_memory_bytes 7.3271296e+08
# HELP process_virtual_memory_max_bytes Maximum amount of virtual memory available in bytes.
# TYPE process_virtual_memory_max_bytes gauge
process_virtual_memory_max_bytes 1.8446744073709552e+19
# HELP pushgateway_build_info A metric with a constant '1' value labeled by version, revision, branch, and goversion from which pushgateway was built.
# TYPE pushgateway_build_info gauge
pushgateway_build_info{branch="HEAD",goversion="go1.18.2",revision="f9dc1c8664050edbc75916c3664be1df595a1958",version="1.4.3"} 1
```
## 3) Install as a systemd service (recommended for production)
Run Pushgateway under systemd to ensure it starts on boot and is managed consistently.
Create a dedicated system user and install the binary:
```bash theme={null}
sudo useradd --no-create-home --shell /bin/false pushgateway
sudo cp pushgateway /usr/local/bin/
sudo chown pushgateway:pushgateway /usr/local/bin/pushgateway
sudo chmod 0755 /usr/local/bin/pushgateway
```
Create the systemd unit file at `/etc/systemd/system/pushgateway.service` with the following content:
```ini theme={null}
[Unit]
Description=Prometheus Pushgateway
Wants=network-online.target
After=network-online.target
[Service]
User=pushgateway
Group=pushgateway
Type=simple
ExecStart=/usr/local/bin/pushgateway
[Install]
WantedBy=multi-user.target
```
Reload systemd, start and enable the service:
```bash theme={null}
sudo systemctl daemon-reload
sudo systemctl start pushgateway
sudo systemctl enable pushgateway
sudo systemctl status pushgateway
```
## Quick reference: common commands and locations
| Purpose | Command / Path |
| ---------------------- | ----------------------------------------- |
| Run binary for testing | `./pushgateway` |
| Systemd unit file | `/etc/systemd/system/pushgateway.service` |
| Installed binary | `/usr/local/bin/pushgateway` |
| Service user | `pushgateway` |
| Default listen port | `9091` |
If your server has a firewall (for example `ufw` or `firewalld`), ensure port `9091` is open for Prometheus scrapes or only allow access from Prometheus servers. Running services as root is not recommended — the example above uses a dedicated unprivileged `pushgateway` user.
## 4) Configure Prometheus to scrape Pushgateway
Add Pushgateway as a scrape target in your `prometheus.yml`. In many setups you should enable `honor_labels: true` so label values pushed by clients (for example `job` and `instance`) are preserved in Prometheus instead of being replaced by the Pushgateway scrape labels.
Example `prometheus.yml` snippet:
```yaml theme={null}
scrape_configs:
- job_name: pushgateway
honor_labels: true
static_configs:
- targets: ["192.168.1.168:9091"]
```
Use `honor_labels: true` when multiple jobs push metrics to Pushgateway and you want the original `job` and `instance` labels from the pushing clients to be preserved in Prometheus. Without this, Prometheus will overwrite those labels with the Pushgateway's own scrape labels.
## 5) Verify end-to-end
1. Push a sample metric from a client (example using curl):
```bash theme={null}
echo "my_job_metric 42" | curl --data-binary @- http://:9091/metrics/job/my_job/instance/one
```
2. Confirm metrics are visible on Pushgateway:
```bash theme={null}
curl http://:9091/metrics
```
3. Confirm Prometheus scrapes the Pushgateway and the metric appears in Prometheus targets and in PromQL queries (use the Prometheus UI at `/targets` and `/graph`).
## Troubleshooting tips
* If metrics don’t appear in Prometheus:
* Verify `prometheus.yml` has the correct address and that Prometheus has reloaded.
* Check `honor_labels` behavior — it may affect label attribution.
* Confirm network/firewall rules allow Prometheus to reach port `9091`.
* Check logs:
* Pushgateway logs: `journalctl -u pushgateway`
* Prometheus logs: `journalctl -u prometheus` or view Prometheus UI logs.
## Links and references
* Prometheus Pushgateway Releases: [https://github.com/prometheus/pushgateway/releases](https://github.com/prometheus/pushgateway/releases)
* Prometheus documentation: [https://prometheus.io/docs/](https://prometheus.io/docs/)
## 2) Extract and run (quick test)
After downloading the release tarball on your server, extract it and change into the extracted directory:
```bash theme={null}
wget https://github.com/prometheus/pushgateway/releases/download/v1.4.3/pushgateway-1.4.3.linux-amd64.tar.gz
tar xvzf pushgateway-1.4.3.linux-amd64.tar.gz
cd pushgateway-1.4.3.linux-amd64
```
For a quick test you can run the `pushgateway` binary directly; it listens on port `9091` by default:
```bash theme={null}
./pushgateway
```
Open another terminal and verify the metrics endpoint:
```bash theme={null}
curl localhost:9091/metrics
# HELP process_start_time_seconds Start time of the process since unix epoch in seconds.
# TYPE process_start_time_seconds gauge
process_start_time_seconds 1.665721119292e+09
# HELP process_virtual_memory_bytes Virtual memory size in bytes.
# TYPE process_virtual_memory_bytes gauge
process_virtual_memory_bytes 7.3271296e+08
# HELP process_virtual_memory_max_bytes Maximum amount of virtual memory available in bytes.
# TYPE process_virtual_memory_max_bytes gauge
process_virtual_memory_max_bytes 1.8446744073709552e+19
# HELP pushgateway_build_info A metric with a constant '1' value labeled by version, revision, branch, and goversion from which pushgateway was built.
# TYPE pushgateway_build_info gauge
pushgateway_build_info{branch="HEAD",goversion="go1.18.2",revision="f9dc1c8664050edbc75916c3664be1df595a1958",version="1.4.3"} 1
```
## 3) Install as a systemd service (recommended for production)
Run Pushgateway under systemd to ensure it starts on boot and is managed consistently.
Create a dedicated system user and install the binary:
```bash theme={null}
sudo useradd --no-create-home --shell /bin/false pushgateway
sudo cp pushgateway /usr/local/bin/
sudo chown pushgateway:pushgateway /usr/local/bin/pushgateway
sudo chmod 0755 /usr/local/bin/pushgateway
```
Create the systemd unit file at `/etc/systemd/system/pushgateway.service` with the following content:
```ini theme={null}
[Unit]
Description=Prometheus Pushgateway
Wants=network-online.target
After=network-online.target
[Service]
User=pushgateway
Group=pushgateway
Type=simple
ExecStart=/usr/local/bin/pushgateway
[Install]
WantedBy=multi-user.target
```
Reload systemd, start and enable the service:
```bash theme={null}
sudo systemctl daemon-reload
sudo systemctl start pushgateway
sudo systemctl enable pushgateway
sudo systemctl status pushgateway
```
## Quick reference: common commands and locations
| Purpose | Command / Path |
| ---------------------- | ----------------------------------------- |
| Run binary for testing | `./pushgateway` |
| Systemd unit file | `/etc/systemd/system/pushgateway.service` |
| Installed binary | `/usr/local/bin/pushgateway` |
| Service user | `pushgateway` |
| Default listen port | `9091` |
If your server has a firewall (for example `ufw` or `firewalld`), ensure port `9091` is open for Prometheus scrapes or only allow access from Prometheus servers. Running services as root is not recommended — the example above uses a dedicated unprivileged `pushgateway` user.
## 4) Configure Prometheus to scrape Pushgateway
Add Pushgateway as a scrape target in your `prometheus.yml`. In many setups you should enable `honor_labels: true` so label values pushed by clients (for example `job` and `instance`) are preserved in Prometheus instead of being replaced by the Pushgateway scrape labels.
Example `prometheus.yml` snippet:
```yaml theme={null}
scrape_configs:
- job_name: pushgateway
honor_labels: true
static_configs:
- targets: ["192.168.1.168:9091"]
```
Use `honor_labels: true` when multiple jobs push metrics to Pushgateway and you want the original `job` and `instance` labels from the pushing clients to be preserved in Prometheus. Without this, Prometheus will overwrite those labels with the Pushgateway's own scrape labels.
## 5) Verify end-to-end
1. Push a sample metric from a client (example using curl):
```bash theme={null}
echo "my_job_metric 42" | curl --data-binary @- http://:9091/metrics/job/my_job/instance/one
```
2. Confirm metrics are visible on Pushgateway:
```bash theme={null}
curl http://:9091/metrics
```
3. Confirm Prometheus scrapes the Pushgateway and the metric appears in Prometheus targets and in PromQL queries (use the Prometheus UI at `/targets` and `/graph`).
## Troubleshooting tips
* If metrics don’t appear in Prometheus:
* Verify `prometheus.yml` has the correct address and that Prometheus has reloaded.
* Check `honor_labels` behavior — it may affect label attribution.
* Confirm network/firewall rules allow Prometheus to reach port `9091`.
* Check logs:
* Pushgateway logs: `journalctl -u pushgateway`
* Prometheus logs: `journalctl -u prometheus` or view Prometheus UI logs.
## Links and references
* Prometheus Pushgateway Releases: [https://github.com/prometheus/pushgateway/releases](https://github.com/prometheus/pushgateway/releases)
* Prometheus documentation: [https://prometheus.io/docs/](https://prometheus.io/docs/)