> ## Documentation Index
> Fetch the complete documentation index at: https://notes.kodekloud.com/llms.txt
> Use this file to discover all available pages before exploring further.
# Introduction
> Explains Prometheus Pushgateway for capturing and exposing metrics from short lived batch jobs, including usage, endpoints, examples, and best practices.
In this lesson, we explain Prometheus Pushgateway and how it helps capture metrics from short-lived, ephemeral batch jobs that exit before Prometheus can scrape them.
Batch jobs that run briefly and then terminate are difficult for Prometheus to scrape because the process might have already exited when a scrape occurs. In that case, there is nothing for Prometheus to contact, and the job's metrics are effectively lost from the Prometheus scraping perspective.
The Pushgateway solves this by acting as an intermediary between ephemeral jobs and the Prometheus server. A batch job pushes its metrics to the Pushgateway before it exits. The Pushgateway stores those metrics and exposes them on an HTTP endpoint so Prometheus can scrape them like any other target.
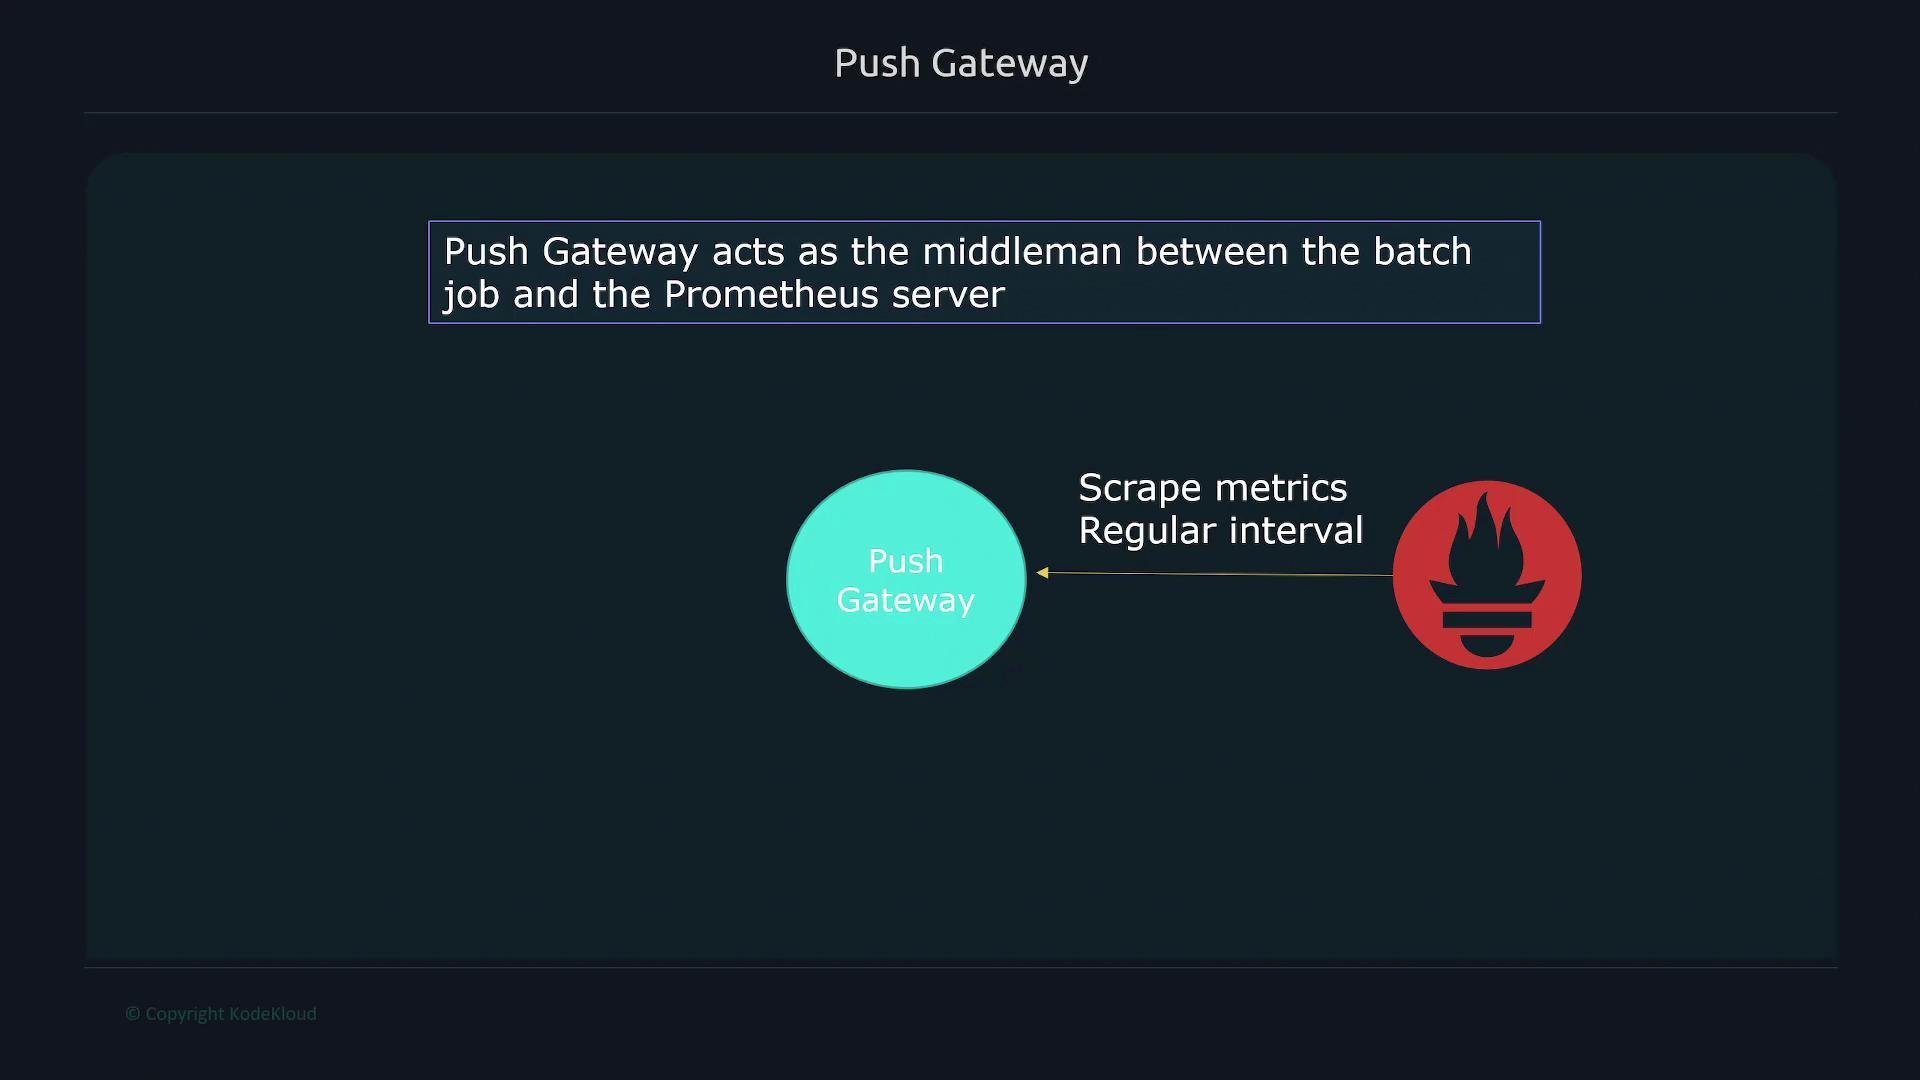 Prometheus treats the Pushgateway like any other scrape target: it scrapes the Pushgateway's `/metrics` endpoint on the configured schedule. Prometheus does not need to know that the metrics were pushed; it only consumes the metrics that the Pushgateway exposes.
Typical push flow:
* The job collects metrics while running.
* Before exiting, the job pushes those metrics to the Pushgateway.
* The Pushgateway stores and serves those metrics at `/metrics`.
* Prometheus scrapes the Pushgateway at its regular scrape interval.
Why use Pushgateway?
* Capture metrics from non-long-lived processes (batch jobs, one-off tasks).
* Decouple metric lifetime from job lifetime so Prometheus can scrape them at its schedule.
* Add grouping labels to distinguish pushes from multiple instances.
For more background, see the Prometheus documentation: [Pushgateway](https://prometheus.io/docs/practices/pushing/).
HTTP endpoints and common actions
| Action | URL path (example) | Description |
| ------------------------- | --------------------------------------------- | ------------------------------------------------------------------------------------- |
| Push metrics for a job | `/metrics/job/` | Push metrics for a job name. Use `POST`/`PUT` or `--data-binary` with `curl`. |
| Push with grouping labels | `/metrics/job//instance/` | Add grouping labels (e.g., `instance`, `id`) in the URL path to differentiate pushes. |
| Retrieve stored metrics | `/metrics` | Prometheus scrapes this endpoint to collect all stored metrics. |
| Delete metrics for a job | `/metrics/job/` (HTTP `DELETE`) | Remove stored metrics to avoid stale data. |
Example: push a local metrics file to the Pushgateway
```bash theme={null}
# Push a metrics file to the Pushgateway under job name "batch_job"
curl --data-binary @metrics.txt http://pushgateway:9091/metrics/job/batch_job
```
Example: include grouping labels in the push URL
```bash theme={null}
# Push a single metric with job and instance grouping labels
curl --data-binary 'my_metric 42' http://pushgateway:9091/metrics/job/batch_job/instance/instance1
```
Example: remove metrics for a job to avoid stale entries
```bash theme={null}
# Delete metrics for the job "batch_job"
curl -X DELETE http://pushgateway:9091/metrics/job/batch_job
```
Best practices and caveats
Use the Pushgateway primarily for short-lived, ephemeral jobs. The Pushgateway stores metrics until they are explicitly deleted or overwritten. If metrics are not removed or updated after a job completes, they can become stale and produce misleading results in Prometheus.
Additional tips:
* Prefer instrumenting long-lived services directly and let Prometheus scrape them.
* Use meaningful grouping labels in the URL path to avoid label collisions and to identify metric sources.
* Automate deletion of Pushgateway entries when jobs are complete, or implement a TTL/cleanup mechanism if appropriate.
* Monitor the Pushgateway itself as a scrape target to ensure it remains available for Prometheus to collect pushed metrics.
Prometheus treats the Pushgateway like any other scrape target: it scrapes the Pushgateway's `/metrics` endpoint on the configured schedule. Prometheus does not need to know that the metrics were pushed; it only consumes the metrics that the Pushgateway exposes.
Typical push flow:
* The job collects metrics while running.
* Before exiting, the job pushes those metrics to the Pushgateway.
* The Pushgateway stores and serves those metrics at `/metrics`.
* Prometheus scrapes the Pushgateway at its regular scrape interval.
Why use Pushgateway?
* Capture metrics from non-long-lived processes (batch jobs, one-off tasks).
* Decouple metric lifetime from job lifetime so Prometheus can scrape them at its schedule.
* Add grouping labels to distinguish pushes from multiple instances.
For more background, see the Prometheus documentation: [Pushgateway](https://prometheus.io/docs/practices/pushing/).
HTTP endpoints and common actions
| Action | URL path (example) | Description |
| ------------------------- | --------------------------------------------- | ------------------------------------------------------------------------------------- |
| Push metrics for a job | `/metrics/job/` | Push metrics for a job name. Use `POST`/`PUT` or `--data-binary` with `curl`. |
| Push with grouping labels | `/metrics/job//instance/` | Add grouping labels (e.g., `instance`, `id`) in the URL path to differentiate pushes. |
| Retrieve stored metrics | `/metrics` | Prometheus scrapes this endpoint to collect all stored metrics. |
| Delete metrics for a job | `/metrics/job/` (HTTP `DELETE`) | Remove stored metrics to avoid stale data. |
Example: push a local metrics file to the Pushgateway
```bash theme={null}
# Push a metrics file to the Pushgateway under job name "batch_job"
curl --data-binary @metrics.txt http://pushgateway:9091/metrics/job/batch_job
```
Example: include grouping labels in the push URL
```bash theme={null}
# Push a single metric with job and instance grouping labels
curl --data-binary 'my_metric 42' http://pushgateway:9091/metrics/job/batch_job/instance/instance1
```
Example: remove metrics for a job to avoid stale entries
```bash theme={null}
# Delete metrics for the job "batch_job"
curl -X DELETE http://pushgateway:9091/metrics/job/batch_job
```
Best practices and caveats
Use the Pushgateway primarily for short-lived, ephemeral jobs. The Pushgateway stores metrics until they are explicitly deleted or overwritten. If metrics are not removed or updated after a job completes, they can become stale and produce misleading results in Prometheus.
Additional tips:
* Prefer instrumenting long-lived services directly and let Prometheus scrape them.
* Use meaningful grouping labels in the URL path to avoid label collisions and to identify metric sources.
* Automate deletion of Pushgateway entries when jobs are complete, or implement a TTL/cleanup mechanism if appropriate.
* Monitor the Pushgateway itself as a scrape target to ensure it remains available for Prometheus to collect pushed metrics.