> ## Documentation Index
> Fetch the complete documentation index at: https://notes.kodekloud.com/llms.txt
> Use this file to discover all available pages before exploring further.
# Federation
> Explains Prometheus federation and recommends aggregating local metrics with recording rules and datacenter labels to avoid high cardinality and collisions while providing a global view
In this lesson we demonstrate Prometheus federation: how to aggregate metrics from multiple Prometheus servers (each responsible for a datacenter) into a single global Prometheus instance for a unified "single pane of glass".
Use case: you run one Prometheus per datacenter to keep scraping load local, but want a global view across datacenters without opening multiple UIs.
## Scenario overview
* Prometheus 1 — scrapes nodes in Datacenter 1.
* Prometheus 2 — scrapes nodes in Datacenter 2.
* Global Prometheus — federates aggregated metrics from Prometheus 1 and Prometheus 2 using the `/federate` endpoint.
Example configuration for Datacenter 1 (Prometheus 1)
```yaml theme={null}
# prometheus.yml (datacenter 1)
global:
scrape_interval: 15s
evaluation_interval: 15s
scrape_configs:
- job_name: "prometheus"
static_configs:
- targets: ["localhost:9090"]
labels:
app: "prometheus"
- job_name: "node"
static_configs:
- targets: ["192.168.64.8:9100", "192.168.64.8:9101"]
```
Example configuration for Datacenter 2 (Prometheus 2)
```yaml theme={null}
# prometheus.yml (datacenter 2)
global:
scrape_interval: 15s
evaluation_interval: 15s
scrape_configs:
- job_name: "prometheus"
static_configs:
- targets: ["localhost:9090"]
labels:
app: "prometheus"
- job_name: "node"
static_configs:
- targets: ["192.168.64.10:9100", "192.168.64.10:9101"]
```
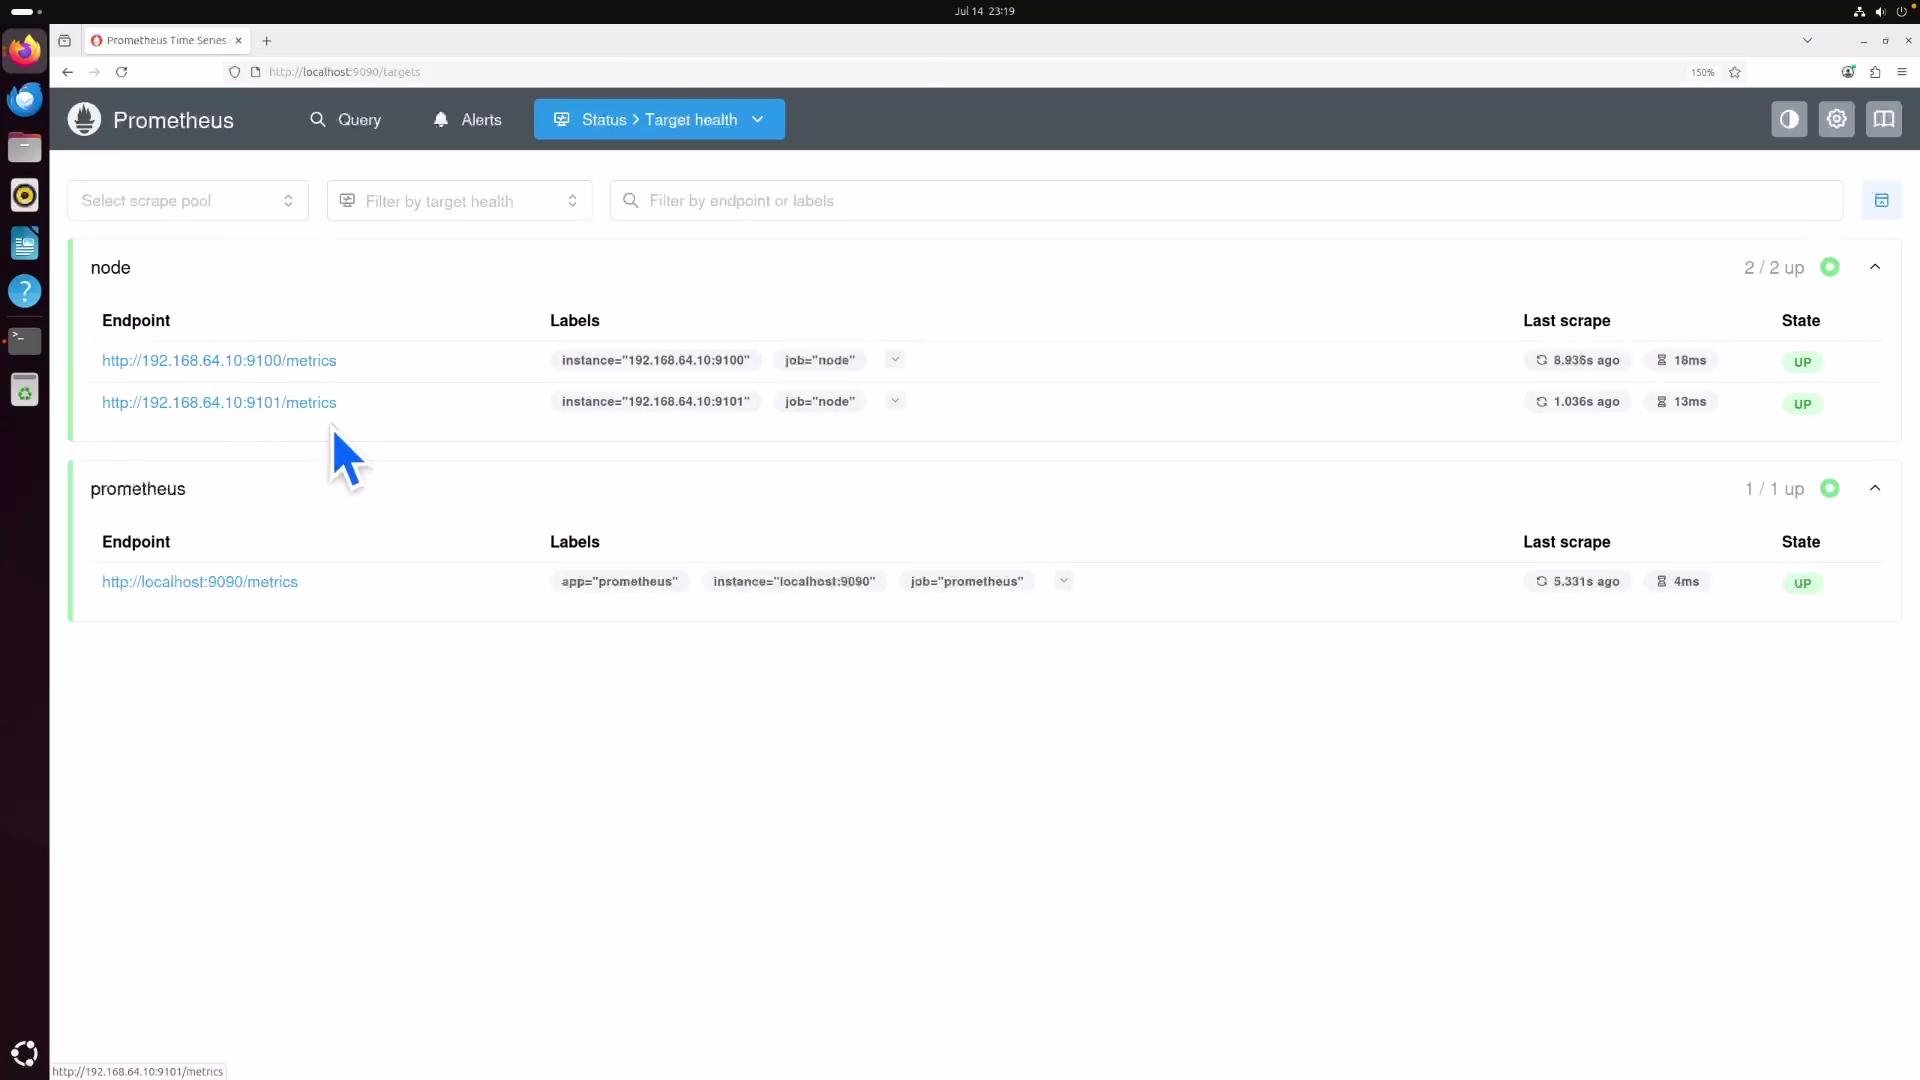
Both local Prometheus servers scrape only their local nodes. This pattern limits cross-datacenter network load and distributes scraping work.
You can verify each Prometheus is scraping its targets (example UI view):
 ## Problem: multiple UIs and potential overload
If you need to inspect metrics from many datacenters, opening each Prometheus UI is inconvenient. A global Prometheus can scrape the local Prometheus servers' federation endpoint (`/federate`) to provide a single view.
Initial global Prometheus scrape job for federation (example)
```yaml theme={null}
# prometheus.yml (global)
global:
scrape_interval: 15s
evaluation_interval: 15s
scrape_configs:
- job_name: "prometheus"
static_configs:
- targets: ["localhost:9090"]
labels:
app: "prometheus"
- job_name: "prometheus-federation"
metrics_path: "/federate"
honor_labels: true
params:
'match[]':
- '{job="node"}'
static_configs:
- targets: ["172.16.17.128:9090", "172.16.17.129:9090"]
```
This configuration instructs the global Prometheus to query each local Prometheus at `/federate` and request timeseries that match `job="node"`.
Querying the global Prometheus for a node metric (example UI):
## Problem: multiple UIs and potential overload
If you need to inspect metrics from many datacenters, opening each Prometheus UI is inconvenient. A global Prometheus can scrape the local Prometheus servers' federation endpoint (`/federate`) to provide a single view.
Initial global Prometheus scrape job for federation (example)
```yaml theme={null}
# prometheus.yml (global)
global:
scrape_interval: 15s
evaluation_interval: 15s
scrape_configs:
- job_name: "prometheus"
static_configs:
- targets: ["localhost:9090"]
labels:
app: "prometheus"
- job_name: "prometheus-federation"
metrics_path: "/federate"
honor_labels: true
params:
'match[]':
- '{job="node"}'
static_configs:
- targets: ["172.16.17.128:9090", "172.16.17.129:9090"]
```
This configuration instructs the global Prometheus to query each local Prometheus at `/federate` and request timeseries that match `job="node"`.
Querying the global Prometheus for a node metric (example UI):
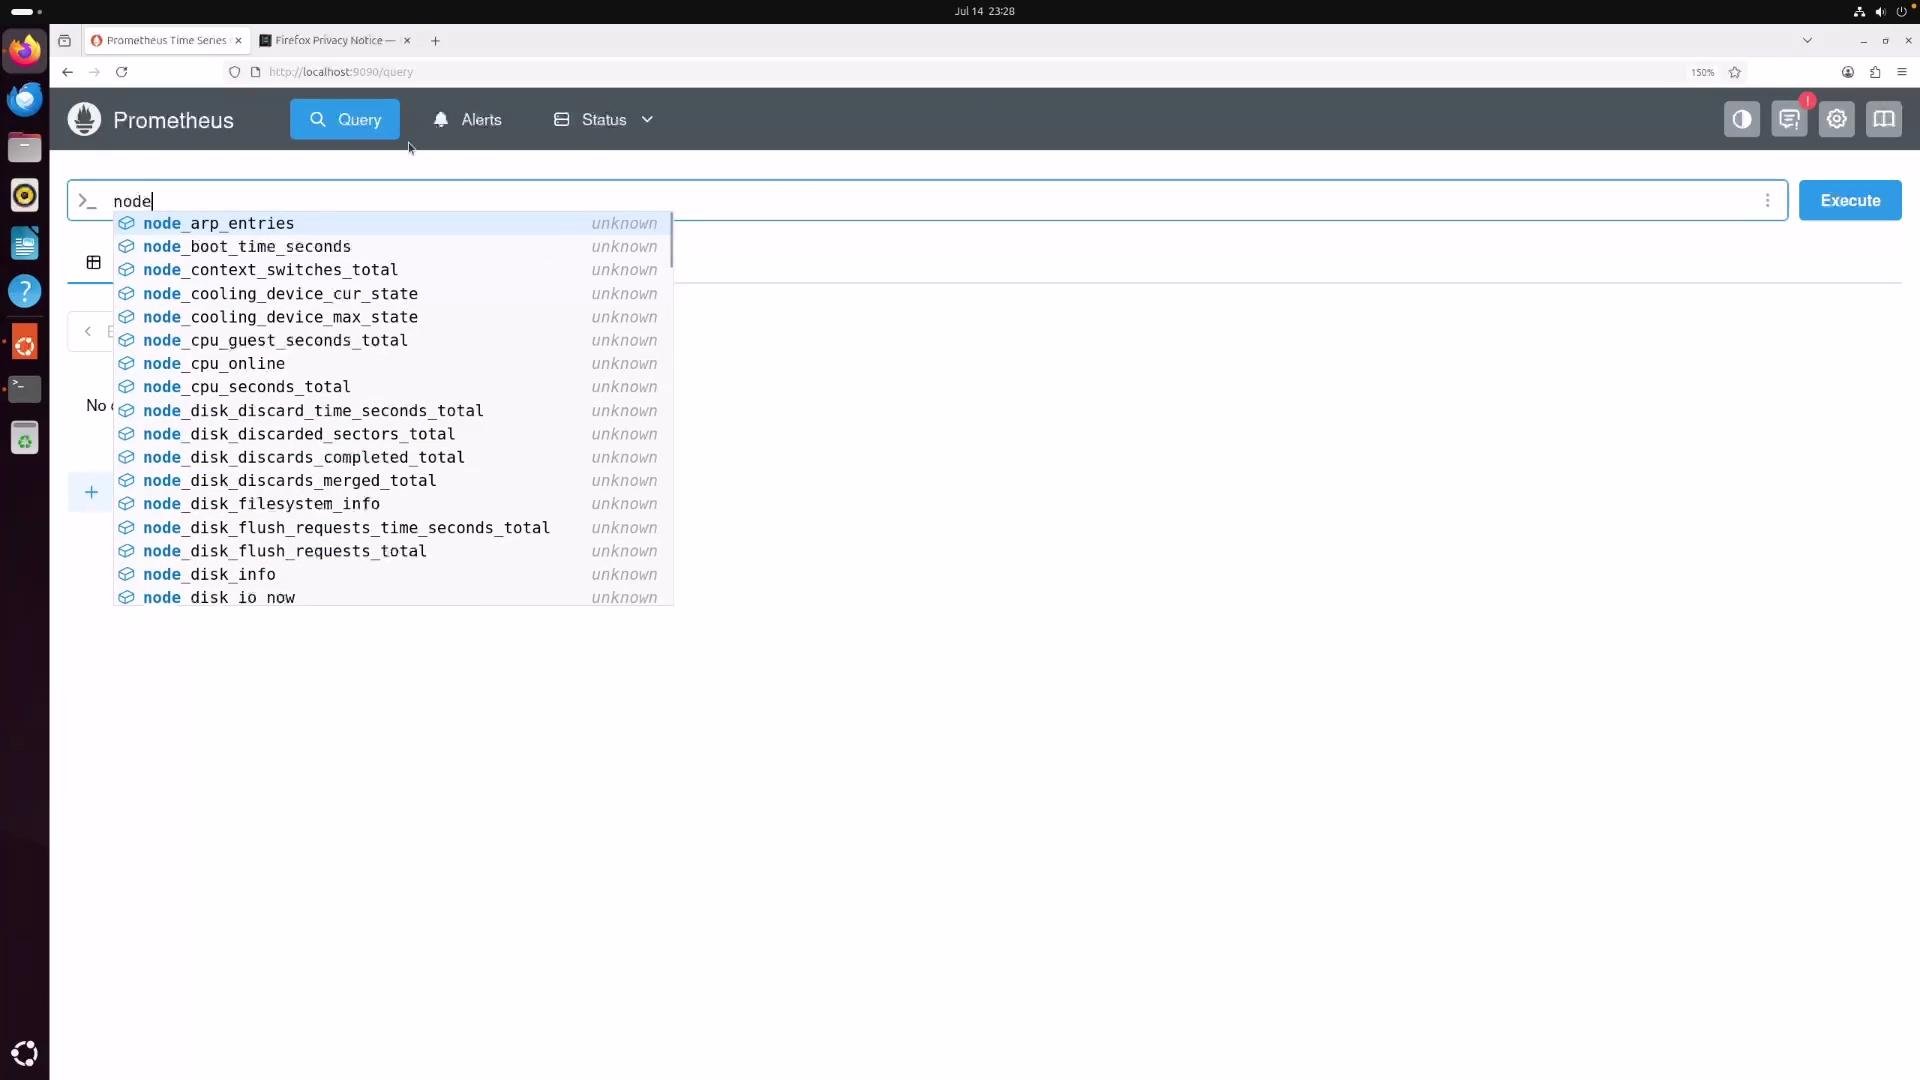 Example result returned by the global Prometheus after federation:
```Prometheus theme={null}
node_memory_MemAvailable_bytes{instance="192.168.64.10:9100", job="node"}
node_memory_MemAvailable_bytes{instance="192.168.64.10:9101", job="node"}
node_memory_MemAvailable_bytes{instance="192.168.64.8:9100", job="node"}
node_memory_MemAvailable_bytes{instance="192.168.64.8:9101", job="node"}
```
This shows timeseries from both datacenters are visible in the global Prometheus. However, federating instance-level metrics like these introduces important design risks.
## Why federating instance-level metrics is dangerous
* High cardinality: sending every node/instance metric to a central Prometheus multiplies label combinations and can overwhelm the server.
* Duplicate metric collisions: if multiple sources expose the same metric name and identical label sets (e.g., `job="node"`), the global Prometheus may receive samples with the same metric+labels and identical timestamps but different values. Prometheus treats this as conflicting samples and drops them, logging errors.
Example of ingestion error logs (cleaned):
```plaintext theme={null}
time=2025-07-14T23:36:41.358Z level=INFO source=checkpoints.go:192 msg="Error on ingesting samples with different value but same timestamp" component="scrape manager" scrape_pool=prometheus-federation
time=2025-07-14T23:36:41.358Z level=WARN source=scrape.go:1096 msg="Error on ingesting samples with different value but same timestamp" component="scrape manager" scrape_pool=prometheus-federation target="http://172.16.17.129:9090/federate?match%3D%7B__name%3D~" num_dropped=2
```
If the same metric name and label set are produced by multiple sources, Prometheus can reject samples with identical timestamps but differing values. This commonly occurs when federating raw instance-level metrics.
Best practice: Do not federate high-cardinality, instance-level metrics to a single global Prometheus. Instead, federate aggregated, lower-cardinality metrics computed locally (recording rules) and include a distinguishing label (for example `datacenter="dc1"`).
## Solution: aggregate locally with recording rules and add a datacenter label
1. On each local Prometheus, define recording rules that aggregate instance-level series (sums, rates, etc.).
2. Add a `datacenter` label to those recorded metrics to identify their origin.
3. Configure the global Prometheus to federate only those recorded (aggregated) metric names.
Example recording rules file (rules.yaml) — Datacenter 1
```yaml theme={null}
groups:
- name: aggregated-node-metrics
rules:
- record: node:cpu_seconds:sum_rate5m
expr: sum(rate(node_cpu_seconds_total[5m])) by (job)
labels:
datacenter: "dc1"
- record: node:memory_MemAvailable_bytes:sum
expr: sum(node_memory_MemAvailable_bytes) by (job)
labels:
datacenter: "dc1"
```
For Datacenter 2, create the same rules but set `datacenter: "dc2"`.
Include the rules file in each local Prometheus configuration:
```yaml theme={null}
# prometheus.yml (datacenter 1) - include recorded rules
rule_files:
- "rules.yaml"
```
Restart the local Prometheus servers so they evaluate the recording rules and publish the aggregated metrics. Each local Prometheus will now expose recorded metrics such as:
```PromQL theme={null}
node:cpu_seconds:sum_rate5m{job="node", datacenter="dc1"}
node:memory_MemAvailable_bytes:sum{job="node", datacenter="dc1"}
```
Adjust the global Prometheus federation scrape to request only the recorded metric names:
```yaml theme={null}
# prometheus.yml (global) - federate only aggregated metric names
scrape_configs:
- job_name: "prometheus-federation"
metrics_path: "/federate"
honor_labels: true
params:
'match[]':
- '{__name__="node:cpu_seconds:sum_rate5m"}'
- '{__name__="node:memory_MemAvailable_bytes:sum"}'
static_configs:
- targets: ["172.16.17.128:9090", "172.16.17.129:9090"]
```
With this setup:
* Local Prometheus instances compute aggregated metrics and attach a `datacenter` label.
* The global Prometheus federates only aggregated metrics (low cardinality).
* The `datacenter` label distinguishes origins and prevents ingestion conflicts.
Example query on the global Prometheus, asking for memory available from datacenter 2:
```PromQL theme={null}
node:memory_MemAvailable_bytes:sum{datacenter="dc2", job="node"}
```
Example returned value:
```text theme={null}
158975425656
```
## Quick reference: federation do's and don'ts
| Action | Recommendation | Example / Note |
| ------------------------------- | -------------- | --------------------------------------------------------------------------------------------------------------------------- |
| Federate instance-level metrics | Don't | Avoid federating `node_*` per-instance series in bulk. |
| Federate aggregated metrics | Do | Record aggregation locally, e.g. `node:memory_MemAvailable_bytes:sum`. |
| Distinguish origin | Do | Add `datacenter: "dc1"` as a label on recorded rules. |
| Global match filters | Use | In global `params.match[]` request only recorded metric names, e.g. `'{__name__="node:cpu_seconds:sum_rate5m"}'`. |
| Prevent collisions | Use | Ensure global Prometheus never receives identical metric+label combinations from different sources without an origin label. |
## Summary: recommended workflow
1. Keep local scraping per datacenter for instance-level metrics.
2. Create recording rules locally that aggregate instance-level metrics and add a `datacenter` label.
3. Federate only the aggregated recorded metrics to the global Prometheus.
4. Query the global Prometheus for datacenter-level metrics to get a single pane of glass without overwhelming it.
## Links and references
* Prometheus federation docs: [https://prometheus.io/docs/prometheus/latest/federation/](https://prometheus.io/docs/prometheus/latest/federation/)
* Prometheus recording rules: [https://prometheus.io/docs/practices/rules/](https://prometheus.io/docs/practices/rules/)
* Prometheus best practices (scalability & federation): [https://prometheus.io/docs/introduction/overview/](https://prometheus.io/docs/introduction/overview/)
Example result returned by the global Prometheus after federation:
```Prometheus theme={null}
node_memory_MemAvailable_bytes{instance="192.168.64.10:9100", job="node"}
node_memory_MemAvailable_bytes{instance="192.168.64.10:9101", job="node"}
node_memory_MemAvailable_bytes{instance="192.168.64.8:9100", job="node"}
node_memory_MemAvailable_bytes{instance="192.168.64.8:9101", job="node"}
```
This shows timeseries from both datacenters are visible in the global Prometheus. However, federating instance-level metrics like these introduces important design risks.
## Why federating instance-level metrics is dangerous
* High cardinality: sending every node/instance metric to a central Prometheus multiplies label combinations and can overwhelm the server.
* Duplicate metric collisions: if multiple sources expose the same metric name and identical label sets (e.g., `job="node"`), the global Prometheus may receive samples with the same metric+labels and identical timestamps but different values. Prometheus treats this as conflicting samples and drops them, logging errors.
Example of ingestion error logs (cleaned):
```plaintext theme={null}
time=2025-07-14T23:36:41.358Z level=INFO source=checkpoints.go:192 msg="Error on ingesting samples with different value but same timestamp" component="scrape manager" scrape_pool=prometheus-federation
time=2025-07-14T23:36:41.358Z level=WARN source=scrape.go:1096 msg="Error on ingesting samples with different value but same timestamp" component="scrape manager" scrape_pool=prometheus-federation target="http://172.16.17.129:9090/federate?match%3D%7B__name%3D~" num_dropped=2
```
If the same metric name and label set are produced by multiple sources, Prometheus can reject samples with identical timestamps but differing values. This commonly occurs when federating raw instance-level metrics.
Best practice: Do not federate high-cardinality, instance-level metrics to a single global Prometheus. Instead, federate aggregated, lower-cardinality metrics computed locally (recording rules) and include a distinguishing label (for example `datacenter="dc1"`).
## Solution: aggregate locally with recording rules and add a datacenter label
1. On each local Prometheus, define recording rules that aggregate instance-level series (sums, rates, etc.).
2. Add a `datacenter` label to those recorded metrics to identify their origin.
3. Configure the global Prometheus to federate only those recorded (aggregated) metric names.
Example recording rules file (rules.yaml) — Datacenter 1
```yaml theme={null}
groups:
- name: aggregated-node-metrics
rules:
- record: node:cpu_seconds:sum_rate5m
expr: sum(rate(node_cpu_seconds_total[5m])) by (job)
labels:
datacenter: "dc1"
- record: node:memory_MemAvailable_bytes:sum
expr: sum(node_memory_MemAvailable_bytes) by (job)
labels:
datacenter: "dc1"
```
For Datacenter 2, create the same rules but set `datacenter: "dc2"`.
Include the rules file in each local Prometheus configuration:
```yaml theme={null}
# prometheus.yml (datacenter 1) - include recorded rules
rule_files:
- "rules.yaml"
```
Restart the local Prometheus servers so they evaluate the recording rules and publish the aggregated metrics. Each local Prometheus will now expose recorded metrics such as:
```PromQL theme={null}
node:cpu_seconds:sum_rate5m{job="node", datacenter="dc1"}
node:memory_MemAvailable_bytes:sum{job="node", datacenter="dc1"}
```
Adjust the global Prometheus federation scrape to request only the recorded metric names:
```yaml theme={null}
# prometheus.yml (global) - federate only aggregated metric names
scrape_configs:
- job_name: "prometheus-federation"
metrics_path: "/federate"
honor_labels: true
params:
'match[]':
- '{__name__="node:cpu_seconds:sum_rate5m"}'
- '{__name__="node:memory_MemAvailable_bytes:sum"}'
static_configs:
- targets: ["172.16.17.128:9090", "172.16.17.129:9090"]
```
With this setup:
* Local Prometheus instances compute aggregated metrics and attach a `datacenter` label.
* The global Prometheus federates only aggregated metrics (low cardinality).
* The `datacenter` label distinguishes origins and prevents ingestion conflicts.
Example query on the global Prometheus, asking for memory available from datacenter 2:
```PromQL theme={null}
node:memory_MemAvailable_bytes:sum{datacenter="dc2", job="node"}
```
Example returned value:
```text theme={null}
158975425656
```
## Quick reference: federation do's and don'ts
| Action | Recommendation | Example / Note |
| ------------------------------- | -------------- | --------------------------------------------------------------------------------------------------------------------------- |
| Federate instance-level metrics | Don't | Avoid federating `node_*` per-instance series in bulk. |
| Federate aggregated metrics | Do | Record aggregation locally, e.g. `node:memory_MemAvailable_bytes:sum`. |
| Distinguish origin | Do | Add `datacenter: "dc1"` as a label on recorded rules. |
| Global match filters | Use | In global `params.match[]` request only recorded metric names, e.g. `'{__name__="node:cpu_seconds:sum_rate5m"}'`. |
| Prevent collisions | Use | Ensure global Prometheus never receives identical metric+label combinations from different sources without an origin label. |
## Summary: recommended workflow
1. Keep local scraping per datacenter for instance-level metrics.
2. Create recording rules locally that aggregate instance-level metrics and add a `datacenter` label.
3. Federate only the aggregated recorded metrics to the global Prometheus.
4. Query the global Prometheus for datacenter-level metrics to get a single pane of glass without overwhelming it.
## Links and references
* Prometheus federation docs: [https://prometheus.io/docs/prometheus/latest/federation/](https://prometheus.io/docs/prometheus/latest/federation/)
* Prometheus recording rules: [https://prometheus.io/docs/practices/rules/](https://prometheus.io/docs/practices/rules/)
* Prometheus best practices (scalability & federation): [https://prometheus.io/docs/introduction/overview/](https://prometheus.io/docs/introduction/overview/)