> ## Documentation Index
> Fetch the complete documentation index at: https://notes.kodekloud.com/llms.txt
> Use this file to discover all available pages before exploring further.
# Long Term Storage
> Guide to Prometheus long-term storage covering local TSDB structure, retention tuning, capacity planning, remote read/write, and using long-term systems like Thanos and Grafana Mimir.
In this guide we cover Prometheus long-term storage: how Prometheus stores time series locally, how to tune retention, how to plan capacity, and how to move data off the local disk using remote read/write or long-term storage systems (Thanos, Grafana Mimir, etc.).
Prometheus writes collected samples into a block-based TSDB on local storage. Blocks are created every two hours by default and stored on the server where Prometheus runs. You can customize the directory Prometheus uses with the `--storage.tsdb.path` flag:
```bash theme={null}
--storage.tsdb.path /data
```
A Prometheus data directory typically contains multiple two-hour blocks. Each block contains subcomponents such as `chunks` (the actual compressed metrics), an `index` (for metric names and label lookups), `meta.json`, and optional WAL/checkpoint files:
```bash theme={null}
./data
├── 01BKGV7JBM69T2G1BG6BGM6KB12
│ ├── meta.json
│ └── 01BKGTZQ1SYQJTR4P43C8PD98
│ ├── chunks
│ │ └── 000001
│ ├── tombstones
│ ├── index
│ └── meta.json
├── 01BKGTZQ1HHV8FBJXW1Y3W0K
│ └── meta.json
└── 01BKGV7JC0RYB86MACW02A2PJDJ
├── chunks
│ └── 000001
├── tombstones
├── index
└── meta.json
├── chunks_head
│ └── 000001
└── wal
├── 00000002
├── checkpoint.000001
└── 00000000
```
* `chunks`: compressed time series samples.
* `index`: label and metric name indexes for fast lookups inside the block.
* `meta.json`: block metadata (time ranges, version, etc.).
* `tombstones`: records of deleted series.
* `wal` and `chunks_head`: write-ahead log and in-progress chunk data.
Callout about retention defaults and tuning:
Prometheus stores recent data on local disk by default. Tune retention by time (`--storage.tsdb.retention.time`) or by size (`--storage.tsdb.retention.size`) depending on whether you want to limit based on age or storage consumption.
## Retention: defaults and flags
By default Prometheus keeps approximately 15 days of samples locally and a retention size of 10 GB. You can change these defaults:
* Retention time:
```bash theme={null}
--storage.tsdb.retention.time=15d
```
* Retention size:
```bash theme={null}
--storage.tsdb.retention.size=10G
```
Use either time or size (or both). When a limit is reached, the oldest blocks are deleted.
Table: common TSDB flags and examples
| Flag | Purpose | Default | Example |
| ------------------------------- | ---------------------------- | ------------- | ----------------------------------- |
| `--storage.tsdb.path` | Path for Prometheus TSDB | `/prometheus` | `--storage.tsdb.path=/data` |
| `--storage.tsdb.retention.time` | Maximum age of data to keep | `15d` | `--storage.tsdb.retention.time=30d` |
| `--storage.tsdb.retention.size` | Maximum storage size to keep | `10G` | `--storage.tsdb.retention.size=50G` |
Warning about retention and disk usage:
If retention flags are not configured according to your ingestion rate, Prometheus may delete data unexpectedly or exhaust disk space. Always plan capacity and monitor disk usage.
## Capacity planning
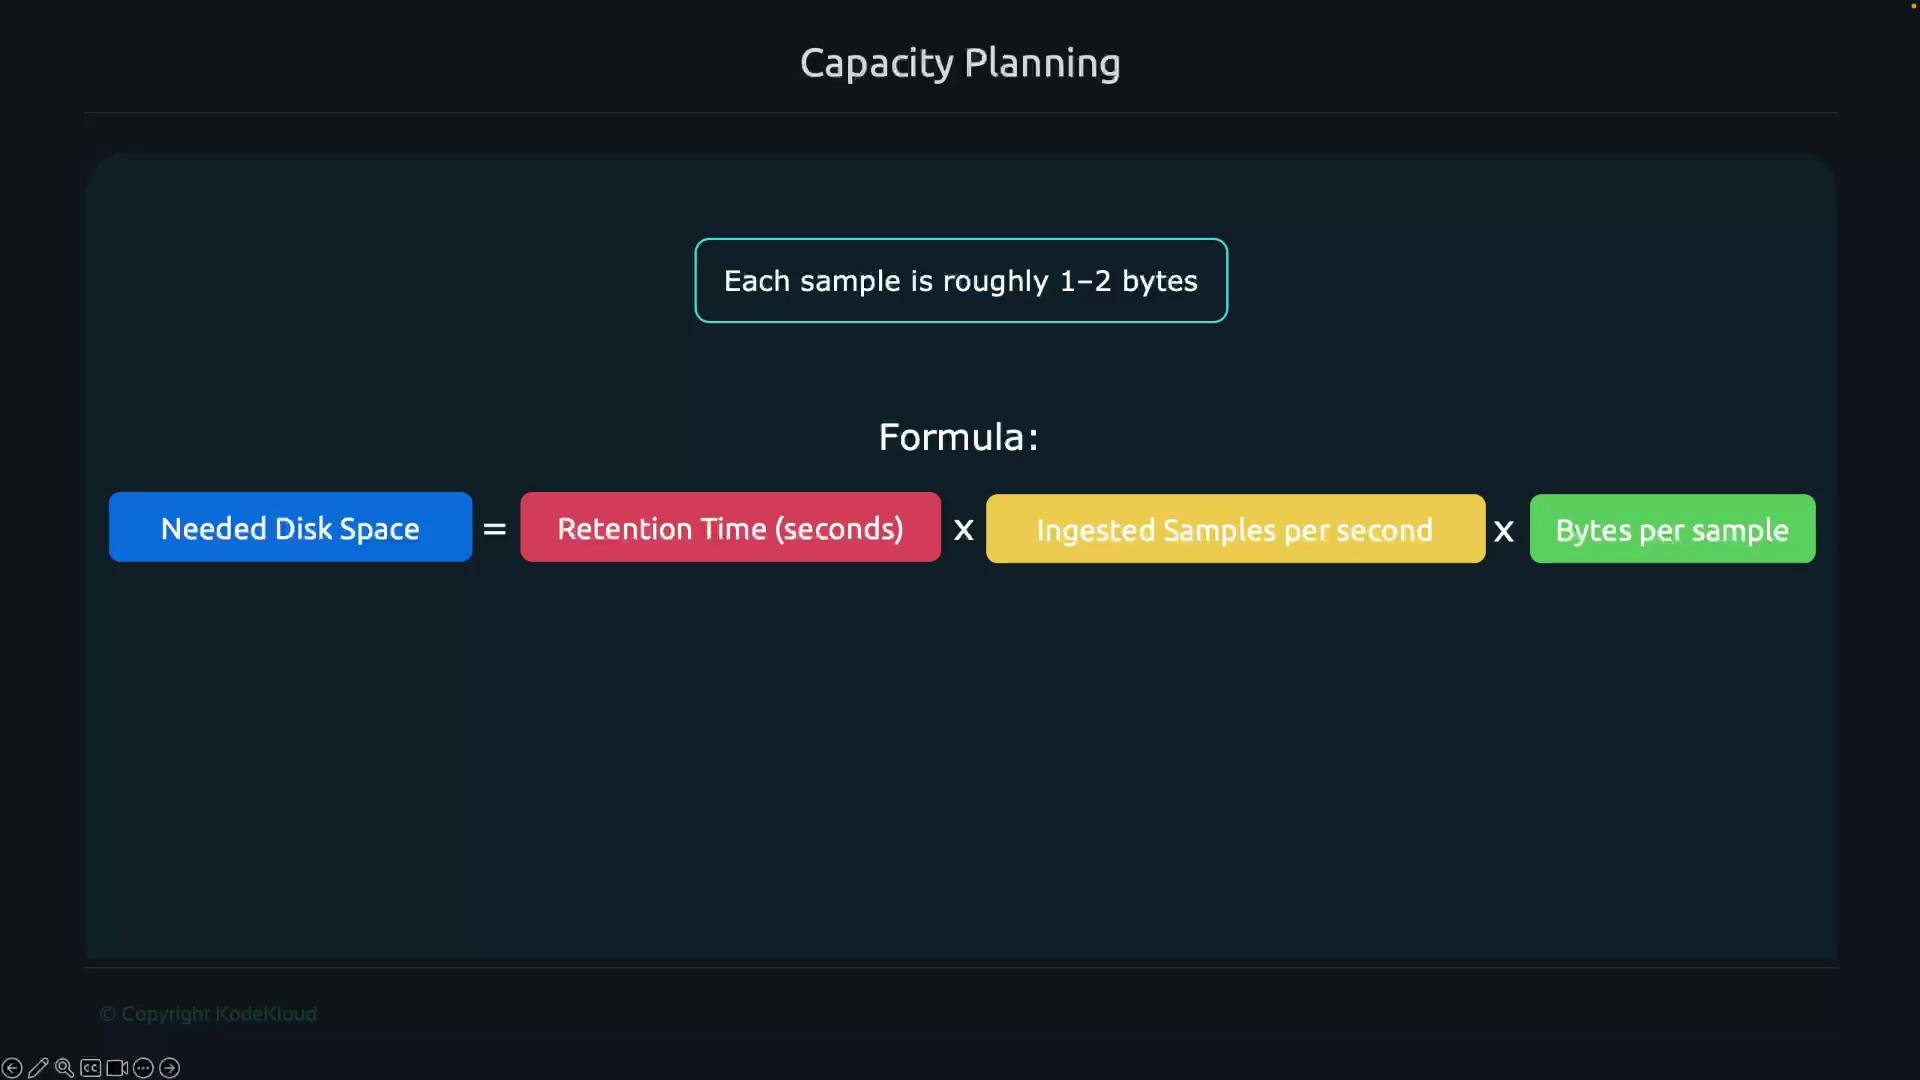
Estimate disk space needed using this formula:
disk required = retention time (seconds) × ingested samples per second × bytes per sample
* A Prometheus sample typically ranges from \~1–2 bytes for compacted storage, but real-world bytes per sample vary based on label cardinality and compression.
* For accurate planning, measure your average samples/sec and bytes/sample during representative load.
 ## Why local storage doesn’t scale for long-term retention
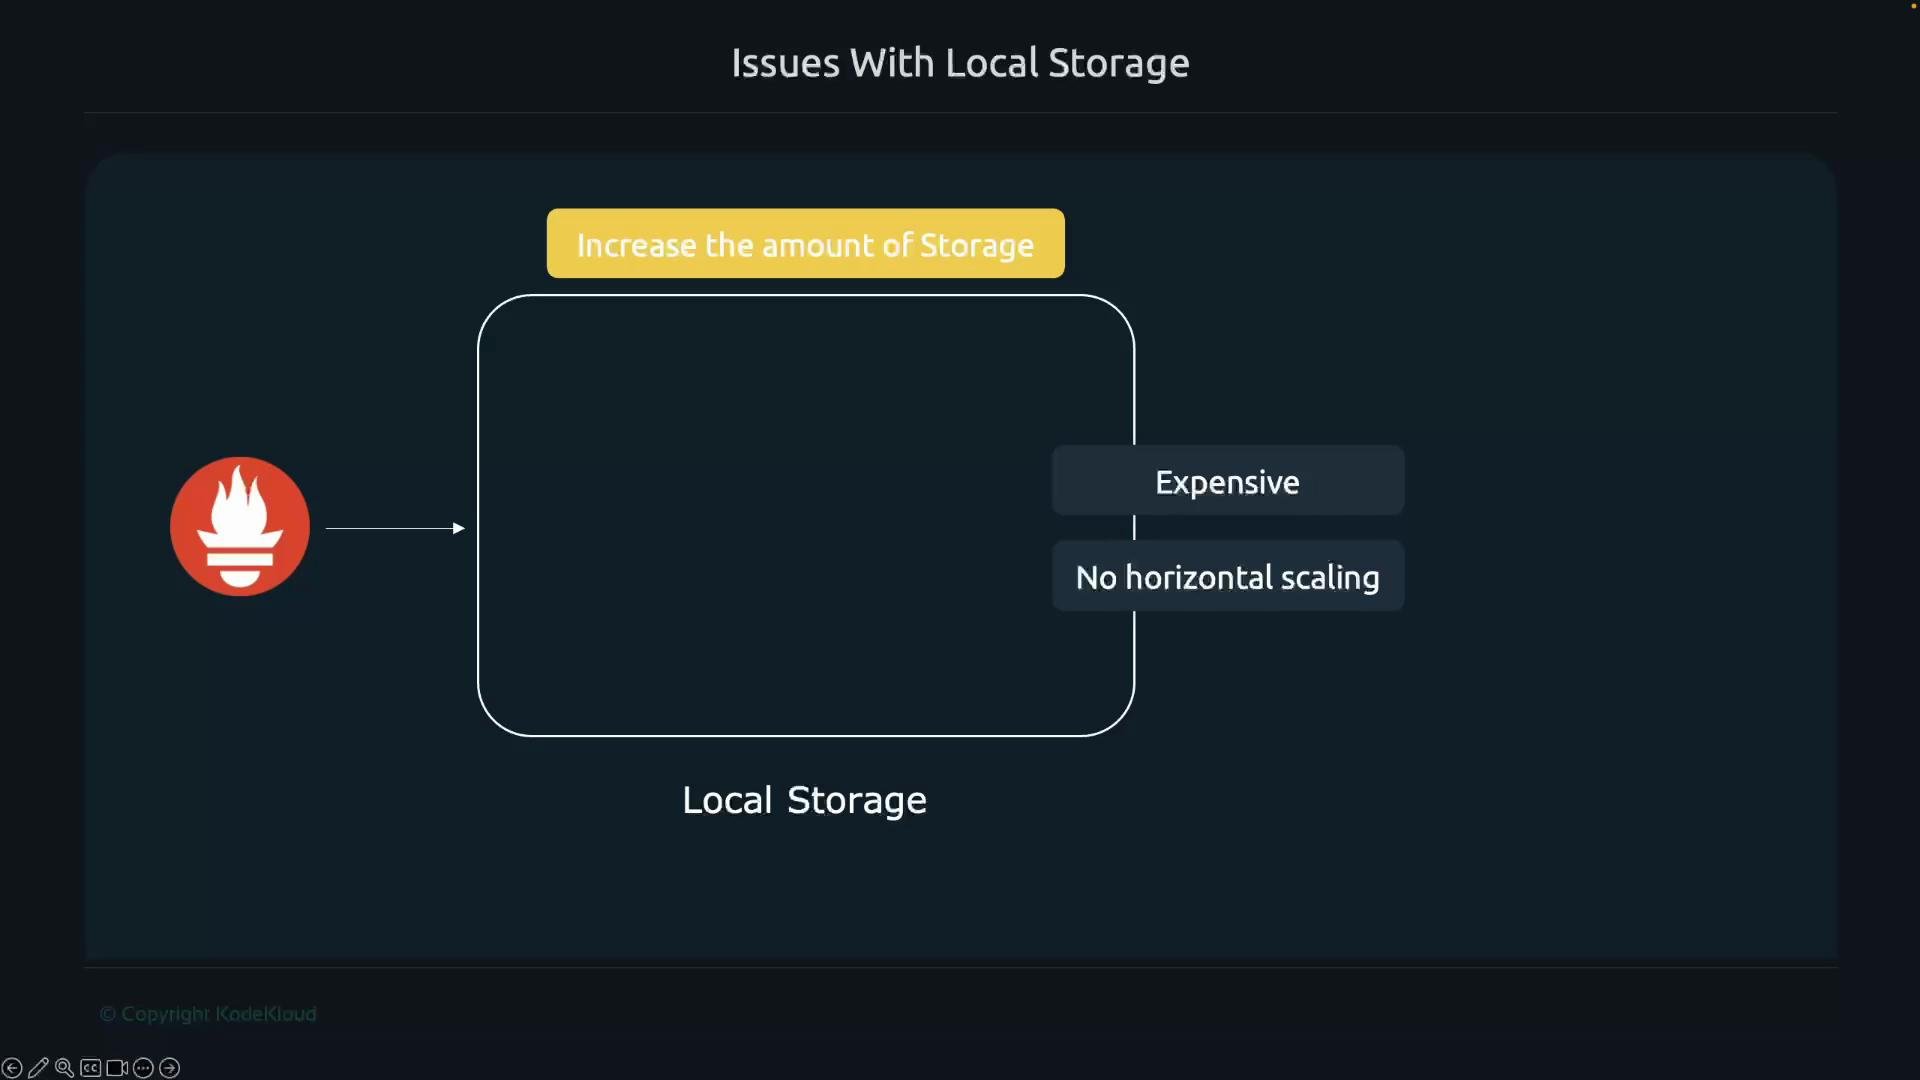
The simplest way to retain data longer is to attach more block-style disk to the Prometheus server. However:
* Block storage can be expensive at scale.
* Prometheus’ TSDB is designed to write to a single local path; it does not horizontally distribute block storage across multiple Prometheus instances.
These limitations make local-only retention impractical and costly for multi-year storage.
## Why local storage doesn’t scale for long-term retention
The simplest way to retain data longer is to attach more block-style disk to the Prometheus server. However:
* Block storage can be expensive at scale.
* Prometheus’ TSDB is designed to write to a single local path; it does not horizontally distribute block storage across multiple Prometheus instances.
These limitations make local-only retention impractical and costly for multi-year storage.
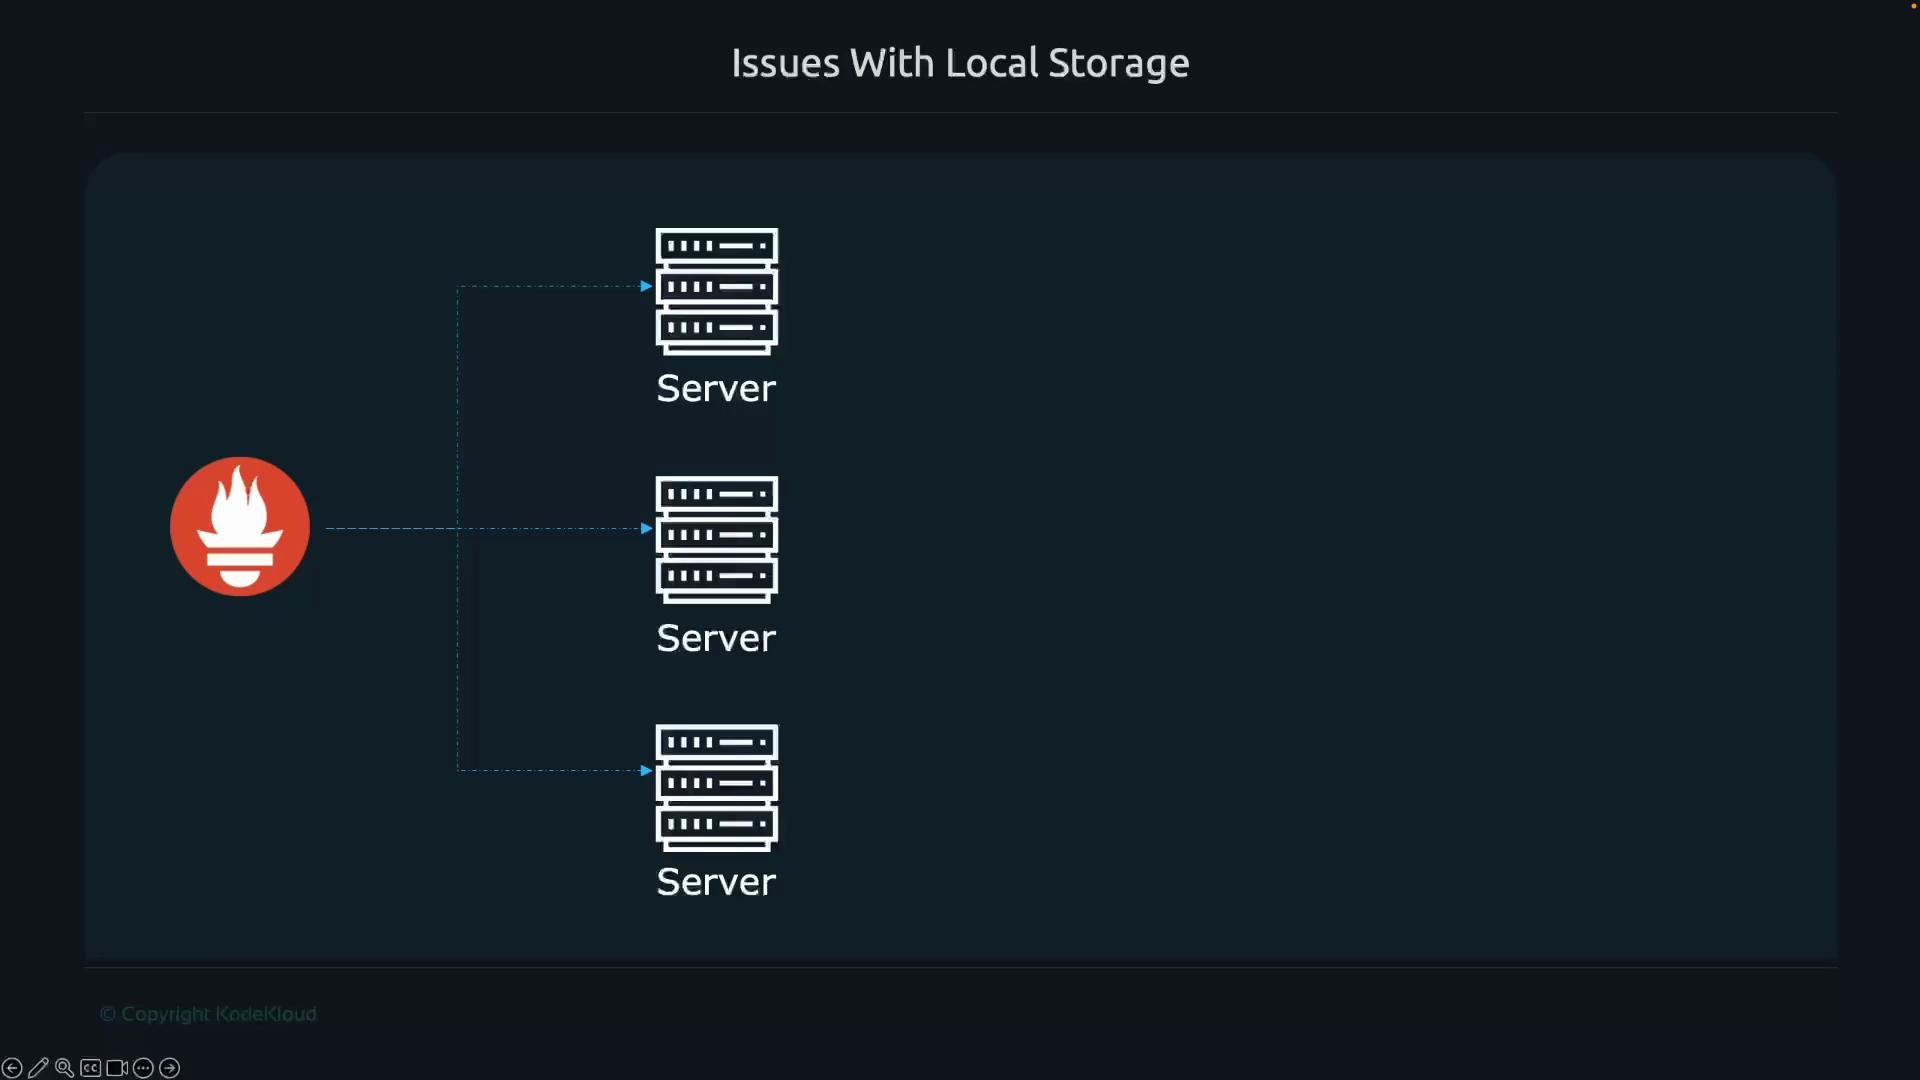
 Prometheus expects to write to one location and does not natively shard block storage across servers:
 ## Remote Read and Remote Write
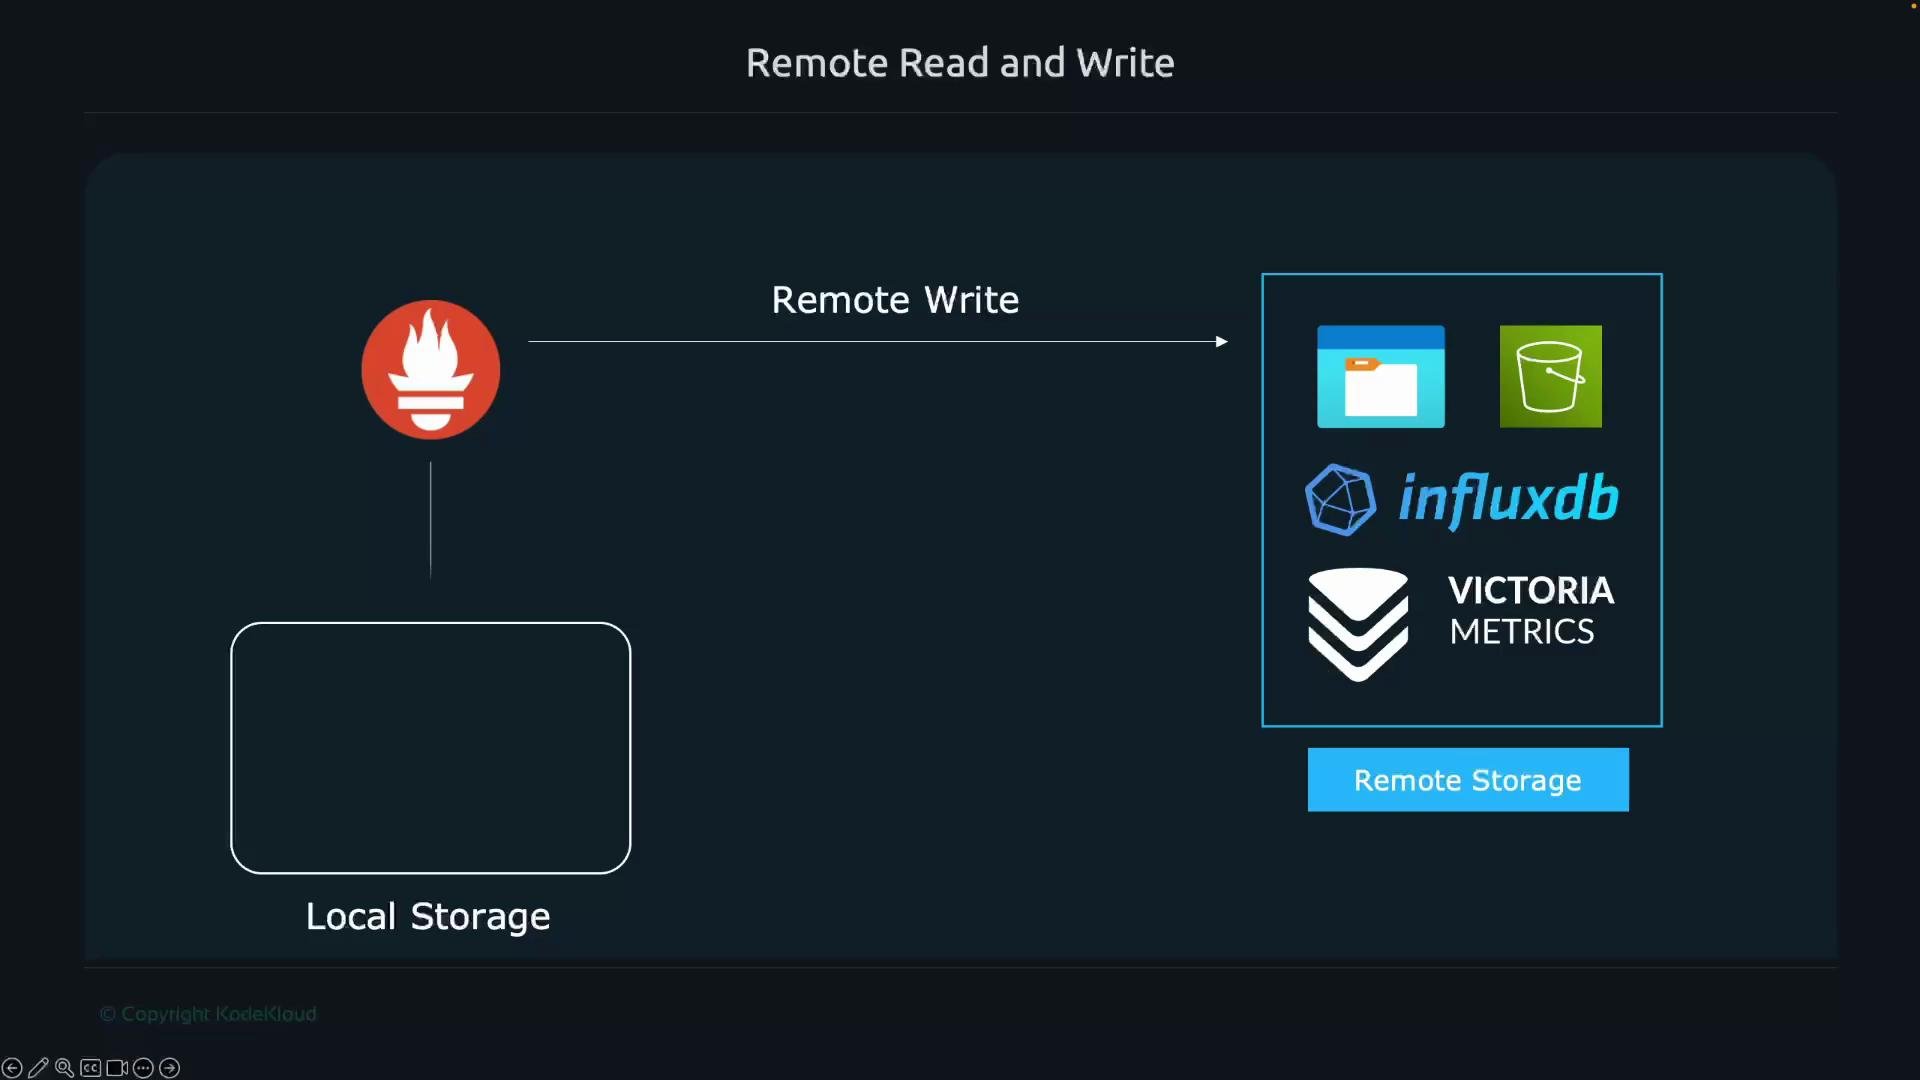
To avoid the costs and limits of local block storage, Prometheus supports:
* remote\_write — stream samples to a remote system or long-term storage.
* remote\_read — query historical data from a remote store.
This allows you to push metrics to object storage (S3, Azure Blob), or to scalable TSDB systems (InfluxDB, VictoriaMetrics, Thanos, Grafana Mimir).
Example remote write/read configuration (Prometheus YAML):
```yaml theme={null}
remote_write:
- url: https://some-url.com/api/prom/push
write_relabel_configs:
- action: keep
source_labels: [ "team" ]
regex: 'frontend'
remote_read:
- url: http://some-url.com:1234/read
```
## Remote Read and Remote Write
To avoid the costs and limits of local block storage, Prometheus supports:
* remote\_write — stream samples to a remote system or long-term storage.
* remote\_read — query historical data from a remote store.
This allows you to push metrics to object storage (S3, Azure Blob), or to scalable TSDB systems (InfluxDB, VictoriaMetrics, Thanos, Grafana Mimir).
Example remote write/read configuration (Prometheus YAML):
```yaml theme={null}
remote_write:
- url: https://some-url.com/api/prom/push
write_relabel_configs:
- action: keep
source_labels: [ "team" ]
regex: 'frontend'
remote_read:
- url: http://some-url.com:1234/read
```
 Remote write can be combined with relabeling (`write_relabel_configs`) to reduce cardinality or route specific metrics to particular remote systems.
## Long-term storage systems (Thanos, Grafana Mimir, etc.)
Many open-source and commercial tools exist to provide cost-effective long-term storage for Prometheus data. These systems typically:
* Receive replicated data via `remote_write` or ingest Prometheus blocks.
* Store compacted data in cheap object stores (S3, Azure Blob).
* Offer queriable APIs that Prometheus or external query layers can use.
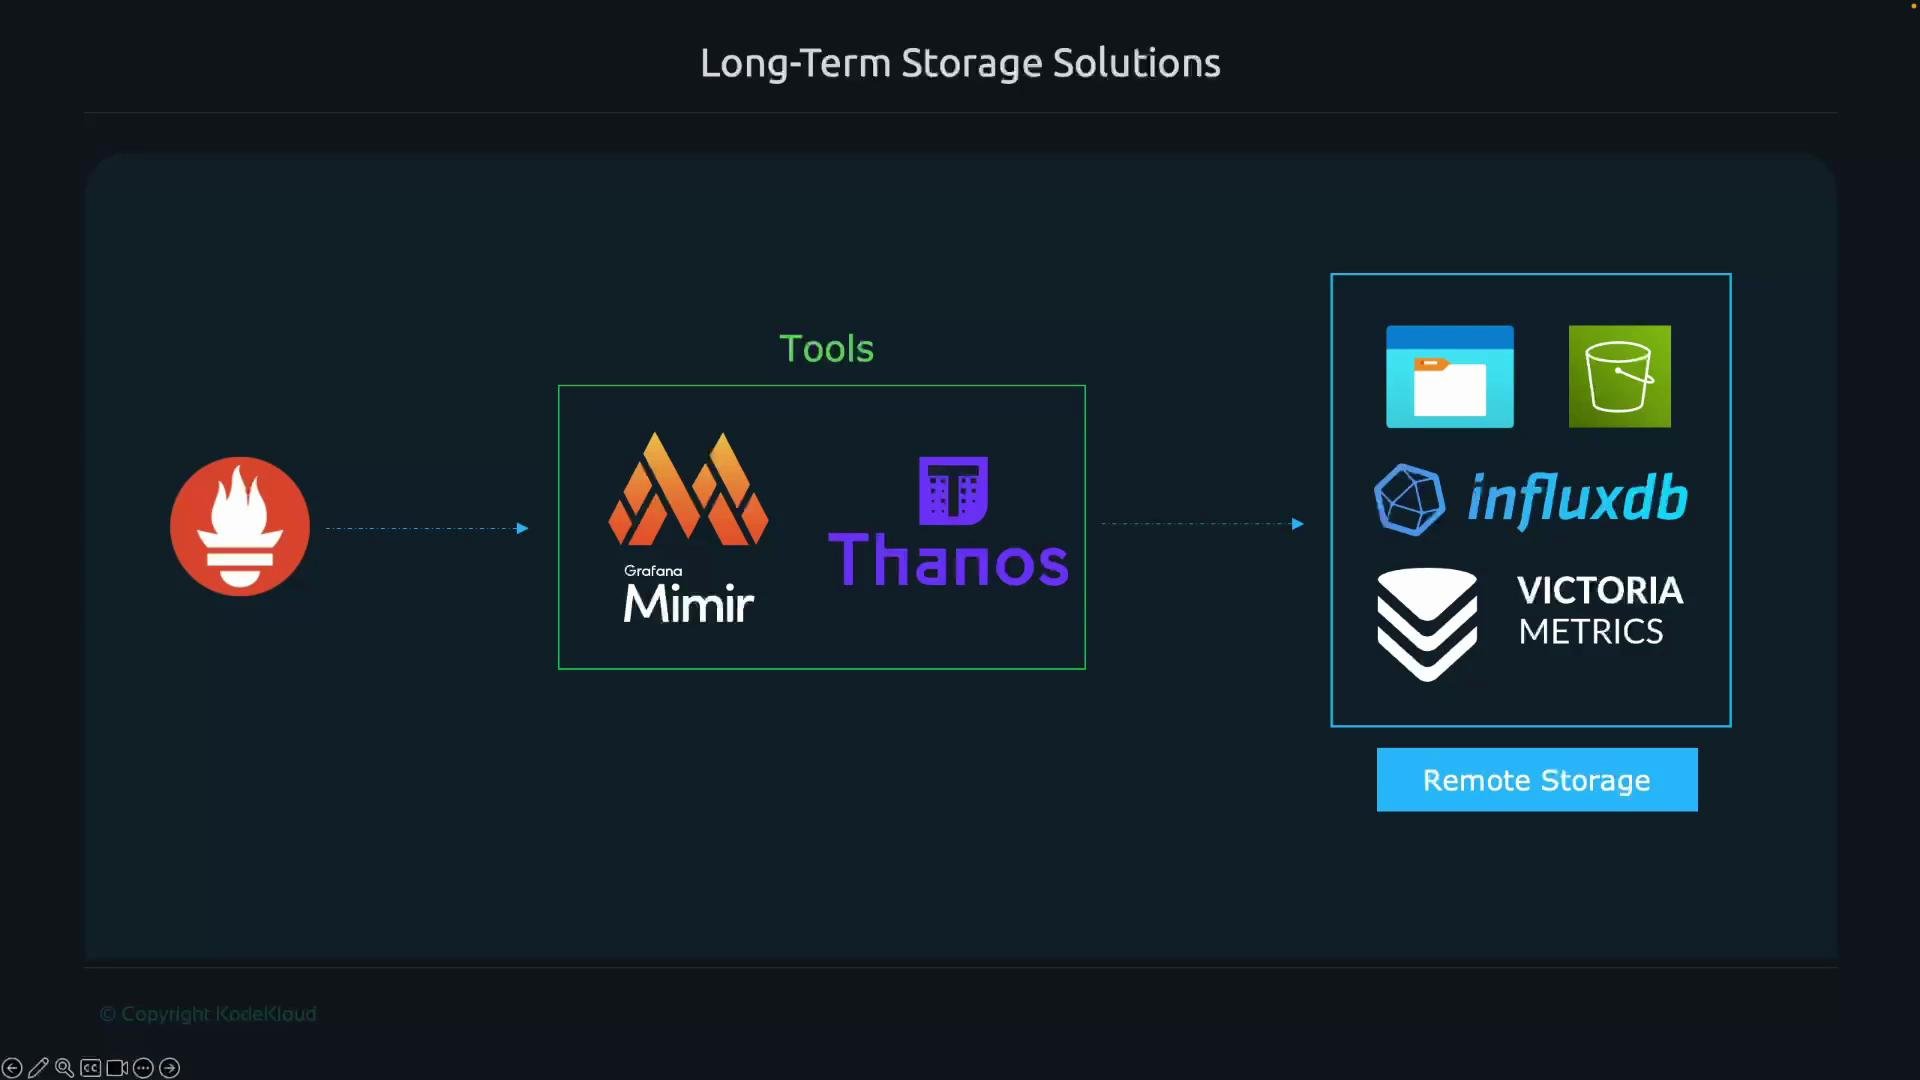
Popular systems include Thanos and Grafana Mimir, and other TSDBs like VictoriaMetrics or InfluxDB are commonly used for long-term retention.
Remote write can be combined with relabeling (`write_relabel_configs`) to reduce cardinality or route specific metrics to particular remote systems.
## Long-term storage systems (Thanos, Grafana Mimir, etc.)
Many open-source and commercial tools exist to provide cost-effective long-term storage for Prometheus data. These systems typically:
* Receive replicated data via `remote_write` or ingest Prometheus blocks.
* Store compacted data in cheap object stores (S3, Azure Blob).
* Offer queriable APIs that Prometheus or external query layers can use.
Popular systems include Thanos and Grafana Mimir, and other TSDBs like VictoriaMetrics or InfluxDB are commonly used for long-term retention.
 Note for certification or overview-level knowledge:
For exams or conceptual understanding, you only need to know that tools like Thanos and Grafana Mimir exist to provide long-term, cost-effective storage for Prometheus metrics. Deep internals of those systems are not required for basic certification-level knowledge.
## Links and references
* Prometheus TSDB flags and command-line options: [https://prometheus.io/docs/prometheus/latest/command-line/flags/](https://prometheus.io/docs/prometheus/latest/command-line/flags/)
* Amazon S3: [https://aws.amazon.com/s3/](https://aws.amazon.com/s3/)
* Azure Blob Storage: [https://learn.microsoft.com/en-us/azure/storage/blobs/](https://learn.microsoft.com/en-us/azure/storage/blobs/)
* InfluxDB: [https://www.influxdata.com/](https://www.influxdata.com/)
* VictoriaMetrics: [https://victoriametrics.com/](https://victoriametrics.com/)
* Thanos: [https://thanos.io/](https://thanos.io/)
* Grafana Mimir: [https://grafana.com/oss/mimir/](https://grafana.com/oss/mimir/)
Note for certification or overview-level knowledge:
For exams or conceptual understanding, you only need to know that tools like Thanos and Grafana Mimir exist to provide long-term, cost-effective storage for Prometheus metrics. Deep internals of those systems are not required for basic certification-level knowledge.
## Links and references
* Prometheus TSDB flags and command-line options: [https://prometheus.io/docs/prometheus/latest/command-line/flags/](https://prometheus.io/docs/prometheus/latest/command-line/flags/)
* Amazon S3: [https://aws.amazon.com/s3/](https://aws.amazon.com/s3/)
* Azure Blob Storage: [https://learn.microsoft.com/en-us/azure/storage/blobs/](https://learn.microsoft.com/en-us/azure/storage/blobs/)
* InfluxDB: [https://www.influxdata.com/](https://www.influxdata.com/)
* VictoriaMetrics: [https://victoriametrics.com/](https://victoriametrics.com/)
* Thanos: [https://thanos.io/](https://thanos.io/)
* Grafana Mimir: [https://grafana.com/oss/mimir/](https://grafana.com/oss/mimir/)