> ## Documentation Index
> Fetch the complete documentation index at: https://notes.kodekloud.com/llms.txt
> Use this file to discover all available pages before exploring further.
# AWS
> Guide to configuring Prometheus EC2 service discovery, IAM setup, metadata labels, and validation to automatically discover and scrape metrics from AWS EC2 instances
Cloud environments are dynamic: instances are created and terminated continuously (especially with auto-scaling). Prometheus’ EC2 service discovery lets your Prometheus server automatically discover and scrape metrics from EC2 instances in a given AWS region — avoiding manual target management.
This guide explains the required IAM setup, how to configure `prometheus.yml` for EC2 service discovery, what metadata is exposed for discovered targets, and how to validate the configuration in the Prometheus UI.
Use an IAM user with the minimum permission set required: the AWS-managed policy **AmazonEC2ReadOnlyAccess**. For higher security, prefer using an instance role (EC2 IAM role) for Prometheus or an external secrets manager instead of hard-coding access keys in `prometheus.yml`.
## Prerequisites
* A Prometheus server with network reachability to the EC2 instances you want to scrape.
* An AWS account and permission to create IAM users/policies.
* Knowledge of the AWS region(s) you want to monitor (for example `us-east-1`).
## 1) Create an IAM user for Prometheus
Create a new IAM user that Prometheus will use for EC2 discovery. This user only needs programmatic access and the Amazon EC2 Read Only Access policy attached.
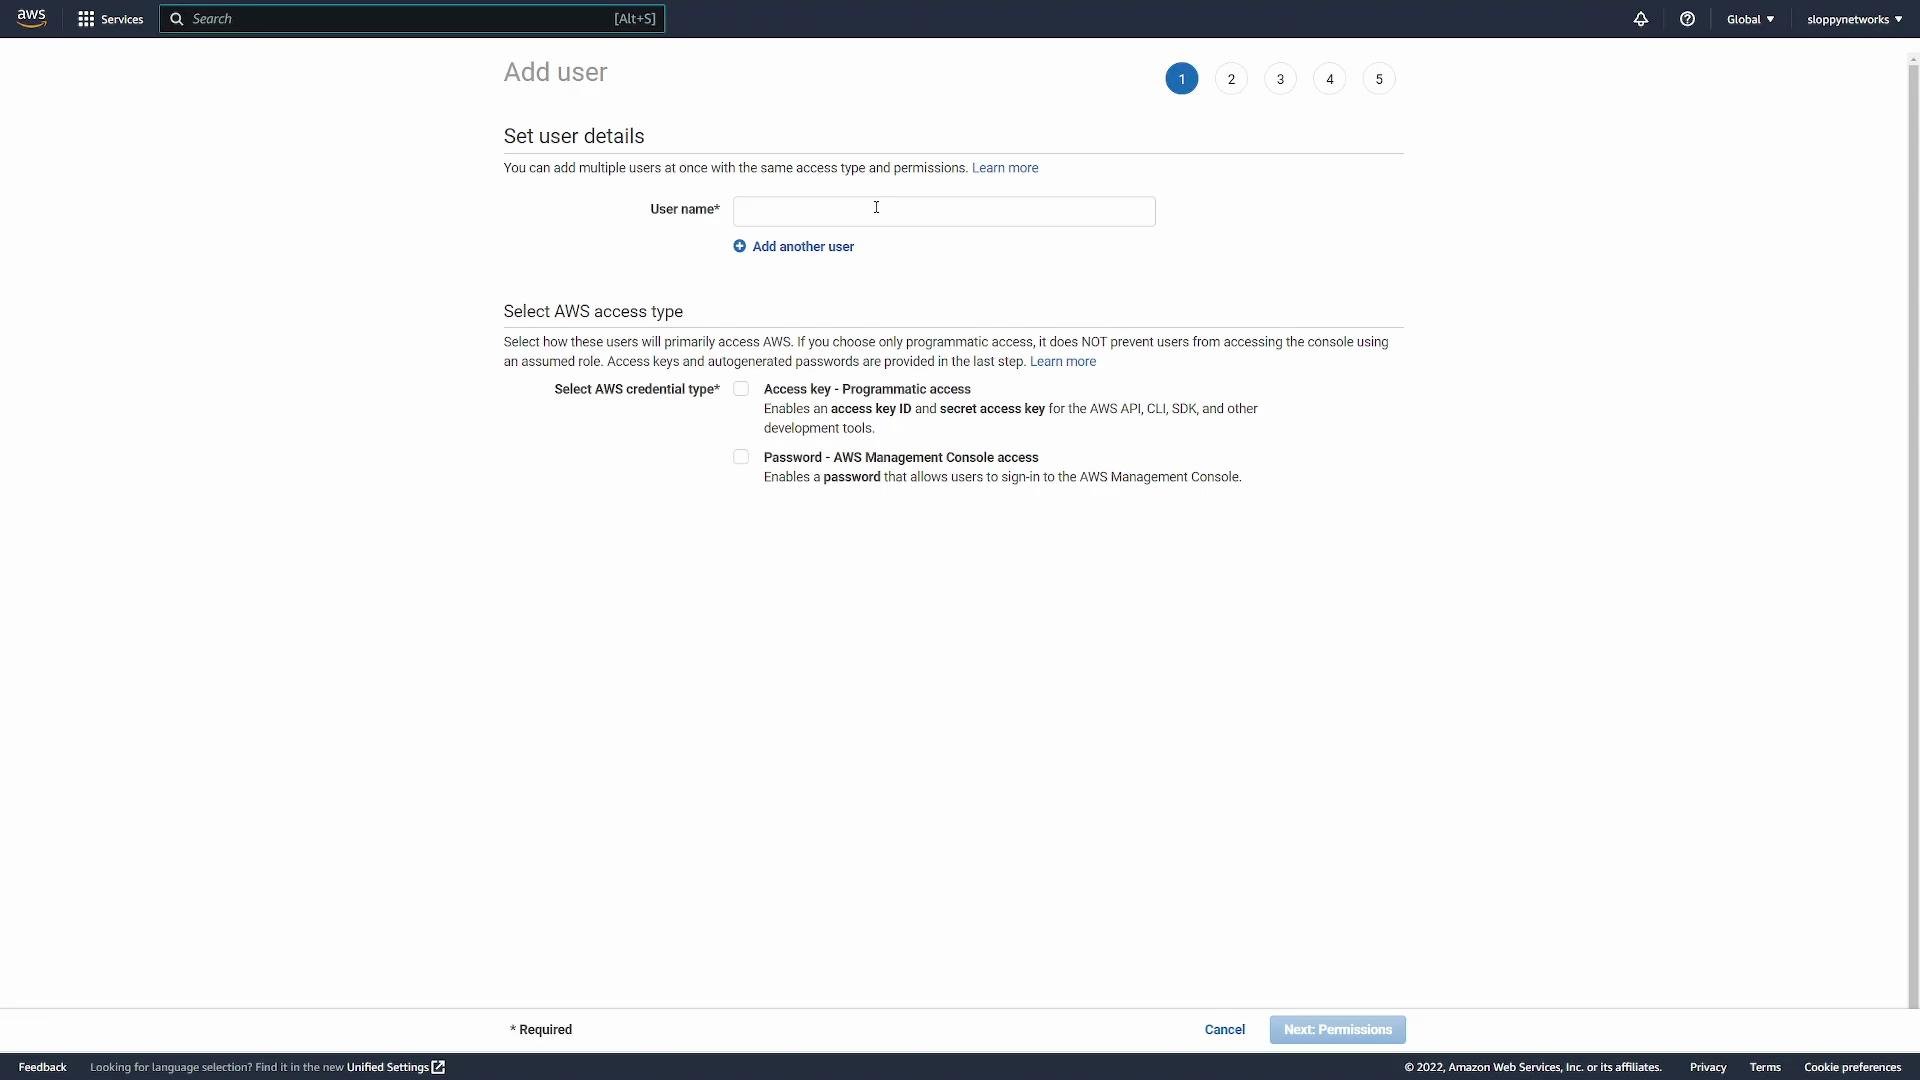 * In the IAM console: Users → Create user.
* Select **Programmatic access** so you can obtain an Access Key ID and Secret Access Key.
* Attach the AWS managed policy **AmazonEC2ReadOnlyAccess**.
* In the IAM console: Users → Create user.
* Select **Programmatic access** so you can obtain an Access Key ID and Secret Access Key.
* Attach the AWS managed policy **AmazonEC2ReadOnlyAccess**.
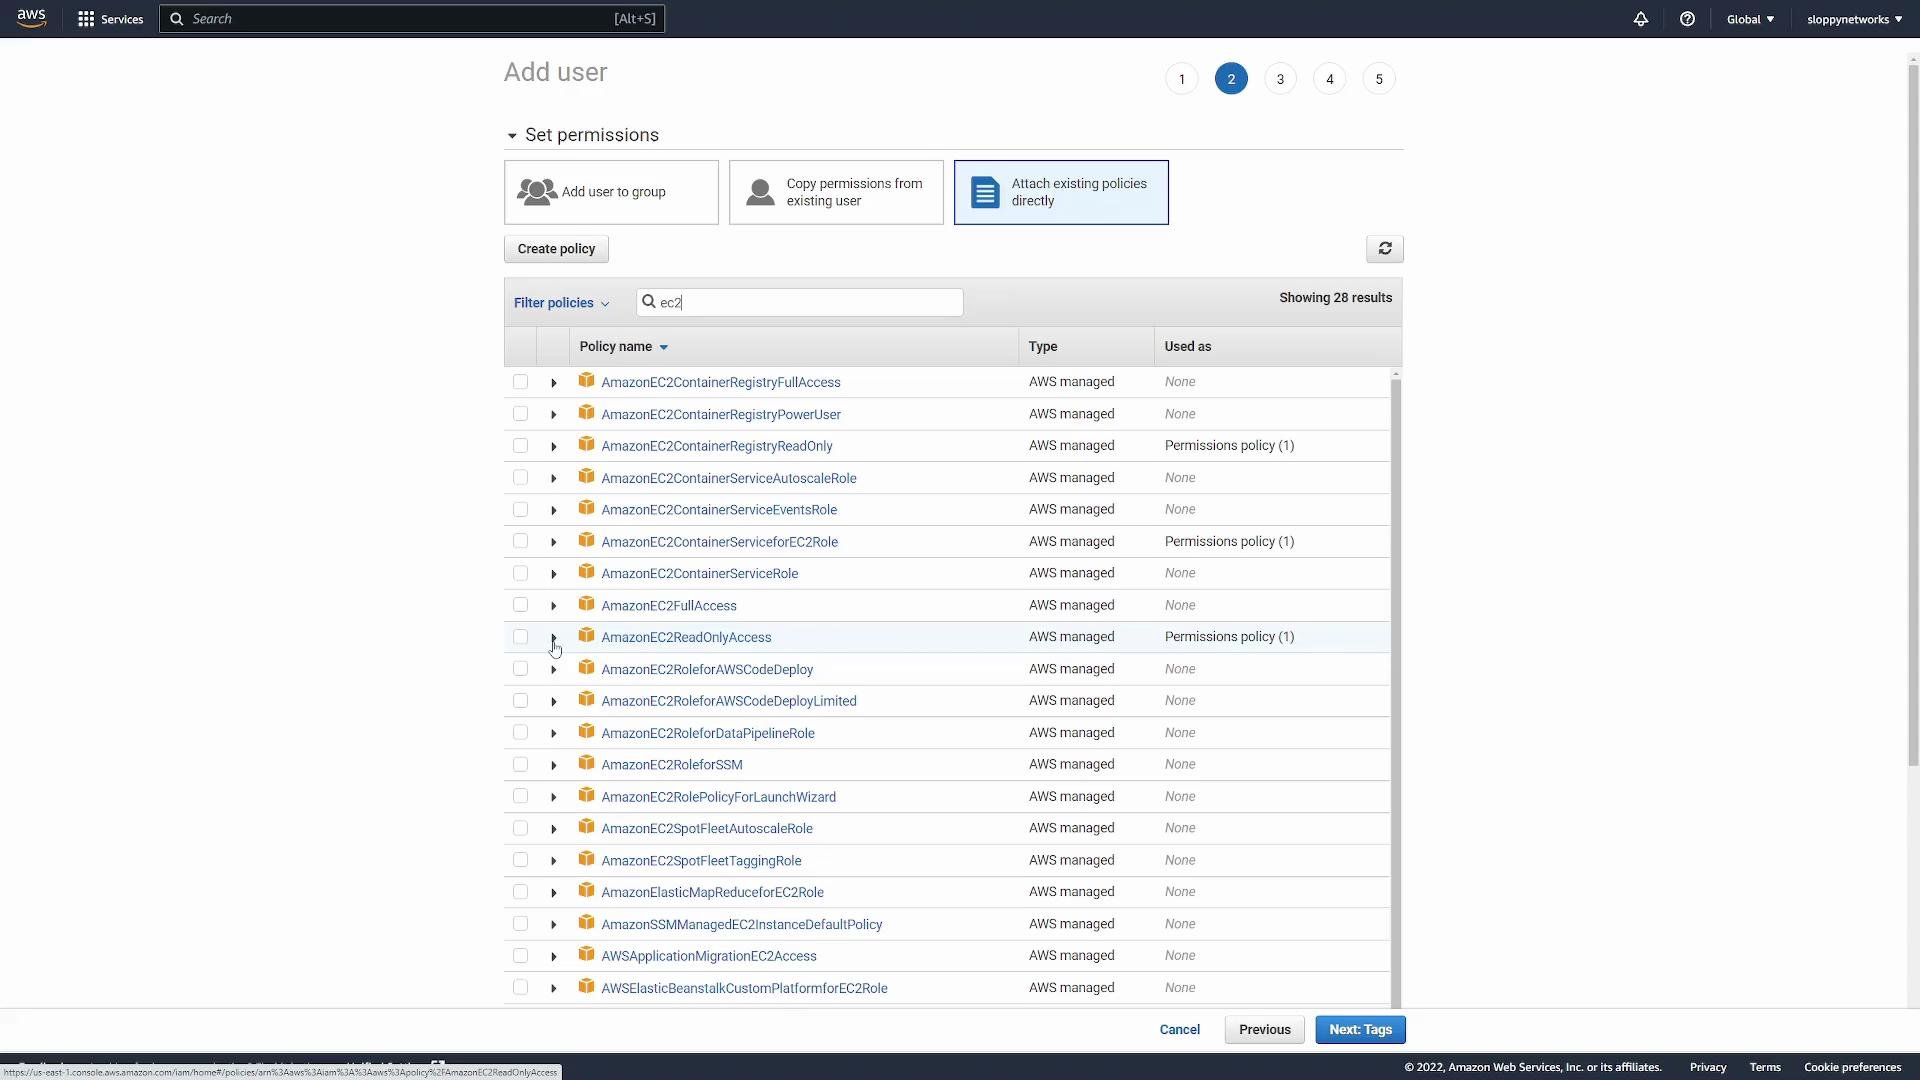
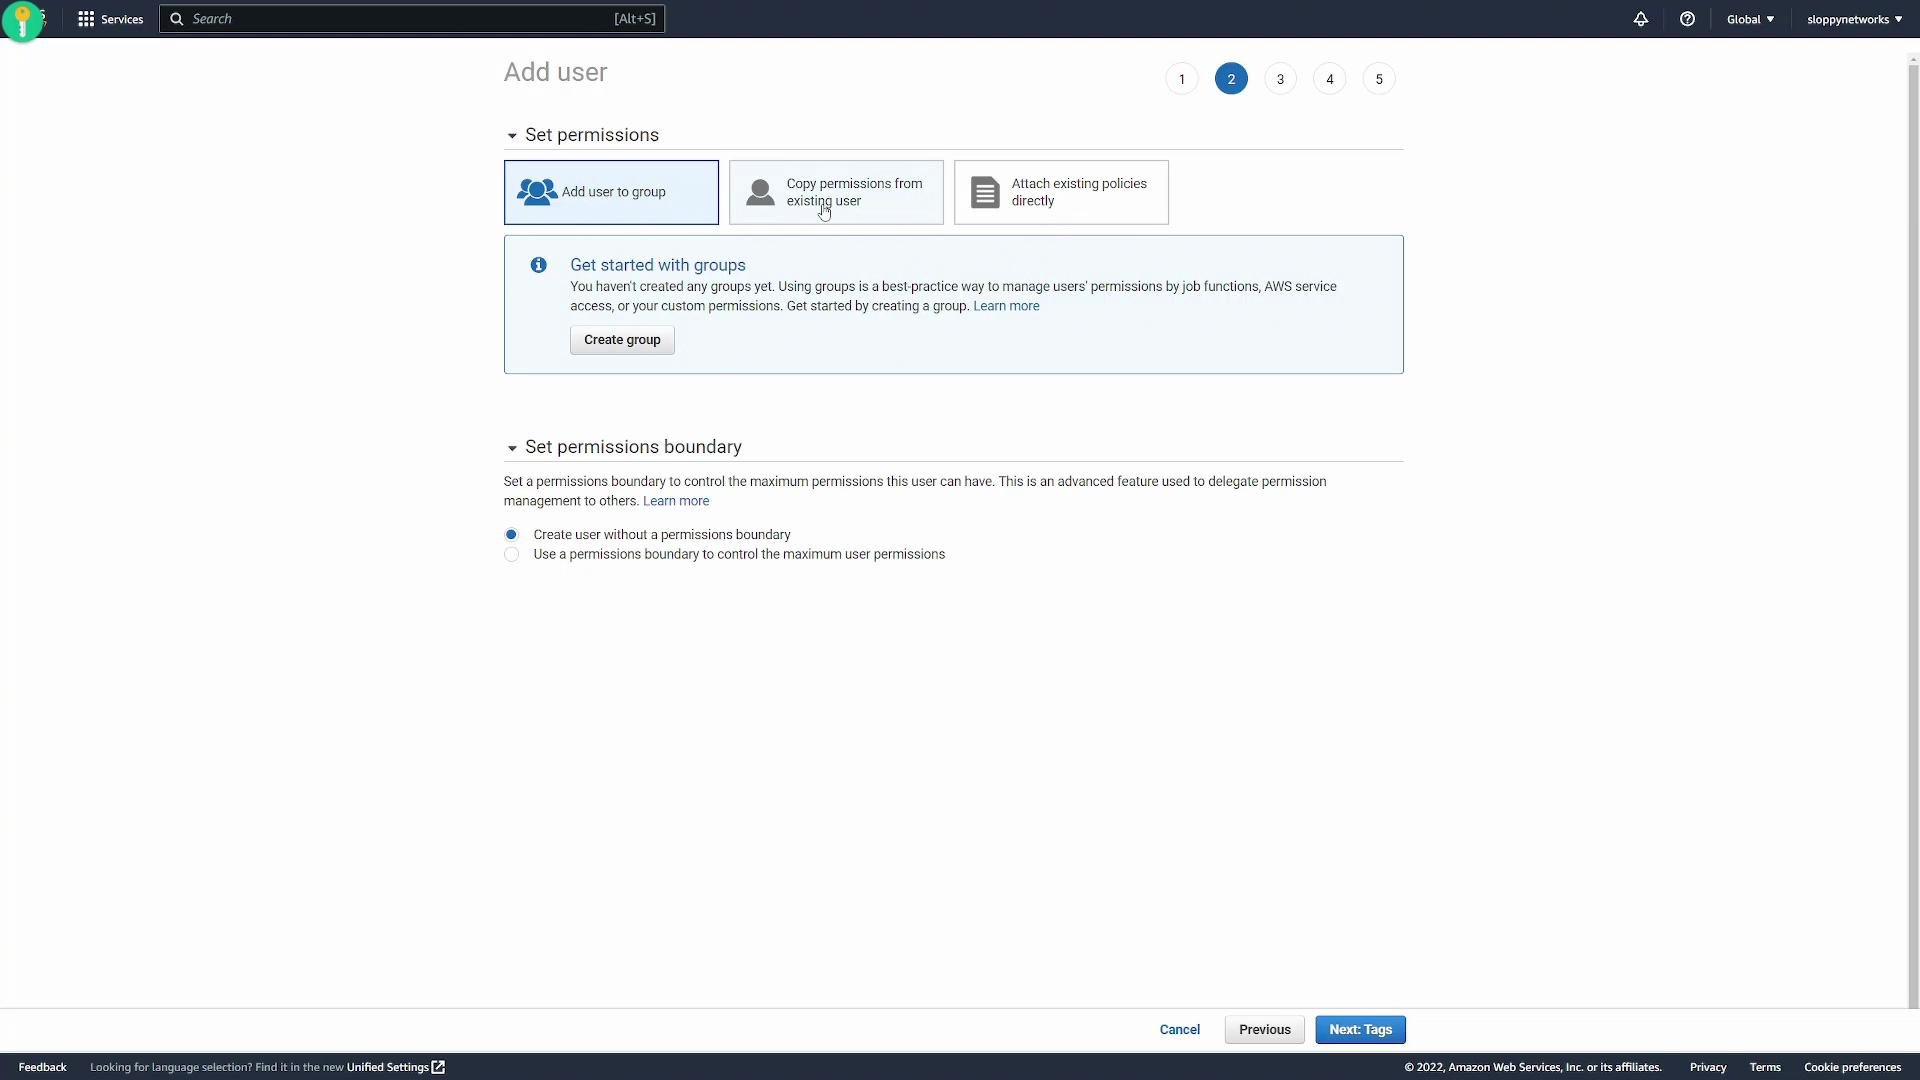 * Skip tags (optional), review, and create the user.
 * After creation, record the **Access Key ID** and **Secret Access Key**. You’ll need them for the Prometheus config.
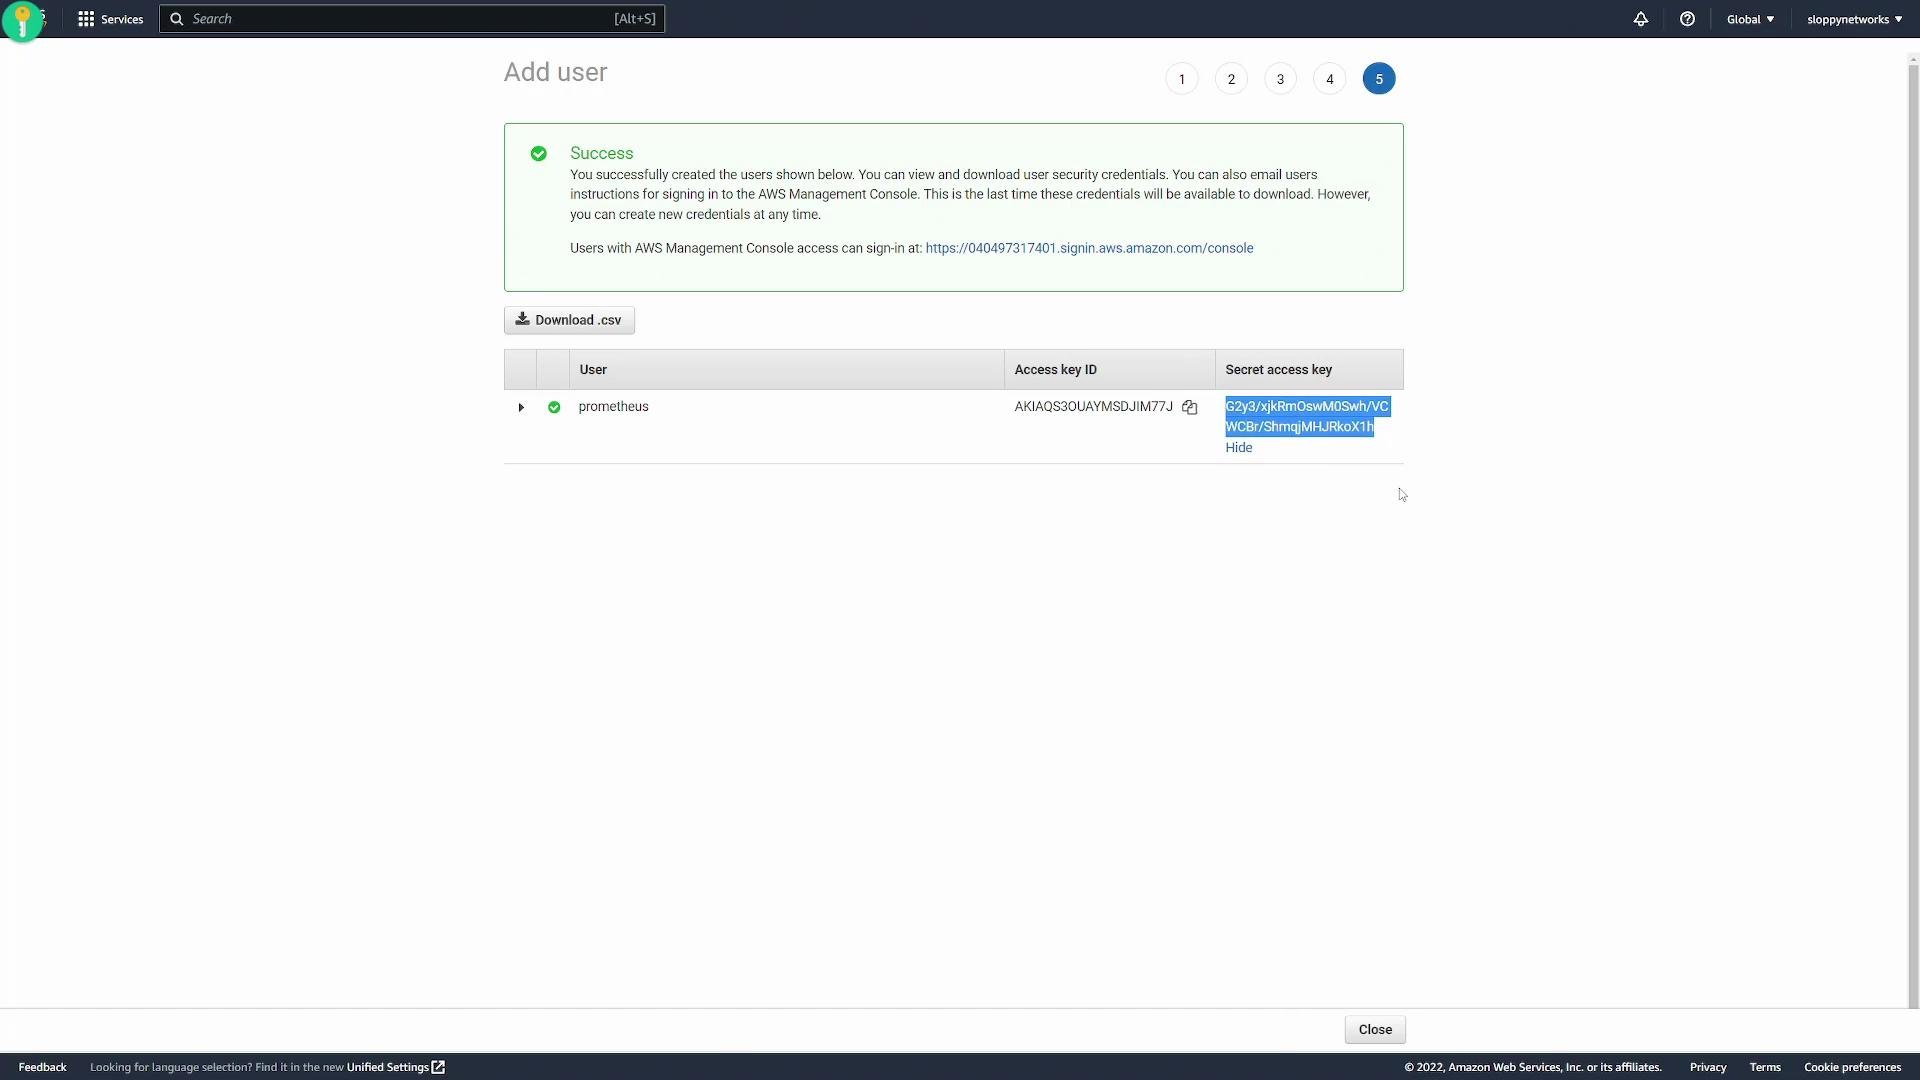 Do NOT commit AWS keys to version control. Prefer instance roles, environment variables, or a secrets manager (e.g., AWS Secrets Manager) for production deployments. Hard-coding keys in `prometheus.yml` is only acceptable for short-term testing.
## 2) Configure Prometheus for EC2 service discovery
Edit your Prometheus configuration file (usually `/etc/prometheus/prometheus.yml`) and add an EC2 scrape job under `scrape_configs`. The minimal `ec2_sd_configs` block requires:
* `region`: the AWS region to discover (e.g., `us-east-1`).
* `access_key`: the IAM user Access Key ID (or omit if using instance role / environment credentials).
* `secret_key`: the Secret Access Key (or omit if using instance role / environment credentials).
Example `prometheus.yml` (showing only relevant parts):
```yaml theme={null}
global:
scrape_interval: 15s
evaluation_interval: 15s
alerting:
alertmanagers:
- static_configs:
- targets:
- alertmanager:9093
rule_files:
# - "first_rules.yml"
scrape_configs:
- job_name: "prometheus"
static_configs:
- targets: ["localhost:9090"]
- job_name: "node"
static_configs:
- targets: ["192.168.1.168:9100"]
- job_name: "ec2"
ec2_sd_configs:
- region: us-east-1
access_key: AKIAQS0UAYMSDJI177
secret_key: G2y3/xjKr0m0sWmA0SWh/VCWCBr/ShmqMJHRJkoX1h
```
Notes:
* Replace `us-east-1`, `access_key`, and `secret_key` with your region and credentials.
* If Prometheus runs on an EC2 instance with an appropriate IAM role, omit `access_key`/`secret_key` entirely — the AWS SDK will use the instance role credentials automatically.
After saving changes, restart Prometheus:
```bash theme={null}
sudo systemctl restart prometheus
```
## 3) What metadata does EC2 SD provide?
Prometheus extracts many EC2 metadata fields as labels for each discovered target. These are available under Service Discovery in the Prometheus UI and can be used for relabeling or filtering.
Example discovered labels for an EC2 target:
```bash theme={null}
address="172.31.1.156:80"
meta_ec2_ami="arn:aws:ec2:us-east-1:123456789012:ami/abcde123"
meta_ec2_architecture="x86_64"
meta_ec2_availability_zone="us-east-1b"
meta_ec2_availability_zone_id="use1-az4"
meta_ec2_instance_id="i-0e23a196c0a198db"
meta_ec2_instance_state="running"
meta_ec2_instance_type="t2.micro"
meta_ec2_owner_id="604794731401"
meta_ec2_primary_subnet_id="subnet-0fde537cdc8041"
meta_ec2_private_dns_name="ip-172-31-1-156.ec2.internal"
meta_ec2_private_ip="172.31.1.156"
meta_ec2_public_dns_name="ec2-3-80-117-102.compute-1.amazonaws.com"
meta_ec2_public_ip="3.80.117.102"
meta_ec2_subnet_id="subnet-0fde537cdc8041"
meta_ec2_tag_instance="web"
meta_ec2_tag_id="vp-id:xyz123456"
metrics_path="/metrics"
scheme="http"
scrape_interval="15s"
scrape_timeout="10s"
job="EC2"
```
Table — Common `meta_ec2_*` labels and their meaning:
| Label | Meaning | Example |
| ---------------------------- | ----------------------------------------- | ------------------------------ |
| `meta_ec2_instance_id` | EC2 instance ID | `i-0e23a196c0a198db` |
| `meta_ec2_private_ip` | Instance private IP | `172.31.1.156` |
| `meta_ec2_public_ip` | Instance public IP (if assigned) | `3.80.117.102` |
| `meta_ec2_instance_type` | Instance type | `t2.micro` |
| `meta_ec2_availability_zone` | AZ (e.g., us-east-1b) | `us-east-1b` |
| `meta_ec2_ami` | AMI ARN | `arn:aws:ec2:...:ami/abcde123` |
| `meta_ec2_tag_` | Tag value for tag key `` | `meta_ec2_tag_instance="web"` |
| `address` | The target address Prometheus will scrape | `172.31.1.156:80` |
By default Prometheus uses the instance's private IP for the `instance` label and for scraping (`address`), because it assumes Prometheus runs near (in the same network/VPC as) the targets. If Prometheus runs outside the VPC and you need to use the public IP, use relabeling to map `meta_ec2_public_ip` into the `__address__`/`instance` labels — or run Prometheus within the same VPC.
## 4) Validate in the Prometheus UI
1. Open your Prometheus server web UI (e.g., `http://:9090`).
2. Navigate to Status → Service Discovery. You should see the EC2 job and the list of discovered instances.
3. Go to Status → Targets to check reachability and scrape status:
* Up: reachable and being scraped.
* Down: unreachable (often a network/firewall issue between Prometheus and the EC2 instance).
If targets are Down, verify:
* Network connectivity (security groups, VPC routing).
* Prometheus can reach the target port (`/metrics` path).
* Correct credentials/region for discovery.
## Additional references
* Prometheus EC2 SD docs: [https://prometheus.io/docs/prometheus/latest/configuration/configuration/#ec2\_sd\_config](https://prometheus.io/docs/prometheus/latest/configuration/configuration/#ec2_sd_config)
* AWS IAM docs: [https://docs.aws.amazon.com/iam/](https://docs.aws.amazon.com/iam/)
* AWS EC2 docs: [https://docs.aws.amazon.com/ec2/](https://docs.aws.amazon.com/ec2/)
With EC2 service discovery in place, Prometheus will continually refresh the list of targets as instances are launched or terminated, keeping your monitoring accurate and up-to-date.
Do NOT commit AWS keys to version control. Prefer instance roles, environment variables, or a secrets manager (e.g., AWS Secrets Manager) for production deployments. Hard-coding keys in `prometheus.yml` is only acceptable for short-term testing.
## 2) Configure Prometheus for EC2 service discovery
Edit your Prometheus configuration file (usually `/etc/prometheus/prometheus.yml`) and add an EC2 scrape job under `scrape_configs`. The minimal `ec2_sd_configs` block requires:
* `region`: the AWS region to discover (e.g., `us-east-1`).
* `access_key`: the IAM user Access Key ID (or omit if using instance role / environment credentials).
* `secret_key`: the Secret Access Key (or omit if using instance role / environment credentials).
Example `prometheus.yml` (showing only relevant parts):
```yaml theme={null}
global:
scrape_interval: 15s
evaluation_interval: 15s
alerting:
alertmanagers:
- static_configs:
- targets:
- alertmanager:9093
rule_files:
# - "first_rules.yml"
scrape_configs:
- job_name: "prometheus"
static_configs:
- targets: ["localhost:9090"]
- job_name: "node"
static_configs:
- targets: ["192.168.1.168:9100"]
- job_name: "ec2"
ec2_sd_configs:
- region: us-east-1
access_key: AKIAQS0UAYMSDJI177
secret_key: G2y3/xjKr0m0sWmA0SWh/VCWCBr/ShmqMJHRJkoX1h
```
Notes:
* Replace `us-east-1`, `access_key`, and `secret_key` with your region and credentials.
* If Prometheus runs on an EC2 instance with an appropriate IAM role, omit `access_key`/`secret_key` entirely — the AWS SDK will use the instance role credentials automatically.
After saving changes, restart Prometheus:
```bash theme={null}
sudo systemctl restart prometheus
```
## 3) What metadata does EC2 SD provide?
Prometheus extracts many EC2 metadata fields as labels for each discovered target. These are available under Service Discovery in the Prometheus UI and can be used for relabeling or filtering.
Example discovered labels for an EC2 target:
```bash theme={null}
address="172.31.1.156:80"
meta_ec2_ami="arn:aws:ec2:us-east-1:123456789012:ami/abcde123"
meta_ec2_architecture="x86_64"
meta_ec2_availability_zone="us-east-1b"
meta_ec2_availability_zone_id="use1-az4"
meta_ec2_instance_id="i-0e23a196c0a198db"
meta_ec2_instance_state="running"
meta_ec2_instance_type="t2.micro"
meta_ec2_owner_id="604794731401"
meta_ec2_primary_subnet_id="subnet-0fde537cdc8041"
meta_ec2_private_dns_name="ip-172-31-1-156.ec2.internal"
meta_ec2_private_ip="172.31.1.156"
meta_ec2_public_dns_name="ec2-3-80-117-102.compute-1.amazonaws.com"
meta_ec2_public_ip="3.80.117.102"
meta_ec2_subnet_id="subnet-0fde537cdc8041"
meta_ec2_tag_instance="web"
meta_ec2_tag_id="vp-id:xyz123456"
metrics_path="/metrics"
scheme="http"
scrape_interval="15s"
scrape_timeout="10s"
job="EC2"
```
Table — Common `meta_ec2_*` labels and their meaning:
| Label | Meaning | Example |
| ---------------------------- | ----------------------------------------- | ------------------------------ |
| `meta_ec2_instance_id` | EC2 instance ID | `i-0e23a196c0a198db` |
| `meta_ec2_private_ip` | Instance private IP | `172.31.1.156` |
| `meta_ec2_public_ip` | Instance public IP (if assigned) | `3.80.117.102` |
| `meta_ec2_instance_type` | Instance type | `t2.micro` |
| `meta_ec2_availability_zone` | AZ (e.g., us-east-1b) | `us-east-1b` |
| `meta_ec2_ami` | AMI ARN | `arn:aws:ec2:...:ami/abcde123` |
| `meta_ec2_tag_` | Tag value for tag key `` | `meta_ec2_tag_instance="web"` |
| `address` | The target address Prometheus will scrape | `172.31.1.156:80` |
By default Prometheus uses the instance's private IP for the `instance` label and for scraping (`address`), because it assumes Prometheus runs near (in the same network/VPC as) the targets. If Prometheus runs outside the VPC and you need to use the public IP, use relabeling to map `meta_ec2_public_ip` into the `__address__`/`instance` labels — or run Prometheus within the same VPC.
## 4) Validate in the Prometheus UI
1. Open your Prometheus server web UI (e.g., `http://:9090`).
2. Navigate to Status → Service Discovery. You should see the EC2 job and the list of discovered instances.
3. Go to Status → Targets to check reachability and scrape status:
* Up: reachable and being scraped.
* Down: unreachable (often a network/firewall issue between Prometheus and the EC2 instance).
If targets are Down, verify:
* Network connectivity (security groups, VPC routing).
* Prometheus can reach the target port (`/metrics` path).
* Correct credentials/region for discovery.
## Additional references
* Prometheus EC2 SD docs: [https://prometheus.io/docs/prometheus/latest/configuration/configuration/#ec2\_sd\_config](https://prometheus.io/docs/prometheus/latest/configuration/configuration/#ec2_sd_config)
* AWS IAM docs: [https://docs.aws.amazon.com/iam/](https://docs.aws.amazon.com/iam/)
* AWS EC2 docs: [https://docs.aws.amazon.com/ec2/](https://docs.aws.amazon.com/ec2/)
With EC2 service discovery in place, Prometheus will continually refresh the list of targets as instances are launched or terminated, keeping your monitoring accurate and up-to-date.