> ## Documentation Index
> Fetch the complete documentation index at: https://notes.kodekloud.com/llms.txt
> Use this file to discover all available pages before exploring further.
# File
> Explains Prometheus file-based service discovery using JSON or YAML files to define scrape targets and labels, referenced in prometheus.yml and auto-reloaded when files change.
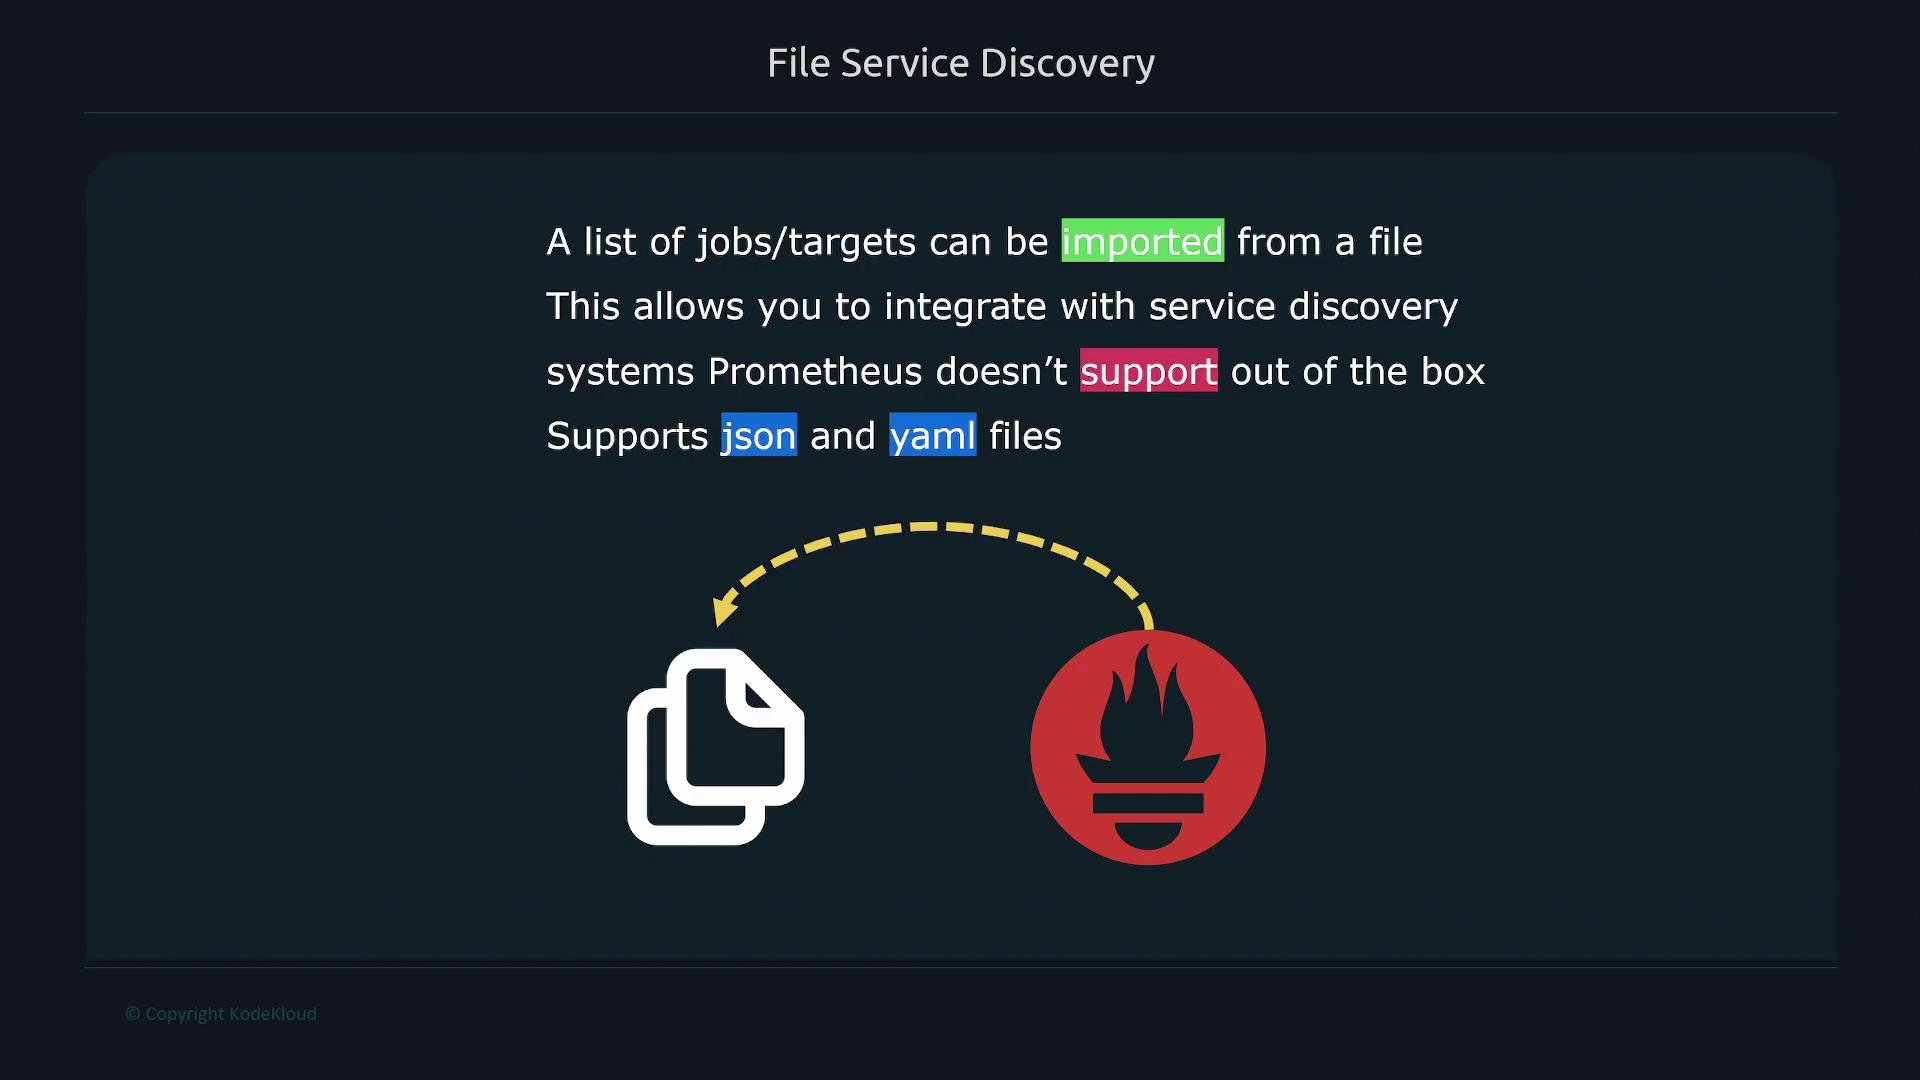
File-based service discovery (file SD) lets Prometheus import a list of scrape jobs and targets from external files. This is useful when you want a lightweight, static-style discovery mechanism or when integrating with a third‑party service discovery system that Prometheus does not support natively. You can provide those files in JSON or YAML and reference them from `prometheus.yml`.
 How it works
* You create one or more files that list target groups as objects with `targets` and `labels`.
* In `prometheus.yml`, add a `file_sd_configs` entry under the appropriate `scrape_configs` job and point it at those files (or use a glob to match many files).
* Prometheus watches those files and updates its target list when the files change.
Example: targets file (JSON)
```json theme={null}
[
{
"targets": ["node1:9100", "node2:9100"],
"labels": {
"team": "dev",
"job": "node"
}
},
{
"targets": ["localhost:9090"],
"labels": {
"team": "monitoring",
"job": "prometheus"
}
},
{
"targets": ["db1:9090"],
"labels": {
"team": "db",
"job": "database"
}
}
]
```
Referencing the file(s) from `prometheus.yml`:
```yaml theme={null}
scrape_configs:
- job_name: file-example
file_sd_configs:
- files:
- 'file-sd.json'
- '*.json'
```
Tip: use glob patterns to include multiple files (for example, `*.json` or `**/*.yaml`). Prometheus will merge the discovered target groups from all matched files.
Prometheus watches the configured files and automatically reloads targets when they change. Use globs to split targets across files (per-team or per-environment) and keep your `prometheus.yml` small and consistent.
What goes into each file
| Key | Description | Example |
| --------- | ----------------------------------------------------- | ------------------------------ |
| `targets` | List of endpoint addresses (host:port) to scrape | `["node1:9100", "node2:9100"]` |
| `labels` | Key/value labels applied to every target in the group | `{"team":"dev", "job":"node"}` |
Operational notes
* The `job` label is commonly set in the file to identify the scrape job, but you can set any labels required for your metrics or alerting rules.
* Files may be JSON or YAML; choose the format that best fits your tooling.
* After Prometheus starts (or after the files change), check the Prometheus UI to verify discovered targets appear as expected.
Treat file-based configuration as sensitive: files may contain labels or metadata you don’t want exposed. Secure file permissions and avoid storing credentials in these files.
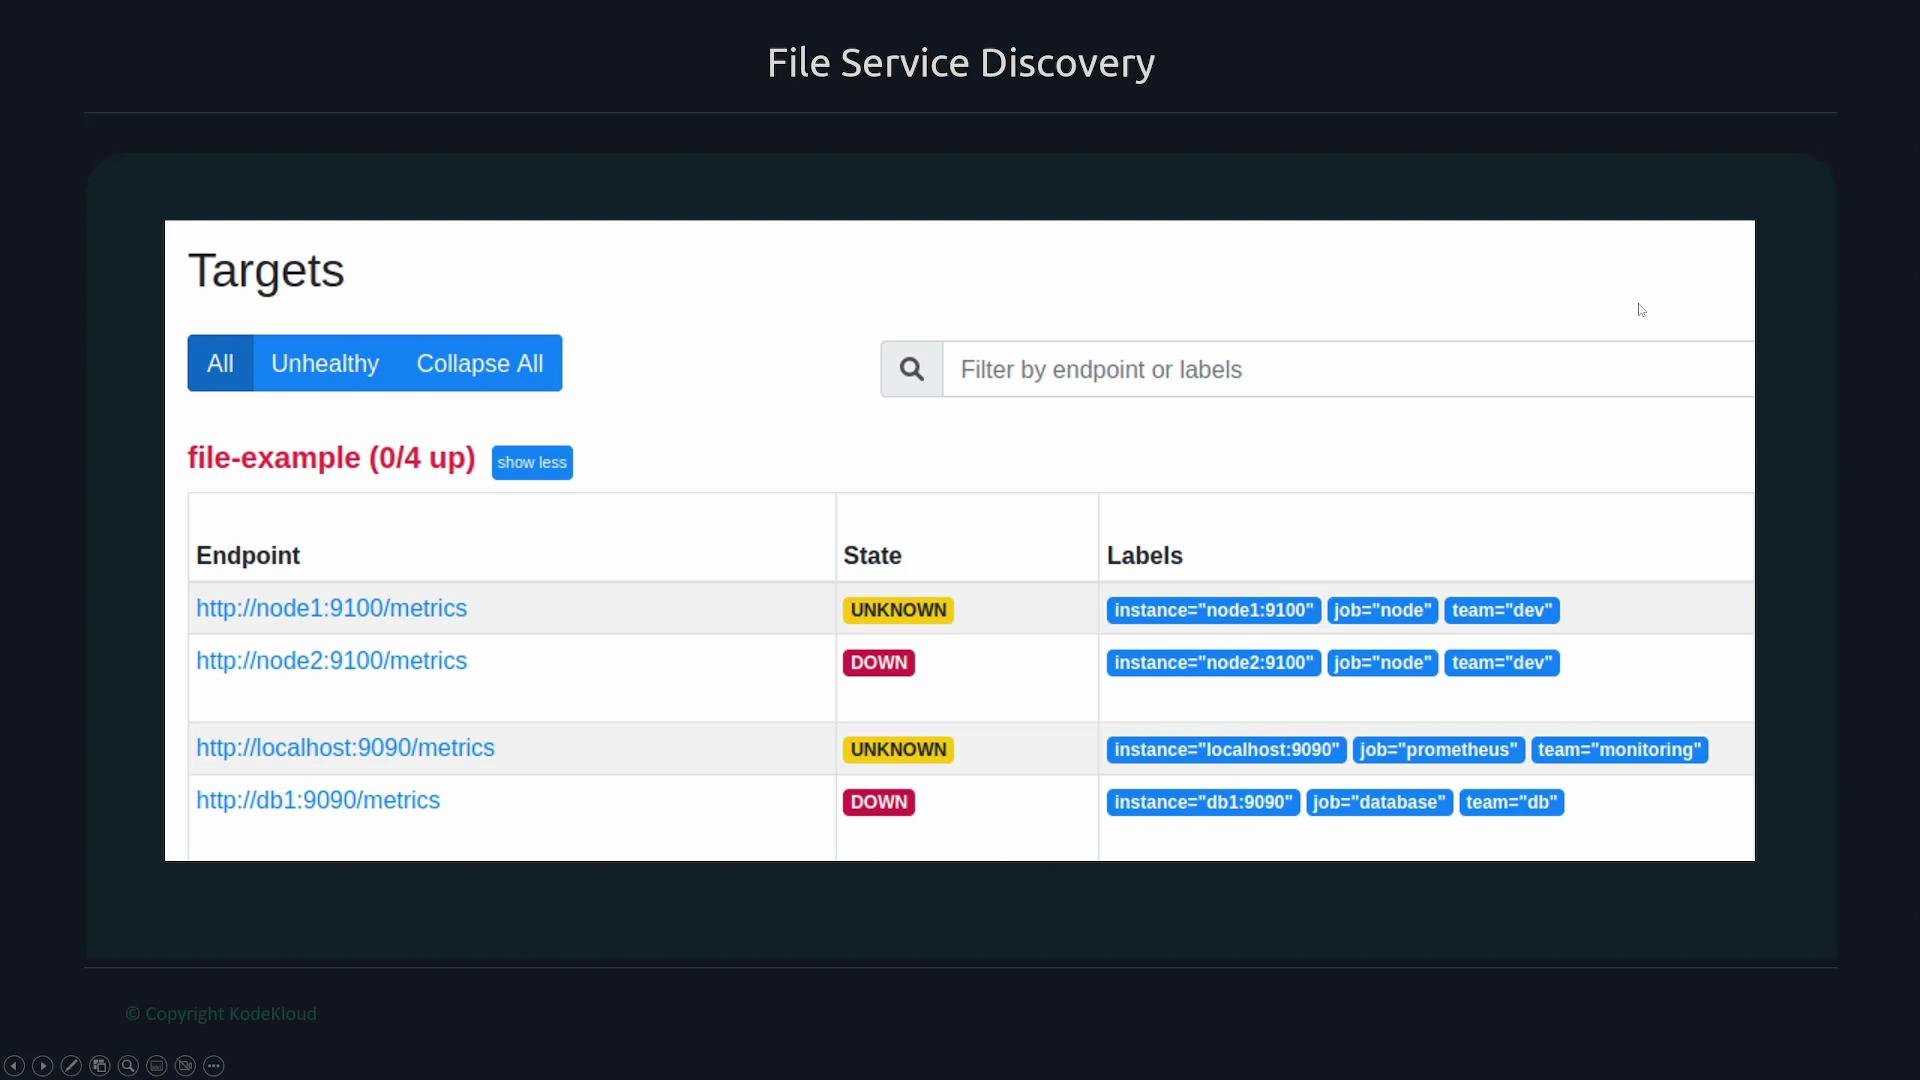
After you configure and (re)start Prometheus, visit Status → Service Discovery in the web UI to inspect discovered targets and labels. The UI shows discovered labels, target states, and other metadata—use it to validate that your file SD setup imported everything correctly.
How it works
* You create one or more files that list target groups as objects with `targets` and `labels`.
* In `prometheus.yml`, add a `file_sd_configs` entry under the appropriate `scrape_configs` job and point it at those files (or use a glob to match many files).
* Prometheus watches those files and updates its target list when the files change.
Example: targets file (JSON)
```json theme={null}
[
{
"targets": ["node1:9100", "node2:9100"],
"labels": {
"team": "dev",
"job": "node"
}
},
{
"targets": ["localhost:9090"],
"labels": {
"team": "monitoring",
"job": "prometheus"
}
},
{
"targets": ["db1:9090"],
"labels": {
"team": "db",
"job": "database"
}
}
]
```
Referencing the file(s) from `prometheus.yml`:
```yaml theme={null}
scrape_configs:
- job_name: file-example
file_sd_configs:
- files:
- 'file-sd.json'
- '*.json'
```
Tip: use glob patterns to include multiple files (for example, `*.json` or `**/*.yaml`). Prometheus will merge the discovered target groups from all matched files.
Prometheus watches the configured files and automatically reloads targets when they change. Use globs to split targets across files (per-team or per-environment) and keep your `prometheus.yml` small and consistent.
What goes into each file
| Key | Description | Example |
| --------- | ----------------------------------------------------- | ------------------------------ |
| `targets` | List of endpoint addresses (host:port) to scrape | `["node1:9100", "node2:9100"]` |
| `labels` | Key/value labels applied to every target in the group | `{"team":"dev", "job":"node"}` |
Operational notes
* The `job` label is commonly set in the file to identify the scrape job, but you can set any labels required for your metrics or alerting rules.
* Files may be JSON or YAML; choose the format that best fits your tooling.
* After Prometheus starts (or after the files change), check the Prometheus UI to verify discovered targets appear as expected.
Treat file-based configuration as sensitive: files may contain labels or metadata you don’t want exposed. Secure file permissions and avoid storing credentials in these files.
After you configure and (re)start Prometheus, visit Status → Service Discovery in the web UI to inspect discovered targets and labels. The UI shows discovered labels, target states, and other metadata—use it to validate that your file SD setup imported everything correctly.
 Summary
* File SD is a simple way to import static or externally-provided targets into Prometheus.
* Use JSON/YAML files and reference them via `file_sd_configs` in `prometheus.yml`.
* Use globs to manage many files and the Prometheus UI to verify discovery results.
Links and references
* [Prometheus configuration documentation](https://prometheus.io/docs/prometheus/latest/configuration/configuration/)
* [Prometheus service discovery options](https://prometheus.io/docs/prometheus/latest/configuration/configuration/#service-discovery)
Summary
* File SD is a simple way to import static or externally-provided targets into Prometheus.
* Use JSON/YAML files and reference them via `file_sd_configs` in `prometheus.yml`.
* Use globs to manage many files and the Prometheus UI to verify discovery results.
Links and references
* [Prometheus configuration documentation](https://prometheus.io/docs/prometheus/latest/configuration/configuration/)
* [Prometheus service discovery options](https://prometheus.io/docs/prometheus/latest/configuration/configuration/#service-discovery)