> ## Documentation Index
> Fetch the complete documentation index at: https://notes.kodekloud.com/llms.txt
> Use this file to discover all available pages before exploring further.
# Re Labeling Demo
> Demonstrates Prometheus relabeling to filter scrape targets and transform metrics and labels using relabel_configs and metric_relabel_configs with examples and tips
This guide demonstrates how to use Prometheus relabeling to control which targets are scraped and how metrics and labels are transformed. It covers:
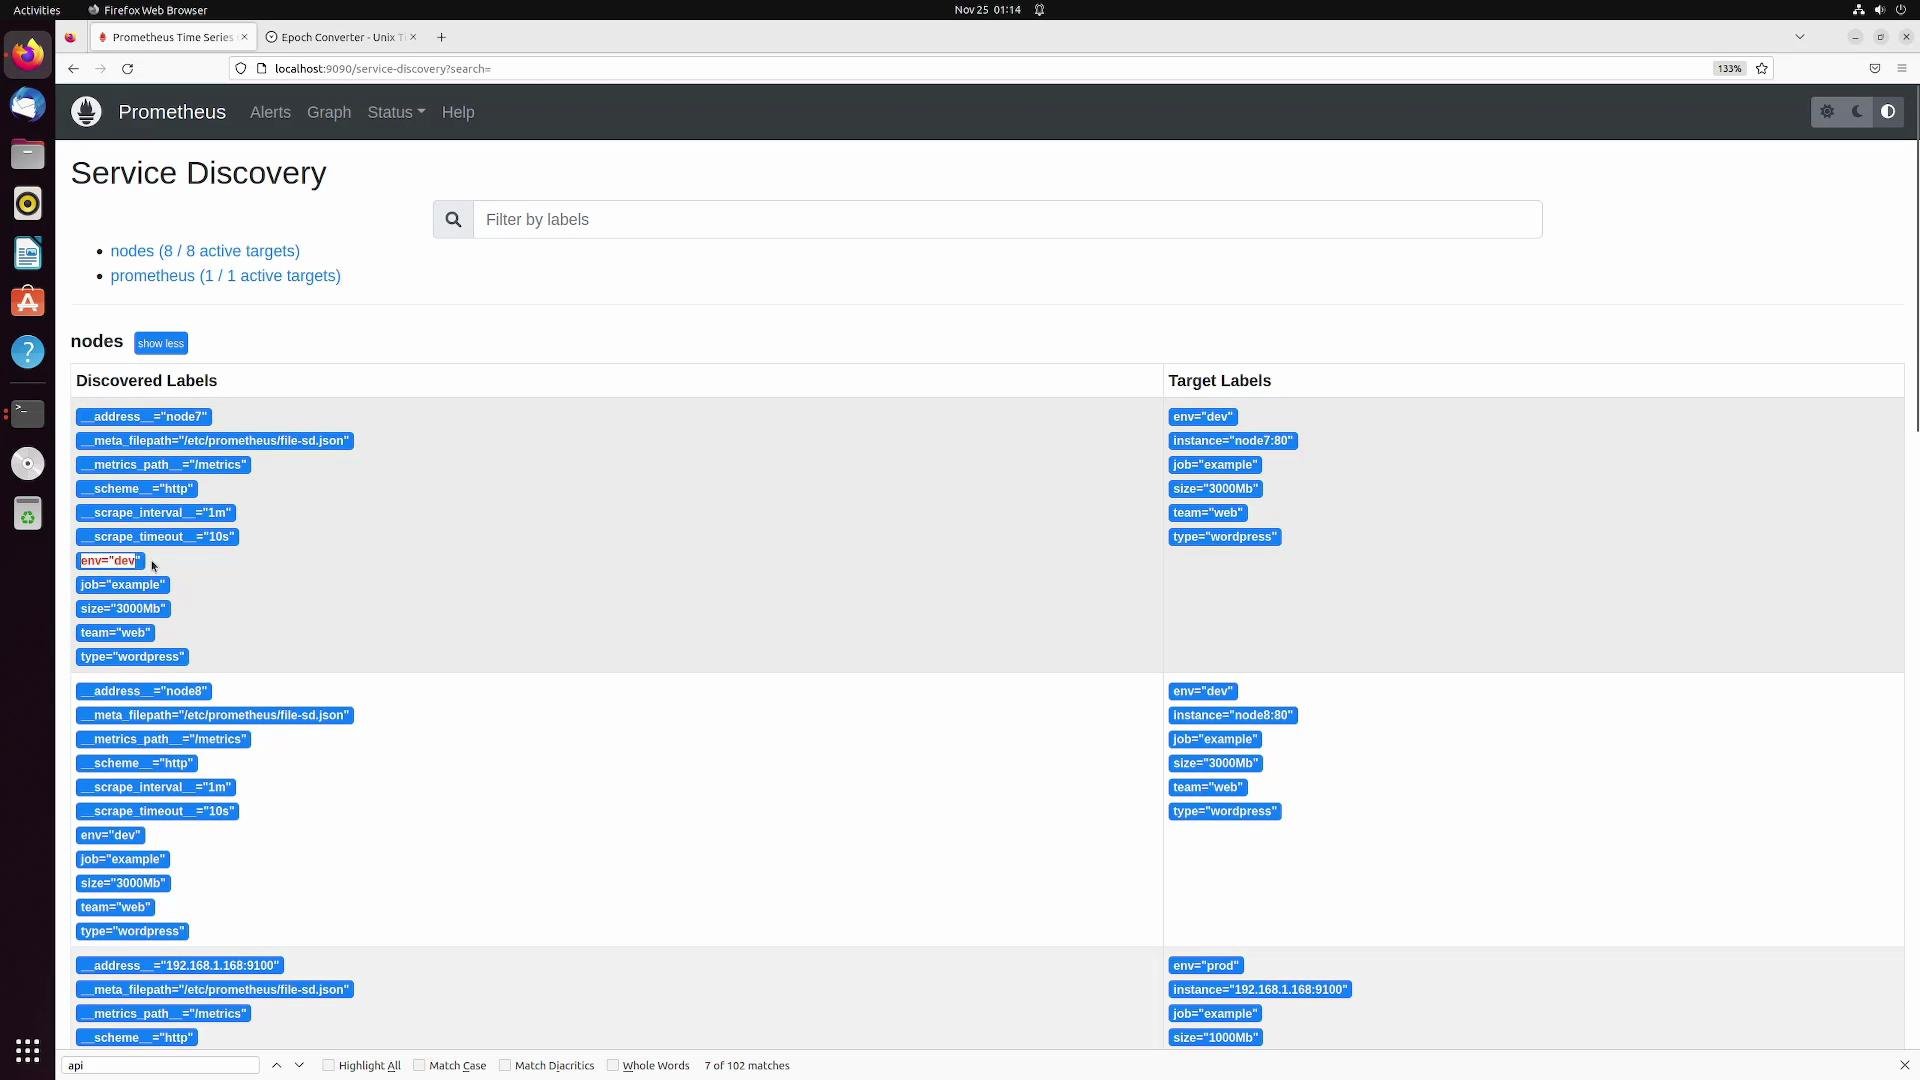
* Service Discovery: discovered labels
* relabel\_configs (pre-scrape): limit/drop/keep targets, create new labels
* metric\_relabel\_configs (post-scrape): rename metrics, drop/keep metrics, rename metric labels
Use the examples below as templates for any service discovery mechanism (file, DNS, Consul, EC2, Kubernetes, etc.) — the relabeling principles are the same.
Service Discovery: discovered labels
* Typical discovered labels you will see: `env` (dev/staging/prod), `size`, `team` (web/database), `type`, plus instance and job metadata.
* With these labels you can decide which targets to scrape and which labels to keep or transform.
 Relabeling is applied at two distinct times:
* `relabel_configs` are applied during target discovery (before scraping).
* `metric_relabel_configs` are applied after scraping (on the collected metrics).
Use `relabel_configs` to filter targets and adjust target labels. Use `metric_relabel_configs` to rename metrics or manipulate metric labels.
## 1) relabel\_configs (pre-scrape): filter targets and modify discovered labels
Example goal: only scrape targets where `env=prod`.
YAML example (add to the `nodes` job in `prometheus.yml`):
```yaml theme={null}
scrape_configs:
- job_name: "prometheus"
static_configs:
- targets: ["localhost:9090"]
- job_name: "nodes"
relabel_configs:
- source_labels: [env]
regex: prod
action: keep
file_sd_configs:
- files:
- file-sd.json
```
* `source_labels`: list of discovered label keys to use for matching.
* `regex`: regular expression to match against the concatenated `source_labels`.
* `action: keep` will keep matching targets and drop everything else.
After reloading Prometheus and refreshing the Service Discovery view, you should only see targets where `env=prod`.
Relabeling is applied at two distinct times:
* `relabel_configs` are applied during target discovery (before scraping).
* `metric_relabel_configs` are applied after scraping (on the collected metrics).
Use `relabel_configs` to filter targets and adjust target labels. Use `metric_relabel_configs` to rename metrics or manipulate metric labels.
## 1) relabel\_configs (pre-scrape): filter targets and modify discovered labels
Example goal: only scrape targets where `env=prod`.
YAML example (add to the `nodes` job in `prometheus.yml`):
```yaml theme={null}
scrape_configs:
- job_name: "prometheus"
static_configs:
- targets: ["localhost:9090"]
- job_name: "nodes"
relabel_configs:
- source_labels: [env]
regex: prod
action: keep
file_sd_configs:
- files:
- file-sd.json
```
* `source_labels`: list of discovered label keys to use for matching.
* `regex`: regular expression to match against the concatenated `source_labels`.
* `action: keep` will keep matching targets and drop everything else.
After reloading Prometheus and refreshing the Service Discovery view, you should only see targets where `env=prod`.
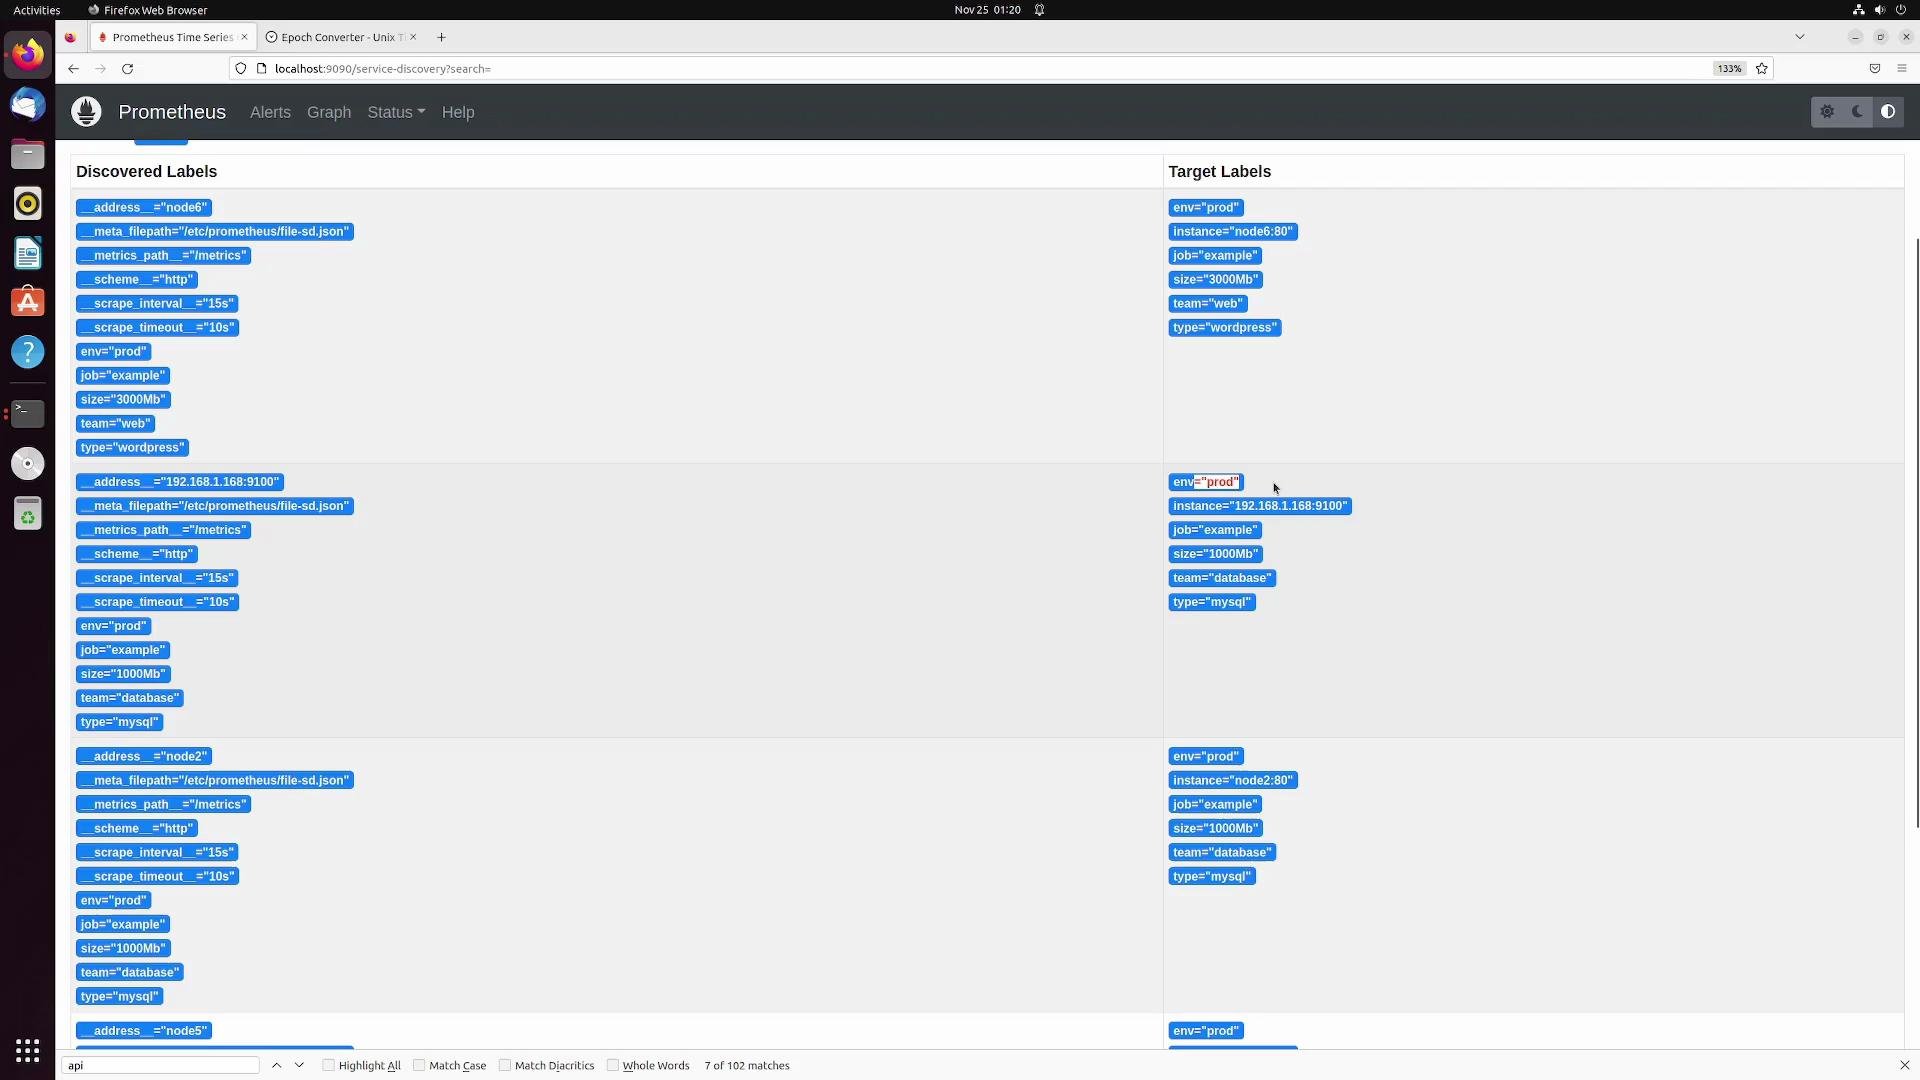 Example target metadata from a file-based service discovery (for reference):
```text theme={null}
address = "192.168.1.168:9100"
_meta_filepath="/etc/prometheus/file-sd.json"
metrics_path = "/metrics"
scheme = "http"
scrape_interval = "15s"
scrape_timeout = "10s"
env="prod"
job="example"
size="1000Mb"
team="database"
type="mysql"
address = "node2"
_meta_filepath="/etc/prometheus/file-sd.json"
metrics_path = "/metrics"
scheme = "http"
scrape_interval = "15s"
scrape_timeout = "10s"
env="prod"
job="example"
size="1000Mb"
team="database"
type="mysql"
address = "node5"
_meta_filepath="/etc/prometheus/file-sd.json"
metrics_path = "/metrics"
scheme = "http"
scrape_interval = "15s"
scrape_timeout = "10s"
env="prod"
job="example"
size="3000Mb"
team="web"
type="wordpress"
```
Tip: `action: drop` behaves as the inverse of `keep` — drop all matched targets and keep the rest. Example:
```yaml theme={null}
scrape_configs:
- job_name: "prometheus"
static_configs:
- targets: ["localhost:9090"]
- job_name: "nodes"
relabel_configs:
- source_labels: [env]
regex: prod
action: drop
file_sd_configs:
- files:
- file-sd.json
```
After reloading with `action: drop`, targets with `env=prod` are removed and other targets remain.
### Combine labels into a new target label (replace)
Create a new target label `info` that concatenates `team` and `env` (e.g. `database-prod`):
```yaml theme={null}
scrape_configs:
- job_name: "nodes"
relabel_configs:
- source_labels: [team, env]
regex: (.*);(.*)
action: replace
target_label: info
replacement: $1-$2
file_sd_configs:
- files:
- file-sd.json
```
Notes:
* When multiple `source_labels` are provided, Prometheus joins them with semicolons before matching the `regex`.
* `$1`, `$2` refer to the first and second captured groups from the regex.
### Remove a discovered label (labeldrop / labelkeep)
To drop a discovered label such as `size`, use `labeldrop`:
```yaml theme={null}
scrape_configs:
- job_name: "nodes"
relabel_configs:
- regex: size
action: labeldrop
file_sd_configs:
- files:
- file-sd.json
```
Use `labelkeep` if you want to keep only specific labels and drop the rest.
Table: Common relabel actions
| Action | Purpose | Example | |
| ----------- | ------------------------------------------- | -------------------------------------------------------- | ------ |
| `keep` | Keep only matched targets | `action: keep` with `source_labels: [env]` `regex: prod` | |
| `drop` | Drop matched targets | `action: drop` with `source_labels: [env]` `regex: prod` | |
| `replace` | Create/replace a label value | Use `replacement` and `target_label` | |
| `labeldrop` | Remove matching labels from target metadata | `action: labeldrop` `regex: size` | |
| `labelkeep` | Keep matching labels only | `action: labelkeep` \`regex: env | team\` |
Careful with `keep`/`drop` rules: a single `keep` can unintentionally drop many targets. When filtering, verify with the Service Discovery UI and reload Prometheus to confirm the effect.
***
## 2) metric\_relabel\_configs (post-scrape): modify metrics and metric labels
Use `metric_relabel_configs` to transform metrics after they are scraped. This is useful to:
* Rename metric names
* Drop or keep specific metrics
* Rename metric labels or copy label values
Remember: metric names are represented as a label whose key is `__name__`. To match/rename a metric use `source_labels: [__name__]` and `target_label: __name__`.
### Rename a metric (change metric name)
Rename `node_cpu_seconds_total` to `host_cpu_seconds_total`:
```yaml theme={null}
scrape_configs:
- job_name: "nodes"
metric_relabel_configs:
- source_labels: [__name__]
regex: node_cpu_seconds_total
action: replace
replacement: host_cpu_seconds_total
target_label: __name__
file_sd_configs:
- files:
- file-sd.json
```
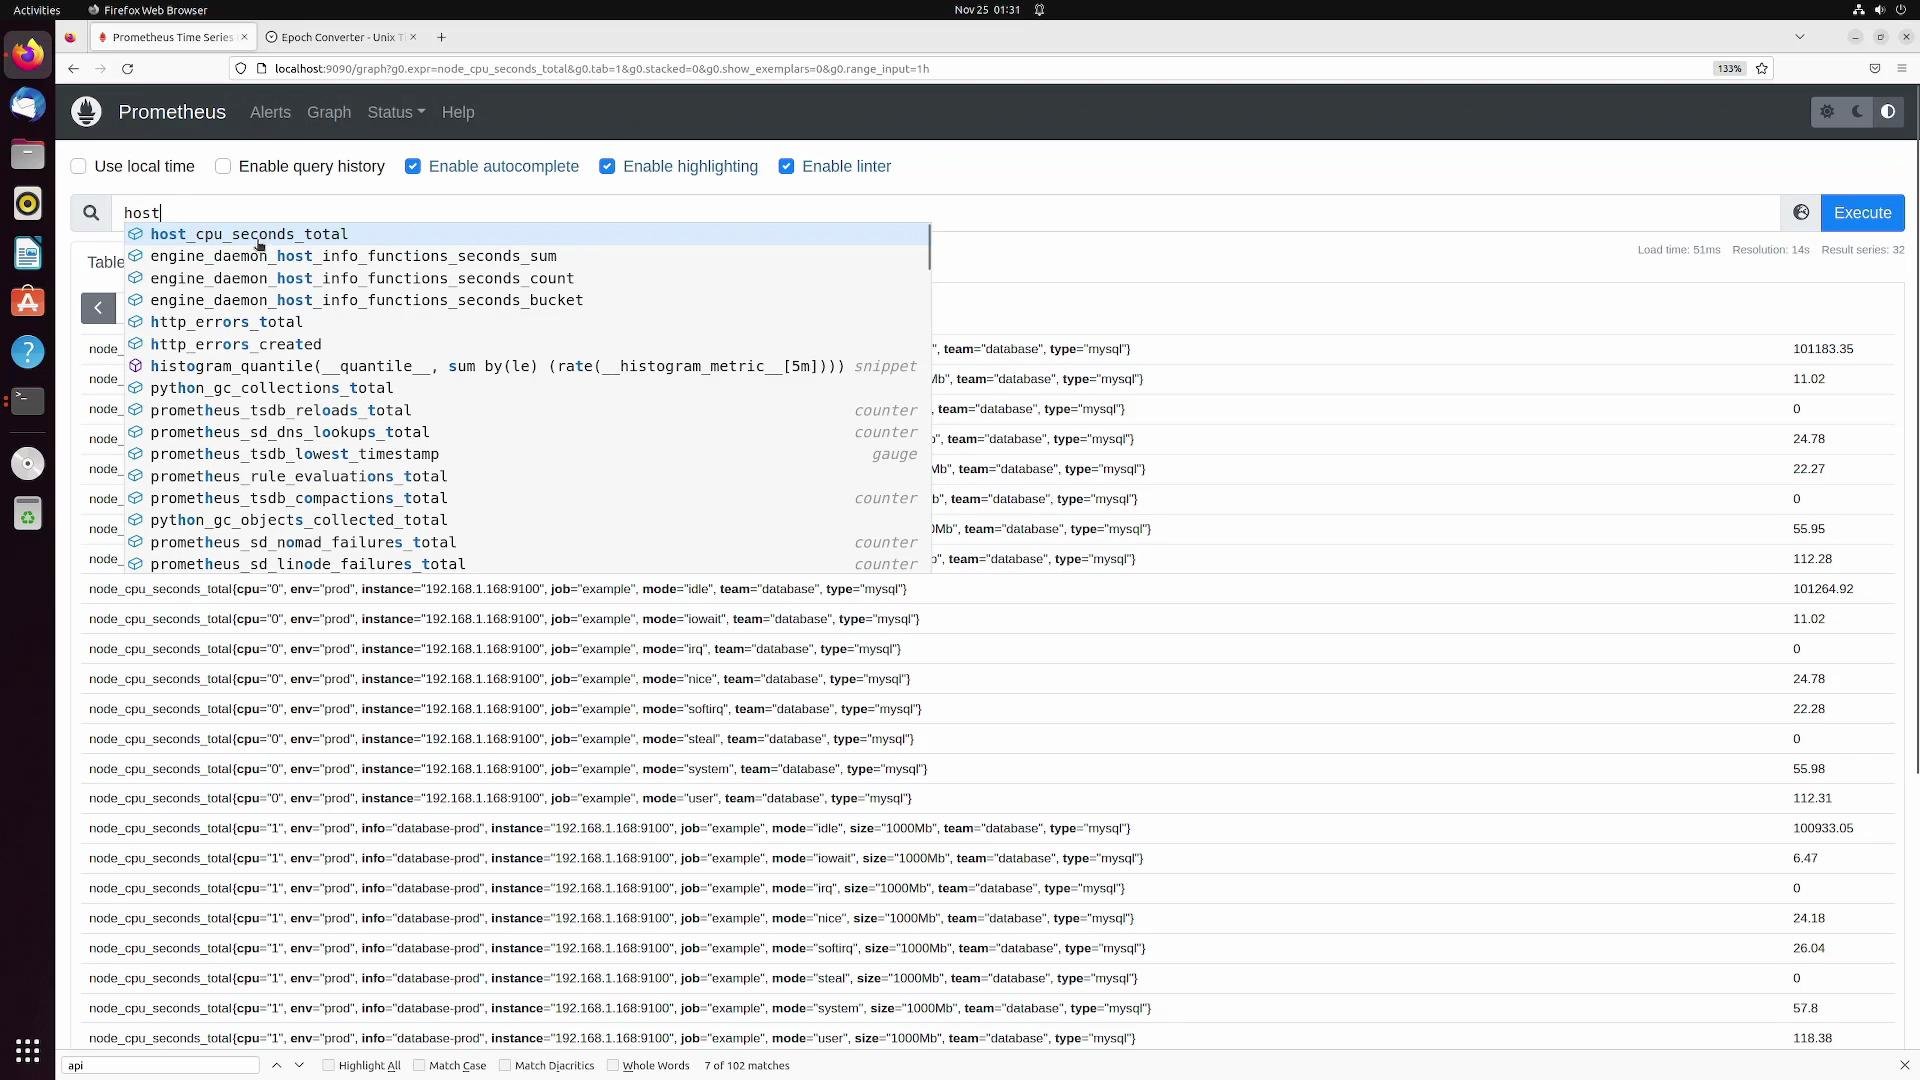
After reloading Prometheus and querying the new name you should see `host_cpu_seconds_total` in the expression browser.
Example target metadata from a file-based service discovery (for reference):
```text theme={null}
address = "192.168.1.168:9100"
_meta_filepath="/etc/prometheus/file-sd.json"
metrics_path = "/metrics"
scheme = "http"
scrape_interval = "15s"
scrape_timeout = "10s"
env="prod"
job="example"
size="1000Mb"
team="database"
type="mysql"
address = "node2"
_meta_filepath="/etc/prometheus/file-sd.json"
metrics_path = "/metrics"
scheme = "http"
scrape_interval = "15s"
scrape_timeout = "10s"
env="prod"
job="example"
size="1000Mb"
team="database"
type="mysql"
address = "node5"
_meta_filepath="/etc/prometheus/file-sd.json"
metrics_path = "/metrics"
scheme = "http"
scrape_interval = "15s"
scrape_timeout = "10s"
env="prod"
job="example"
size="3000Mb"
team="web"
type="wordpress"
```
Tip: `action: drop` behaves as the inverse of `keep` — drop all matched targets and keep the rest. Example:
```yaml theme={null}
scrape_configs:
- job_name: "prometheus"
static_configs:
- targets: ["localhost:9090"]
- job_name: "nodes"
relabel_configs:
- source_labels: [env]
regex: prod
action: drop
file_sd_configs:
- files:
- file-sd.json
```
After reloading with `action: drop`, targets with `env=prod` are removed and other targets remain.
### Combine labels into a new target label (replace)
Create a new target label `info` that concatenates `team` and `env` (e.g. `database-prod`):
```yaml theme={null}
scrape_configs:
- job_name: "nodes"
relabel_configs:
- source_labels: [team, env]
regex: (.*);(.*)
action: replace
target_label: info
replacement: $1-$2
file_sd_configs:
- files:
- file-sd.json
```
Notes:
* When multiple `source_labels` are provided, Prometheus joins them with semicolons before matching the `regex`.
* `$1`, `$2` refer to the first and second captured groups from the regex.
### Remove a discovered label (labeldrop / labelkeep)
To drop a discovered label such as `size`, use `labeldrop`:
```yaml theme={null}
scrape_configs:
- job_name: "nodes"
relabel_configs:
- regex: size
action: labeldrop
file_sd_configs:
- files:
- file-sd.json
```
Use `labelkeep` if you want to keep only specific labels and drop the rest.
Table: Common relabel actions
| Action | Purpose | Example | |
| ----------- | ------------------------------------------- | -------------------------------------------------------- | ------ |
| `keep` | Keep only matched targets | `action: keep` with `source_labels: [env]` `regex: prod` | |
| `drop` | Drop matched targets | `action: drop` with `source_labels: [env]` `regex: prod` | |
| `replace` | Create/replace a label value | Use `replacement` and `target_label` | |
| `labeldrop` | Remove matching labels from target metadata | `action: labeldrop` `regex: size` | |
| `labelkeep` | Keep matching labels only | `action: labelkeep` \`regex: env | team\` |
Careful with `keep`/`drop` rules: a single `keep` can unintentionally drop many targets. When filtering, verify with the Service Discovery UI and reload Prometheus to confirm the effect.
***
## 2) metric\_relabel\_configs (post-scrape): modify metrics and metric labels
Use `metric_relabel_configs` to transform metrics after they are scraped. This is useful to:
* Rename metric names
* Drop or keep specific metrics
* Rename metric labels or copy label values
Remember: metric names are represented as a label whose key is `__name__`. To match/rename a metric use `source_labels: [__name__]` and `target_label: __name__`.
### Rename a metric (change metric name)
Rename `node_cpu_seconds_total` to `host_cpu_seconds_total`:
```yaml theme={null}
scrape_configs:
- job_name: "nodes"
metric_relabel_configs:
- source_labels: [__name__]
regex: node_cpu_seconds_total
action: replace
replacement: host_cpu_seconds_total
target_label: __name__
file_sd_configs:
- files:
- file-sd.json
```
After reloading Prometheus and querying the new name you should see `host_cpu_seconds_total` in the expression browser.
 ### Keep or drop entire metrics
Keep only `node_arp_entries` (drop all other metrics for the job/instance):
```yaml theme={null}
scrape_configs:
- job_name: "nodes"
metric_relabel_configs:
- source_labels: [__name__]
regex: node_arp_entries
action: keep
file_sd_configs:
- files:
- file-sd.json
```
If you instead use `action: drop`, the matched metrics will be removed and all others will be retained.
Example metric (for reference):
```Prometheus theme={null}
node_arp_entries{device="enp03", env="prod", instance="192.168.1.168:9100", job="example", size="1000MB", team="database", type="mysql"}
```
You will often see a few default Prometheus metrics retained (like `scrape_duration_seconds`, `scrape_samples_*`) depending on your rules.
### Rename a metric label (e.g., mountpoint → path)
To rename a metric label key such as `mountpoint` to `path` for metrics like `node_filesystem_avail_bytes`:
```yaml theme={null}
scrape_configs:
- job_name: "nodes"
metric_relabel_configs:
- source_labels: [mountpoint]
regex: (.*)
action: replace
target_label: path
replacement: $1
file_sd_configs:
- files:
- file-sd.json
```
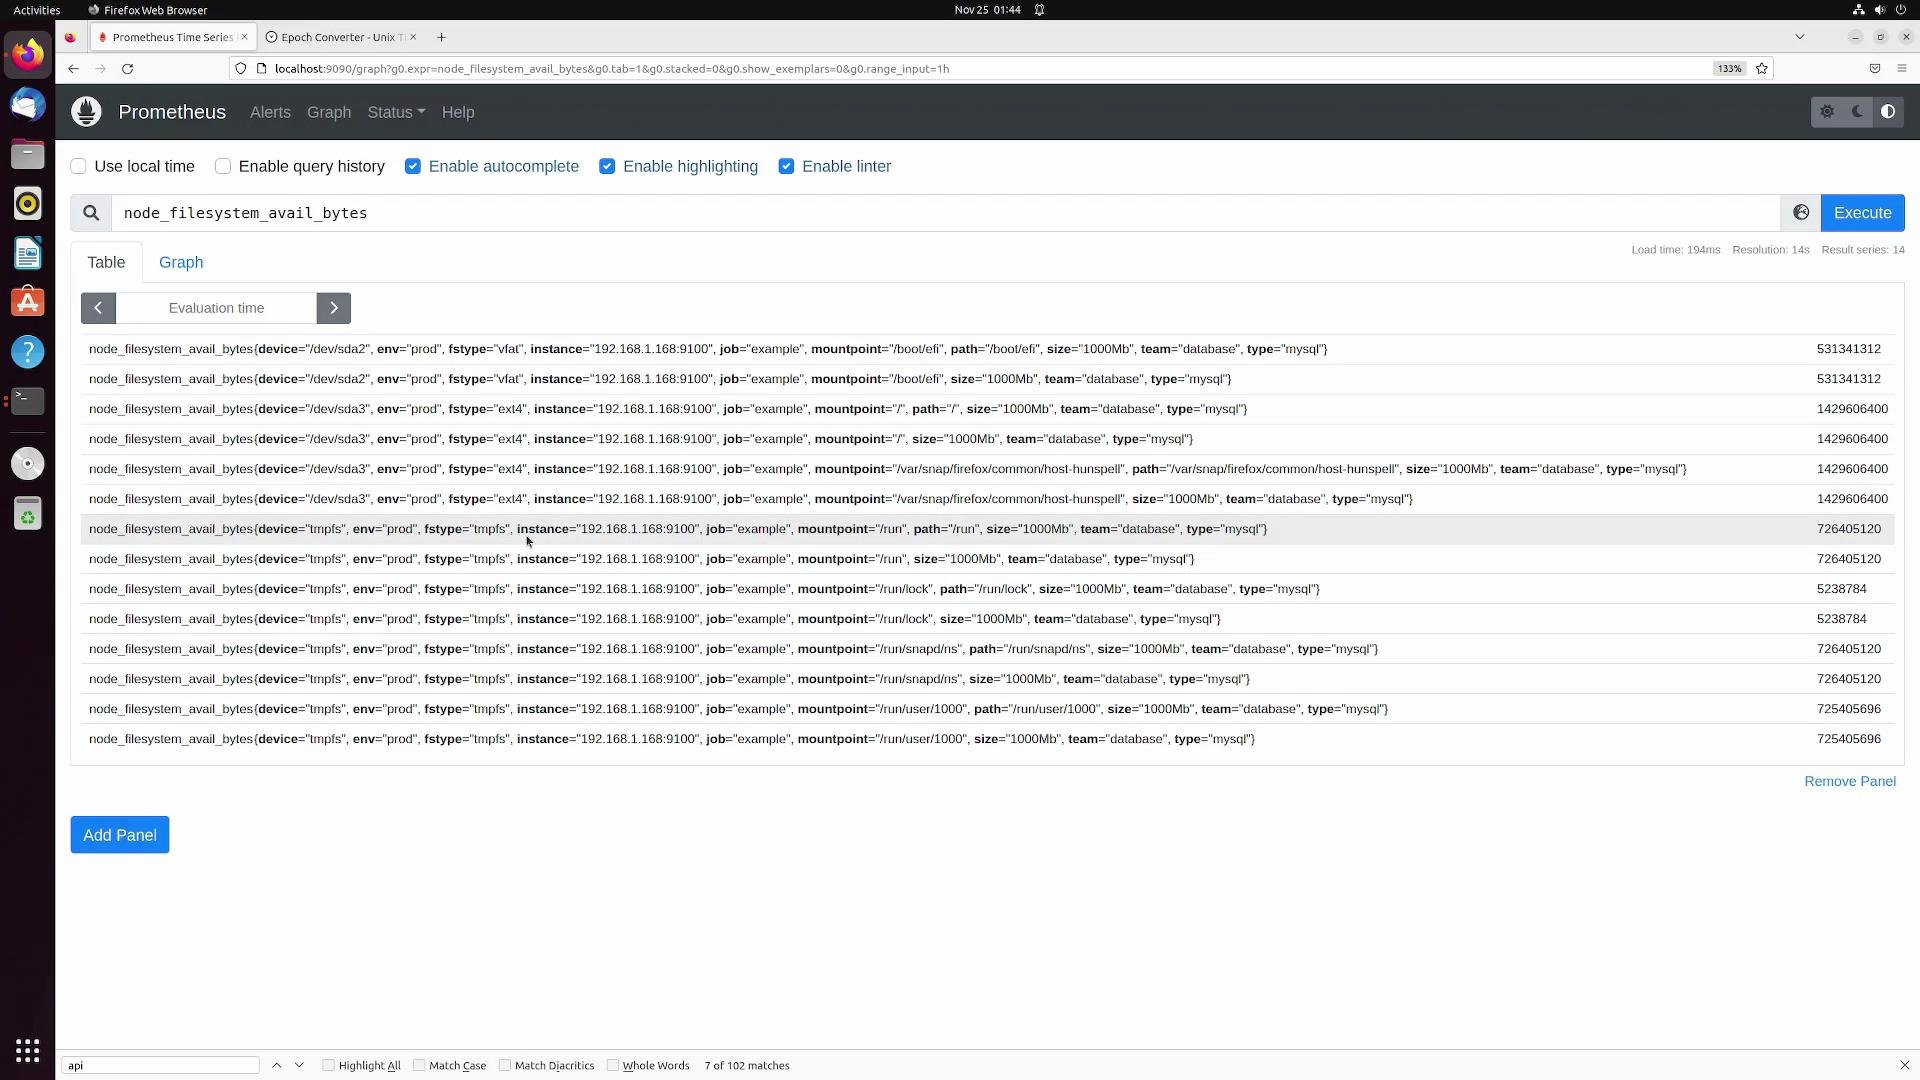
* This creates a new label `path` with the value of `mountpoint`.
* The original `mountpoint` label still exists after this operation. To remove it, add another metric relabel rule using `action: labeldrop` to drop `mountpoint`.
After applying and reloading, the `path` label will appear in metric output:
### Keep or drop entire metrics
Keep only `node_arp_entries` (drop all other metrics for the job/instance):
```yaml theme={null}
scrape_configs:
- job_name: "nodes"
metric_relabel_configs:
- source_labels: [__name__]
regex: node_arp_entries
action: keep
file_sd_configs:
- files:
- file-sd.json
```
If you instead use `action: drop`, the matched metrics will be removed and all others will be retained.
Example metric (for reference):
```Prometheus theme={null}
node_arp_entries{device="enp03", env="prod", instance="192.168.1.168:9100", job="example", size="1000MB", team="database", type="mysql"}
```
You will often see a few default Prometheus metrics retained (like `scrape_duration_seconds`, `scrape_samples_*`) depending on your rules.
### Rename a metric label (e.g., mountpoint → path)
To rename a metric label key such as `mountpoint` to `path` for metrics like `node_filesystem_avail_bytes`:
```yaml theme={null}
scrape_configs:
- job_name: "nodes"
metric_relabel_configs:
- source_labels: [mountpoint]
regex: (.*)
action: replace
target_label: path
replacement: $1
file_sd_configs:
- files:
- file-sd.json
```
* This creates a new label `path` with the value of `mountpoint`.
* The original `mountpoint` label still exists after this operation. To remove it, add another metric relabel rule using `action: labeldrop` to drop `mountpoint`.
After applying and reloading, the `path` label will appear in metric output:
 ***
## Summary
* Use `relabel_configs` to control which targets Prometheus scrapes and to manipulate target labels before scraping.
* Use `metric_relabel_configs` to transform metric names and metric labels after scraping, and to drop unneeded metrics to reduce storage and cardinality.
* Always test relabel rules in a controlled environment and verify results using the Service Discovery and Expression Browser UI.
Useful references
* Prometheus relabeling documentation: [https://prometheus.io/docs/prometheus/latest/configuration/relabeling/](https://prometheus.io/docs/prometheus/latest/configuration/relabeling/)
* Prometheus scrape configuration: [https://prometheus.io/docs/prometheus/latest/configuration/configuration/#scrape\_configurations](https://prometheus.io/docs/prometheus/latest/configuration/configuration/#scrape_configurations)
***
## Summary
* Use `relabel_configs` to control which targets Prometheus scrapes and to manipulate target labels before scraping.
* Use `metric_relabel_configs` to transform metric names and metric labels after scraping, and to drop unneeded metrics to reduce storage and cardinality.
* Always test relabel rules in a controlled environment and verify results using the Service Discovery and Expression Browser UI.
Useful references
* Prometheus relabeling documentation: [https://prometheus.io/docs/prometheus/latest/configuration/relabeling/](https://prometheus.io/docs/prometheus/latest/configuration/relabeling/)
* Prometheus scrape configuration: [https://prometheus.io/docs/prometheus/latest/configuration/configuration/#scrape\_configurations](https://prometheus.io/docs/prometheus/latest/configuration/configuration/#scrape_configurations)