Prometheus Certified Associate (PCA)
Alerting
Alertmanager Demo
In this guide, we'll walk you through configuring several alerts and receivers in Alertmanager to receive notifications via Slack. In this demonstration, both Prometheus and Alertmanager are already installed and running.
Verifying Services
Before proceeding, ensure that Alertmanager is active on its default port (9093). Run the following command:
systemctl status alertmanager
You should see an output similar to:
● alertmanager.service - Alert Manager
Loaded: loaded (/etc/systemd/system/alertmanager.service; enabled; vendor preset: enabled)
Active: active (running) since Sun 2022-11-27 18:34:40 EST; 3min 59s ago
Main PID: 375825 (alertmanager)
Tasks: 6 (limit: 9457)
Memory: 15.1M
CPU: 270ms
CGroup: /system.slice/alertmanager.service
└─375825 /usr/local/bin/alertmanager --config.file=/etc/alertmanager/alertmanager.yml --storage.path=/var/lib/alertm
Nov 27 18:37:11 user1 alertmanager[375825]: ts=2022-11-27T23:37:11.041Z caller=dispatch.go:354 level=error component=dispatcher m
Nov 27 18:37:11 user1 alertmanager[375825]: ts=2022-11-27T23:37:11.041Z caller=notify.go:732 level=warn component=dispatcher rece
Nov 27 18:37:11 user1 alertmanager[375825]: ts=2022-11-27T23:37:11.041Z caller=dispatch.go:354 level=error component=dispatcher m
Nov 27 18:38:11 user1 alertmanager[375825]: ts=2022-11-27T23:38:11.041Z caller=dispatch.go:354 level=error component=dispatcher m
Nov 27 18:38:11 user1 alertmanager[375825]: ts=2022-11-27T23:38:11.041Z caller=notify.go:732 level=warn component=dispatcher rece
Likewise, verify that Prometheus is running by executing:
systemctl status prometheus
The expected output will be similar to:
prometheus.service - Prometheus
Loaded: loaded (/etc/systemd/system/prometheus.service; enabled; vendor preset: enabled)
Active: active (running) since Sun 2022-11-27 18:37:37 EST; 1min 18s ago
Main PID: 376122 (prometheus)
Tasks: 6 (limit: 9457)
Memory: 39.4M
CPU: 190ms
CGroup: /system.slice/prometheus.service
└─376122 /usr/local/bin/prometheus --config.file /etc/prometheus/prometheus.yml --storage.tsdb.path /var/lib/prometh
Service Coexistence
Both Alertmanager and Prometheus can run on the same server for demonstration purposes, although they do not require co-location in production environments.
Configuring Prometheus Alert Rules
Begin by creating a rules file in the Prometheus configuration directory. Change to the /etc/prometheus/
directory and create a file called rules.yaml
:
cd /etc/prometheus/
sudo touch rules.yaml
Edit the file to define your alert rules. For instance, to create a rule that checks whether a node is down, add the following configuration:
groups:
- name: my-alerts
interval: 15s
rules:
- alert: NodeDown
expr: up{job="node"} == 0
for: 2m
labels:
team: infra
env: prod
annotations:
message: "{{ .Labels.instance }} is currently down"
This rule evaluates the up
metric for the job labeled "node" and triggers an alert if it remains at zero for at least two minutes. The labels (team
and env
) add context to the alert, which can later be utilized in Alertmanager configurations.
Additional rules can be defined for other services. For example:
groups:
- name: my-alerts
interval: 15s
rules:
- alert: NodeDown
expr: up{job="node"} == 0
for: 0m
labels:
team: infra
env: prod
annotations:
message: "{{ .Labels.instance }} is currently down"
- alert: DatabaseDown
expr: up{job="dbl"} == 0
for: 0m
labels:
team: database
env: prod
annotations:
message: "{{ .Labels.instance }} is currently down"
- alert: DatabaseDown-dev
expr: up{job="node"} == 0
for: 0m
labels:
team: database
env: dev
annotations:
message: "{{ .Labels.instance }} is currently down"
After updating the rules.yaml
file, restart Prometheus to apply the new configuration:
sudo systemctl restart prometheus
Then, navigate to the alert section in the Prometheus web interface. Initially, you might see no alerts until Prometheus recognizes the new rules file. Update your prometheus.yml
configuration to include the rule_files
section:
global:
scrape_interval: 15s
scrape_timeout: 10s
rule_files:
- "rules.yaml"
scrape_configs:
- job_name: "prometheus"
static_configs:
- targets: ["localhost:9090"]
- job_name: "node"
static_configs:
- targets: ["192.168.1.168:9100"]
- job_name: "db1"
static_configs:
- targets: ["192.168.1.168:9200"]
- job_name: "db2"
static_configs:
- targets: ["192.168.1.168:9300", "192.168.1.168:9400"]
After saving changes, restart Prometheus again and refresh the browser. When the targets are active, alerts appear in a non-firing (green) state. To test alert triggering, you can stop the corresponding target services. Remember, rules with a for
value of zero will fire immediately once the condition is met.
Updating Rule Configurations
Below is an example that demonstrates multiple alert rule configurations:
- name: NodeDown
expr: up{job="node"} == 0
labels:
env: prod
team: infra
annotations:
message: '{{ .Labels.instance }} is currently down'
- name: DatabaseDown
expr: up{job="db1"} == 0
labels:
env: prod
team: database
annotations:
message: '{{ .Labels.instance }} is currently down'
- name: DatabaseDown-dev
expr: up{job="db2"} == 0
labels:
env: dev
team: database
annotations:
message: '{{ .Labels.instance }} is currently down'
If you wish to delay an alert after detecting a down instance, set the for
duration. For example, to delay the NodeDown alert by five minutes:
groups:
- name: my-alerts
interval: 15s
rules:
- alert: NodeDown
expr: up{job="node"} == 0
for: 5m
labels:
team: infra
env: prod
annotations:
message: "{{.Labels.instance}} is currently down"
- alert: DatabaseDown
expr: up{job="db1"} == 0
for: 0m
labels:
team: database
env: prod
annotations:
message: "{{.Labels.instance}} is currently down"
- alert: DatabaseDown-dev
expr: up{job="db2"} == 0
for: 0m
labels:
team: database
env: dev
annotations:
message: "{{.Labels.instance}} is currently down"
After editing both prometheus.yml
and rules.yaml
, restart Prometheus to apply changes:
sudo vi prometheus.yml
sudo systemctl restart prometheus
This will update each alert with the correct labels and firing conditions.
Configuring Alertmanager
Next, configure Prometheus to forward alerts to Alertmanager. Open the prometheus.yml
file and add an alerting section that specifies the Alertmanager target:
global:
scrape_interval: 15s
scrape_timeout: 10s
rule_files:
- "rules.yaml"
alerting:
alertmanagers:
- static_configs:
- targets: ["localhost:9093"]
scrape_configs:
- job_name: "prometheus"
static_configs:
- targets: ["localhost:9090"]
- job_name: "node"
static_configs:
- targets: ["192.168.1.168:9100"]
- job_name: "db1"
static_configs:
- targets: ["192.168.1.168:9200"]
- job_name: "db2"
static_configs:
- targets: ["192.168.1.168:9300", "192.168.1.168:9400"]
After saving your configuration, restart Prometheus:
sudo vi prometheus.yml
sudo systemctl restart prometheus
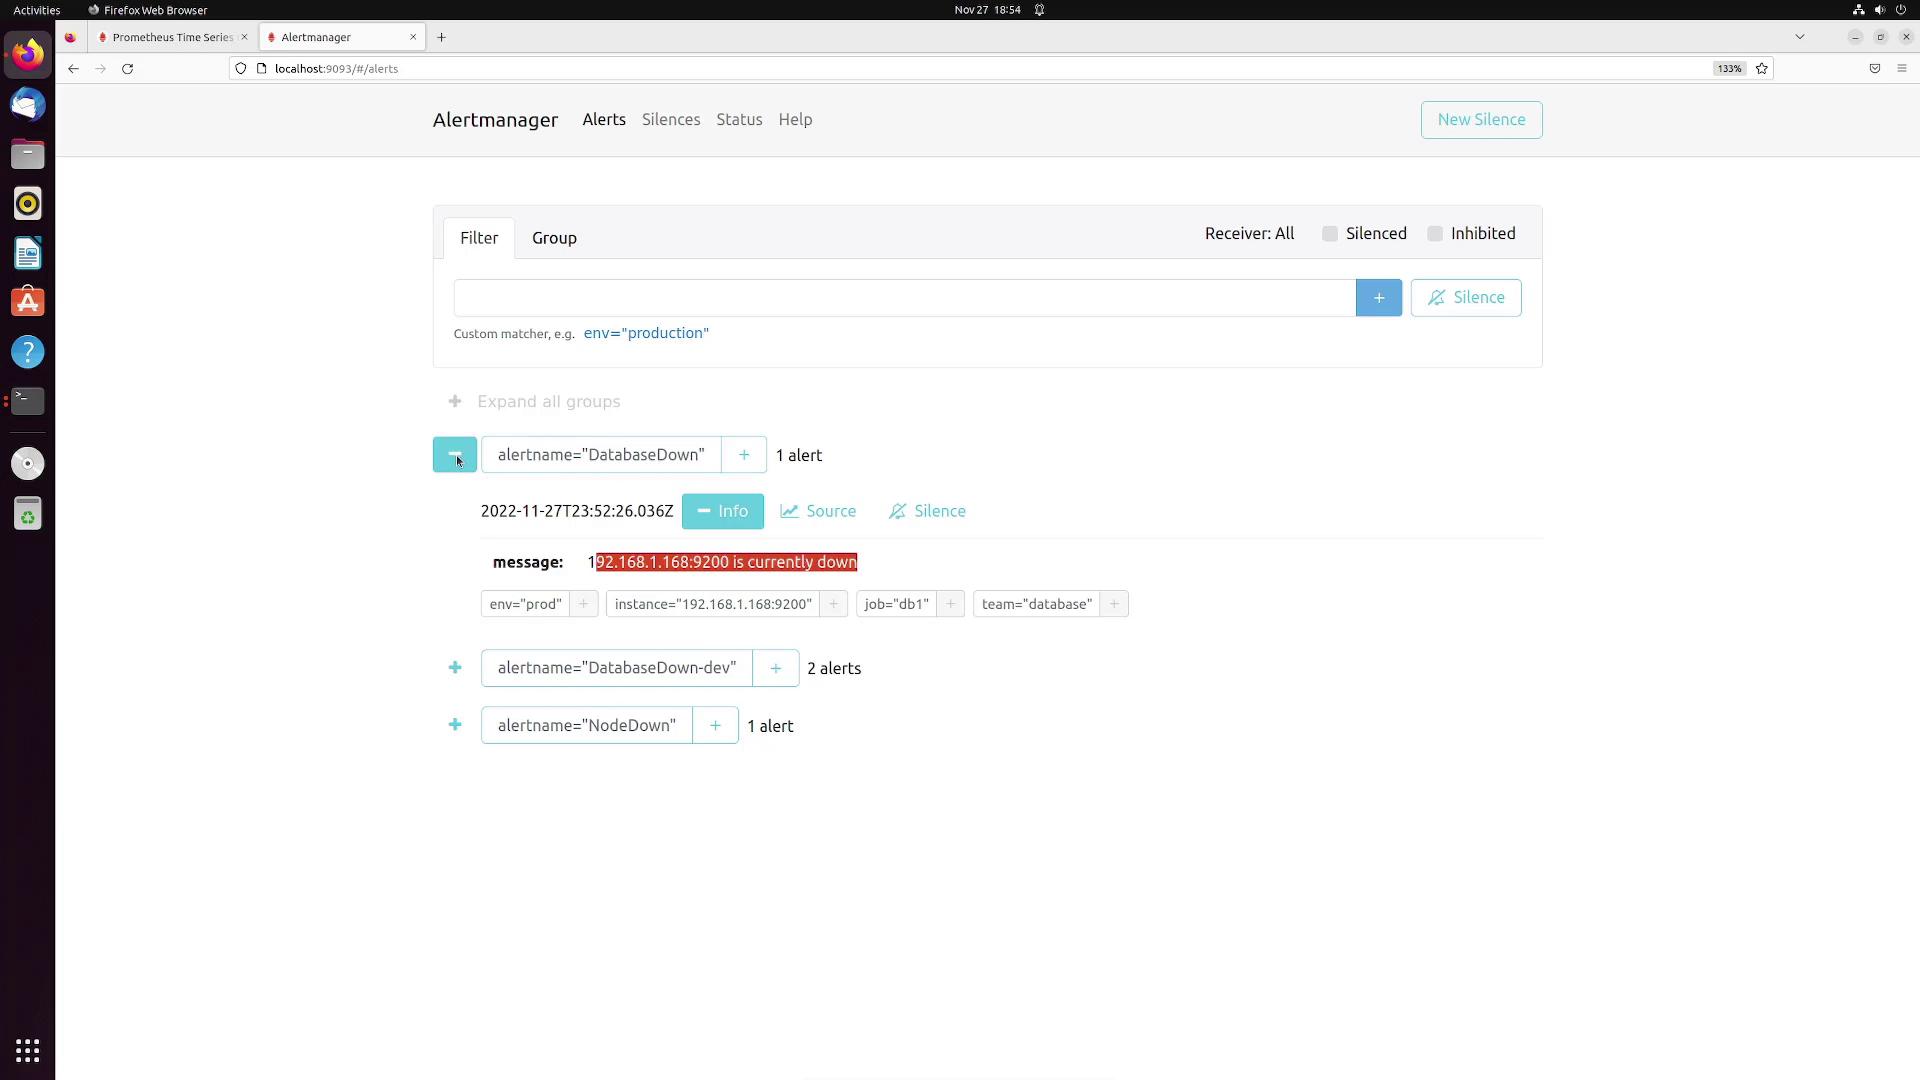
Then, open a browser tab and navigate to Alertmanager at localhost:9093
. After a few seconds, you should see alerts such as "DatabaseDown," "DatabaseDown-dev," and "NodeDown" displayed with associated labels and annotation messages.
For example, the image below shows the Alertmanager interface displaying a "DatabaseDown" alert:
Customizing Alertmanager Routes and Receivers
By default, Alertmanager groups alerts by the alertname
. A typical default configuration looks like this:
route:
group_by: ['alertname']
group_wait: 30s
group_interval: 1m
repeat_interval: 2m
receiver: 'web.hook'
receivers:
- name: 'web.hook'
webhook_configs:
- url: 'http://127.0.0.1:5001/'
To create more specific notification routes, you can group alerts based on additional labels such as team
and env
. For example, to route alerts for jobs matching node
, db1
, or db2
to Slack, update your configuration as follows:
route:
group_by: ['alertname']
group_wait: 30s
group_interval: 1m
repeat_interval: 2m
receiver: 'web.hook'
routes:
- match_re:
job: (node|db1|db2)
group_by: ['team', 'env']
receiver: slack
receivers:
- name: 'web.hook'
webhook_configs:
- url: 'http://127.0.0.1:5001/'
Now, define the Slack receiver configuration with your Slack API URL, target channel, title, and message template:
route:
group_by: ['alertname']
group_wait: 30s
group_interval: 1m
repeat_interval: 2m
receiver: 'web.hook'
routes:
- match_re:
job: (node|db1|db2)
group_by: ['team', 'env']
receiver: slack
receivers:
- name: 'web.hook'
webhook_configs:
- url: 'http://127.0.0.1:5001/'
- name: slack
slack_configs:
- api_url: https://hooks.slack.com/services/T04DB7ZS9PS/B04CMGVTYF4/KQy6AyXbfSwc43qAKFzYxJR
channel: '#alerts'
title: '{{.GroupLabels.team}} has alerts in env: {{.GroupLabels.env}}'
text: '{{range .Alerts}} {{.Annotations.message}}{{"\n"}}{{end}}'
After saving these changes, restart Alertmanager:
sudo systemctl restart alertmanager
Verifying the Alert Flow
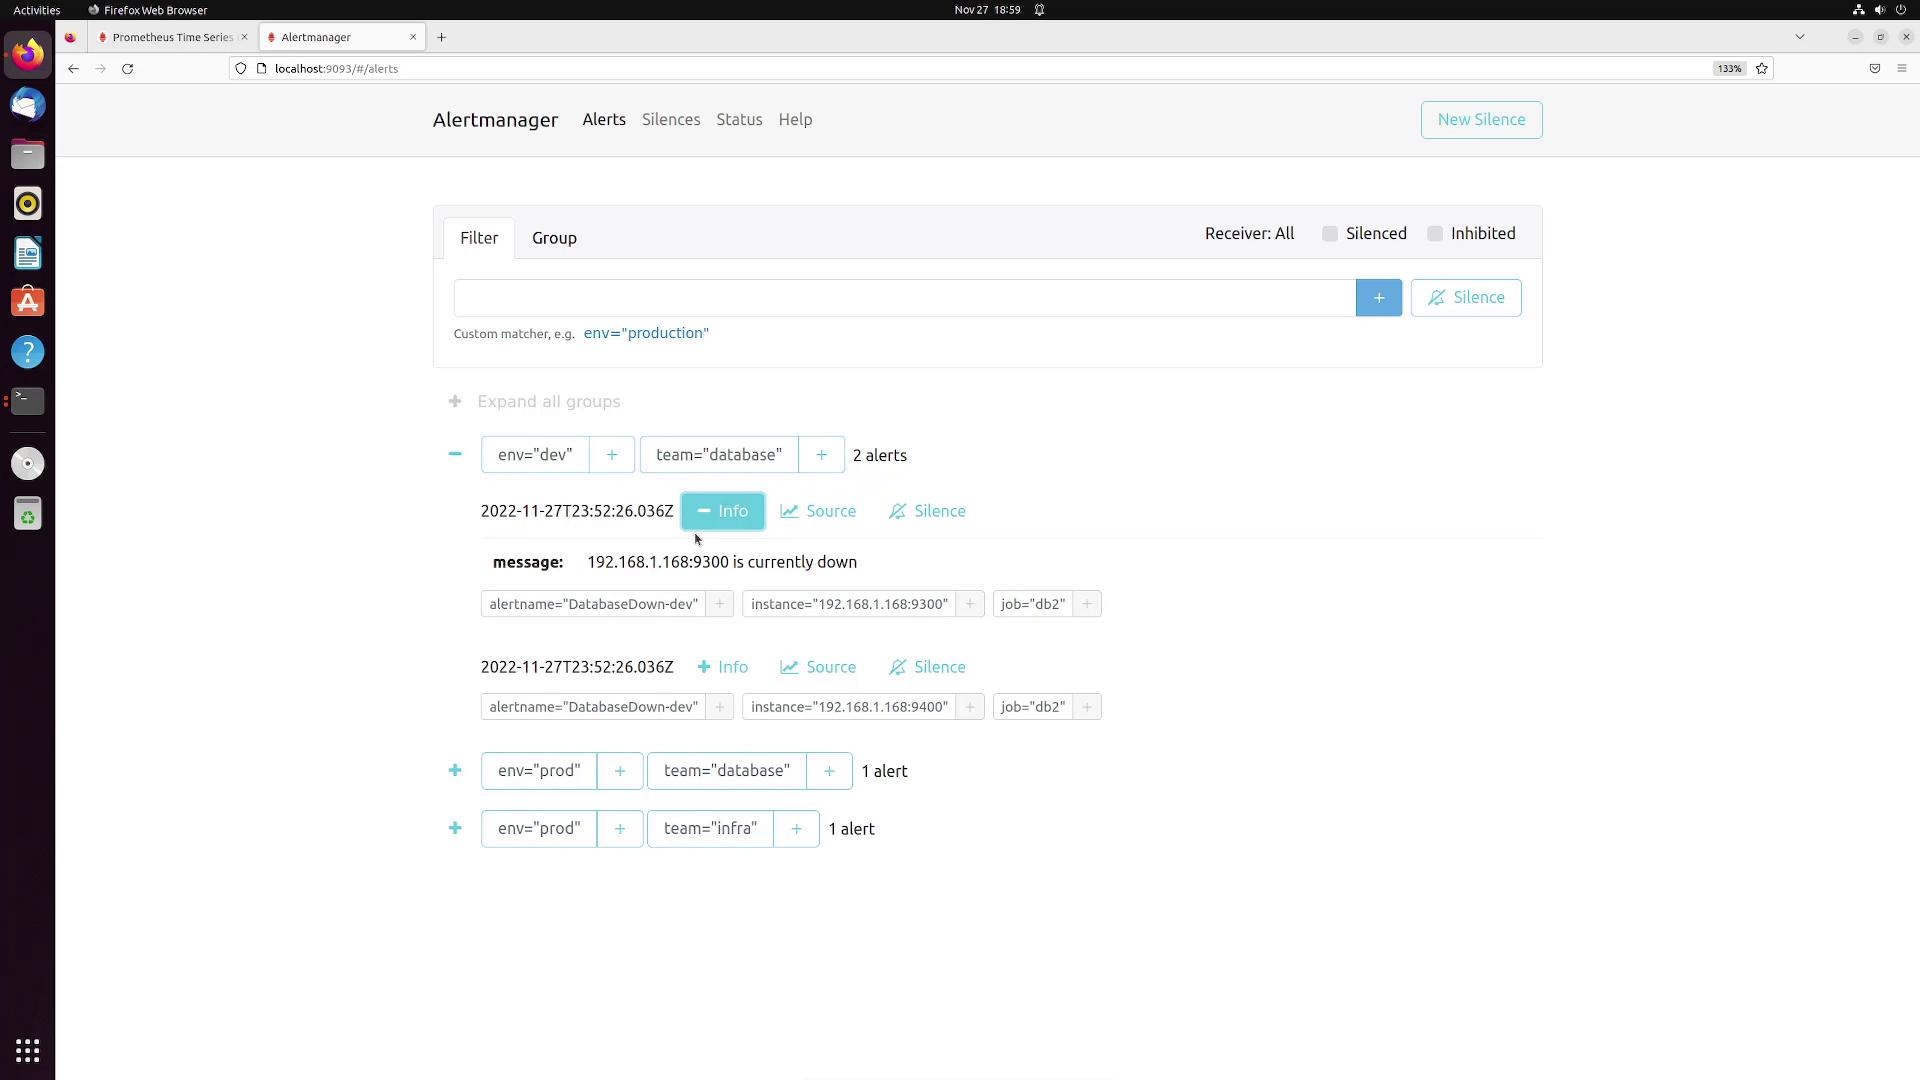
Once Alertmanager’s web interface is refreshed, you should see alerts grouped by their unique team
and env
label combinations. For instance, you may observe alert groups for:
- Environment: prod, Team: database
- Environment: prod, Team: infra
- Environment: dev, Team: database
The image below illustrates the alert grouping in Alertmanager:
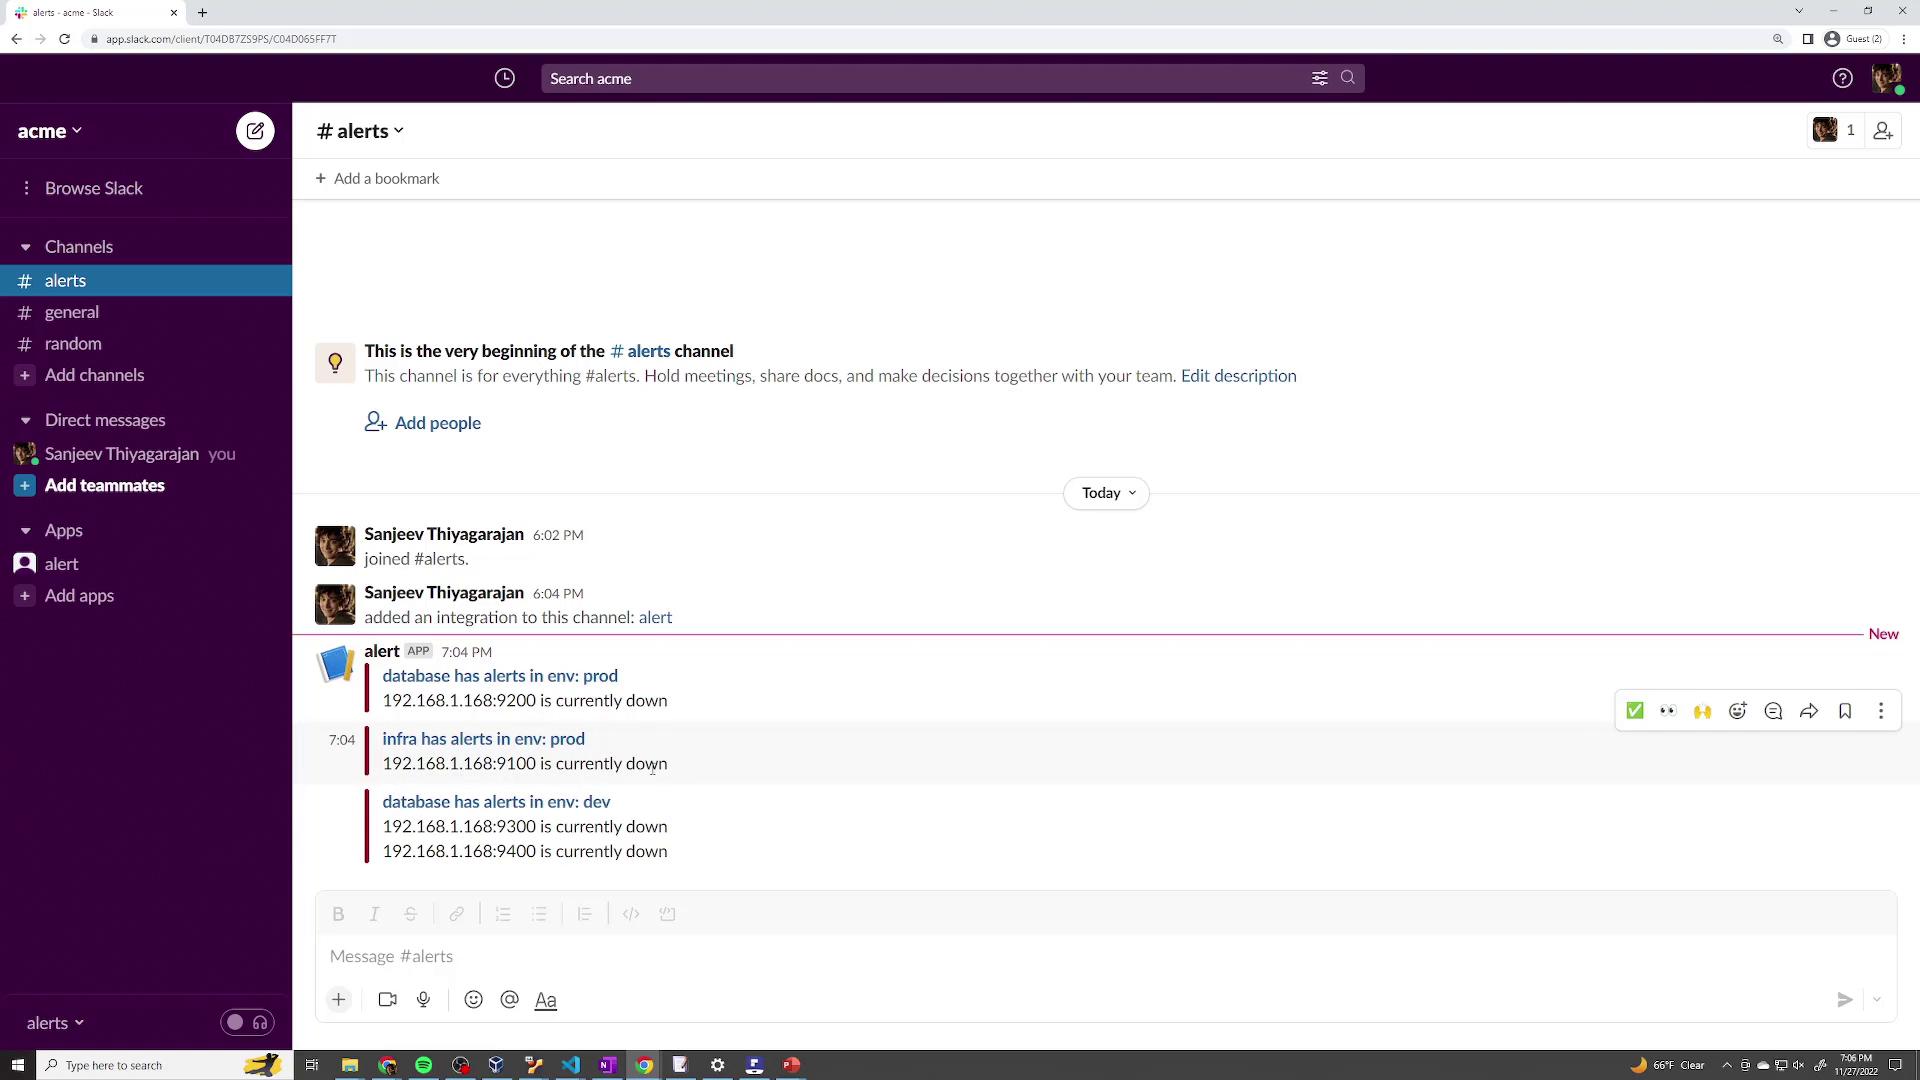
Switch over to your Slack workspace and go to the channel specified (e.g., #alerts
). You should see notifications similar to the following:
database has alerts in env: prod
192.168.1.168:9200 is currently down
infra has alerts in env: prod
192.168.1.168:9100 is currently down
database has alerts in env: dev
192.168.1.168:9300 is currently down
192.168.1.168:9400 is currently down
The Slack workspace image below demonstrates how these notifications appear:
Conclusion
This article has guided you through configuring Prometheus alert rules, integrating them with Alertmanager, and setting up Slack notifications. The same principles apply when integrating with other services such as PagerDuty or WeChat; you simply need to update the configuration settings accordingly.
Happy monitoring!
Watch Video
Watch video content