This article focuses on Prometheuss alerting functionality for maintaining production system health through automated alerting mechanisms.
In this article, we focus on Prometheus’s alerting functionality—a vital feature for maintaining production system health. In production, unexpected issues such as low disk space can occur at any time. For instance, if a server runs critically low on available disk space in the middle of the night, manual observation is unlikely. An automated alerting mechanism is therefore essential.Prometheus supports the creation of alerting rules that evaluate using standard PromQL expressions. When the expression returns one or more vector elements—that is, when the condition is met—Prometheus triggers an alert. For example, to monitor low disk space, you might use an expression like the following:
In this example, an alert is generated if the metric value for available bytes falls below 1000. Moreover, if there are several results from the same query, multiple alerts will be triggered.
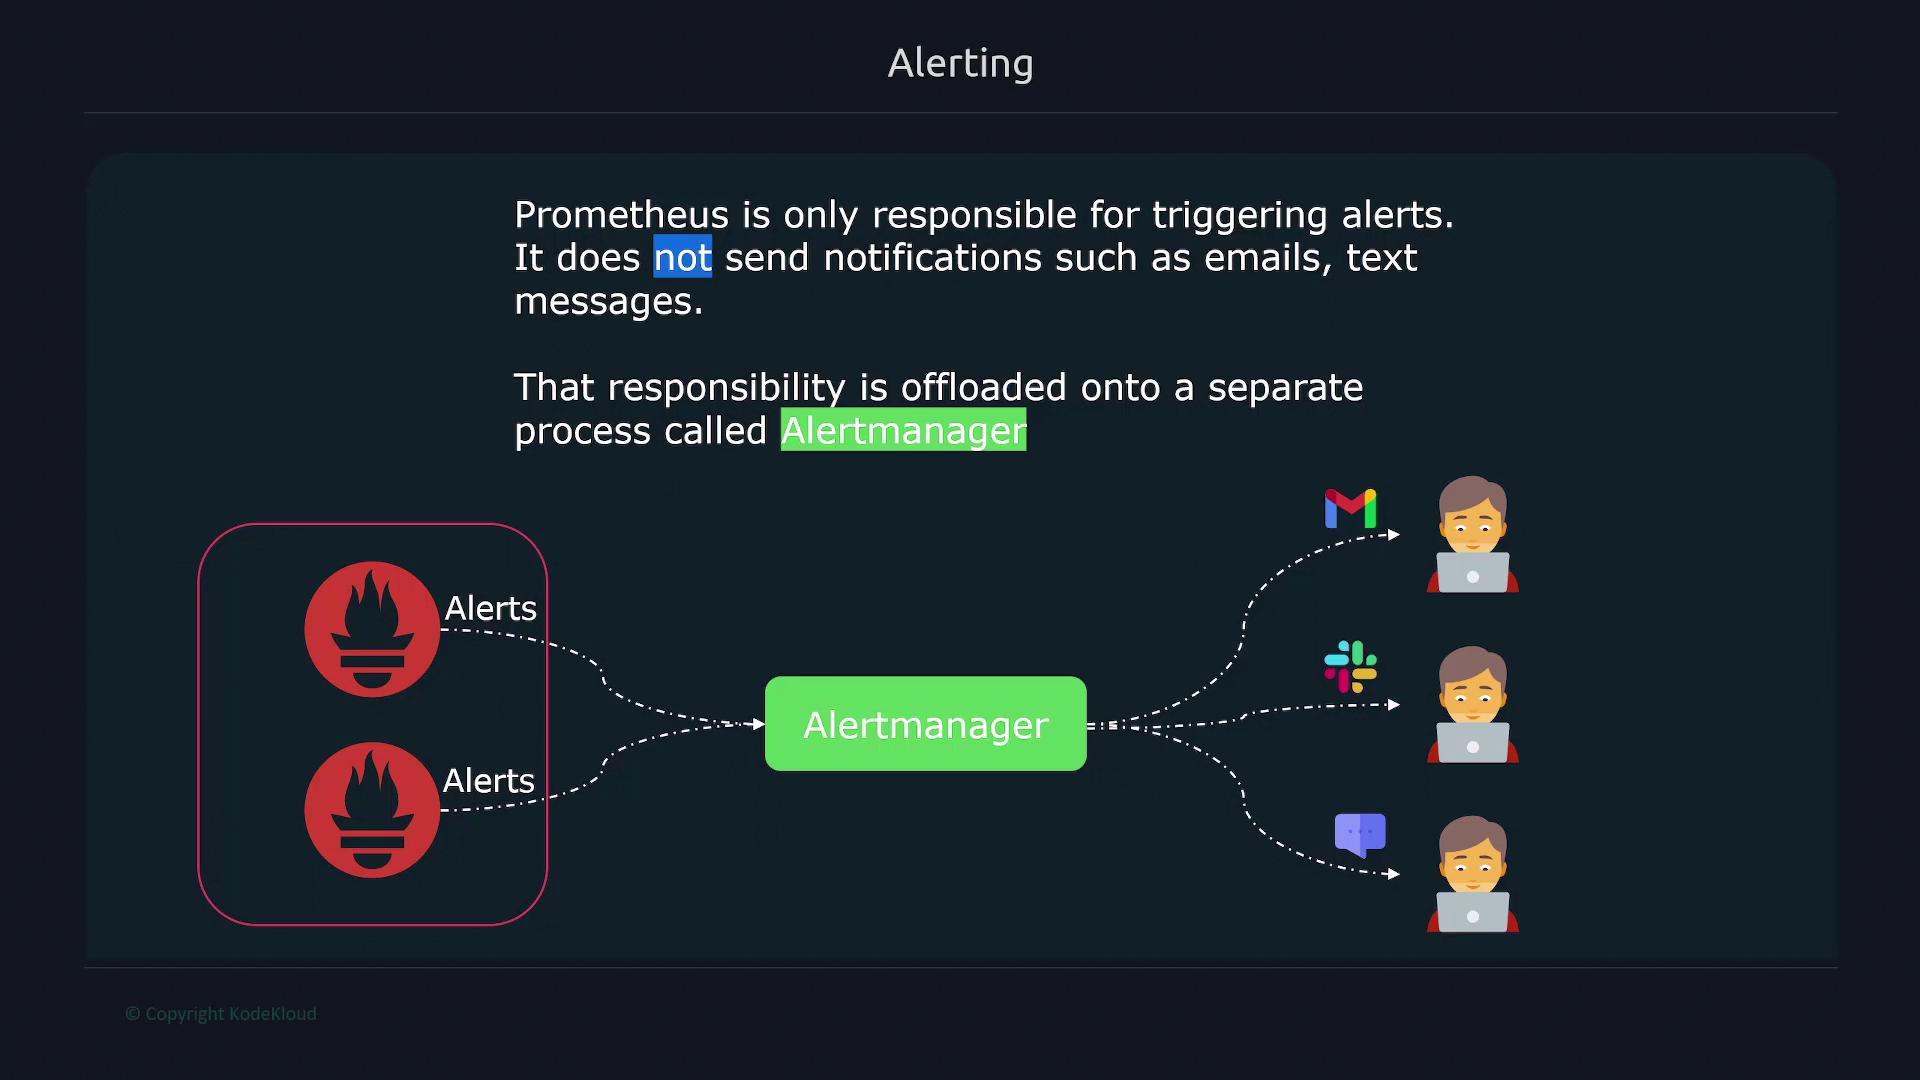
Prometheus is solely responsible for firing alerts. It does not send notifications such as emails or SMS messages directly.
Instead, Prometheus relays alert data to Alertmanager, a dedicated component that handles notifications by integrating with various communication tools like email, Slack, or paging services. This separation of concerns allows a single Alertmanager to manage alerts from multiple Prometheus servers across different environments.
Alerting rules in Prometheus are configured in a way similar to recording rules and can be combined within the same rule group. For example, consider the configuration below that includes both a recording rule and an alerting rule:
In this configuration, the “LowMemory” alert is triggered when the percentage of free memory drops below 20% for at least 3 minutes.Another common alert scenario involves monitoring the health of nodes. An alert expression that checks whether a node is down uses the up metric; if this metric equals zero, the target is considered unreachable. To avoid false positives from transient issues like brief network interruptions, the for clause is utilized to ensure that the alert is triggered only if the condition persists over a defined period. For example:
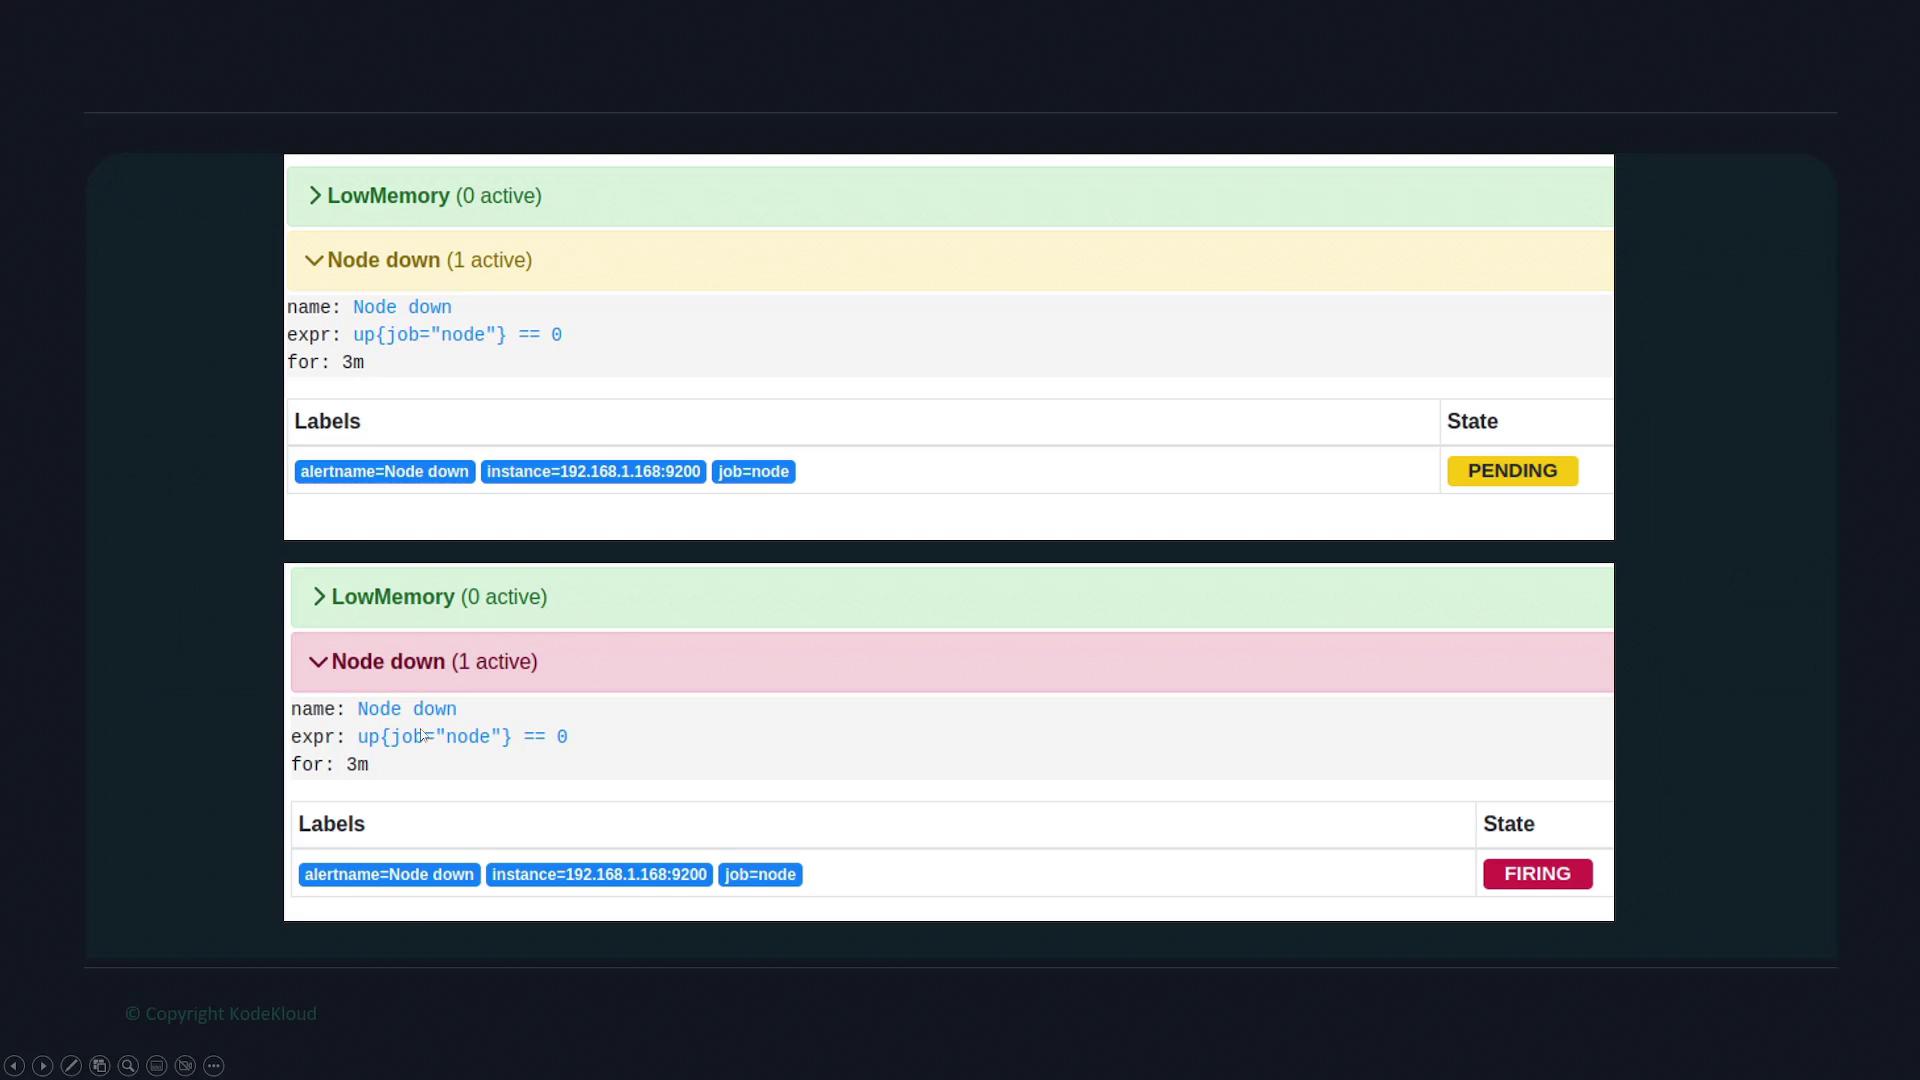
With this setting, a node initially enters a pending state if the down condition is detected, and only transitions into the firing state if it remains down for 3 minutes.
Prometheus classifies alerts into three states:
Inactive: No alert condition is met (expression returns no results).
Pending: Alert conditions have been detected but have not persisted long enough.
Firing: Alert conditions have been continuously met for the specified duration, making the alert active.
For instance, if a node remains down for 5 minutes, the alert will move from pending to firing. Here is an example configuration for such a scenario:
When you navigate to the Alerts tab on the Prometheus dashboard, you’ll see all the current alert statuses. Inactive alerts are shown in green. Once an alert condition is detected, the alert appears as pending and then shifts to the firing state if the condition persists beyond the configured duration.