Monitoring Applications and Kubernetes Components
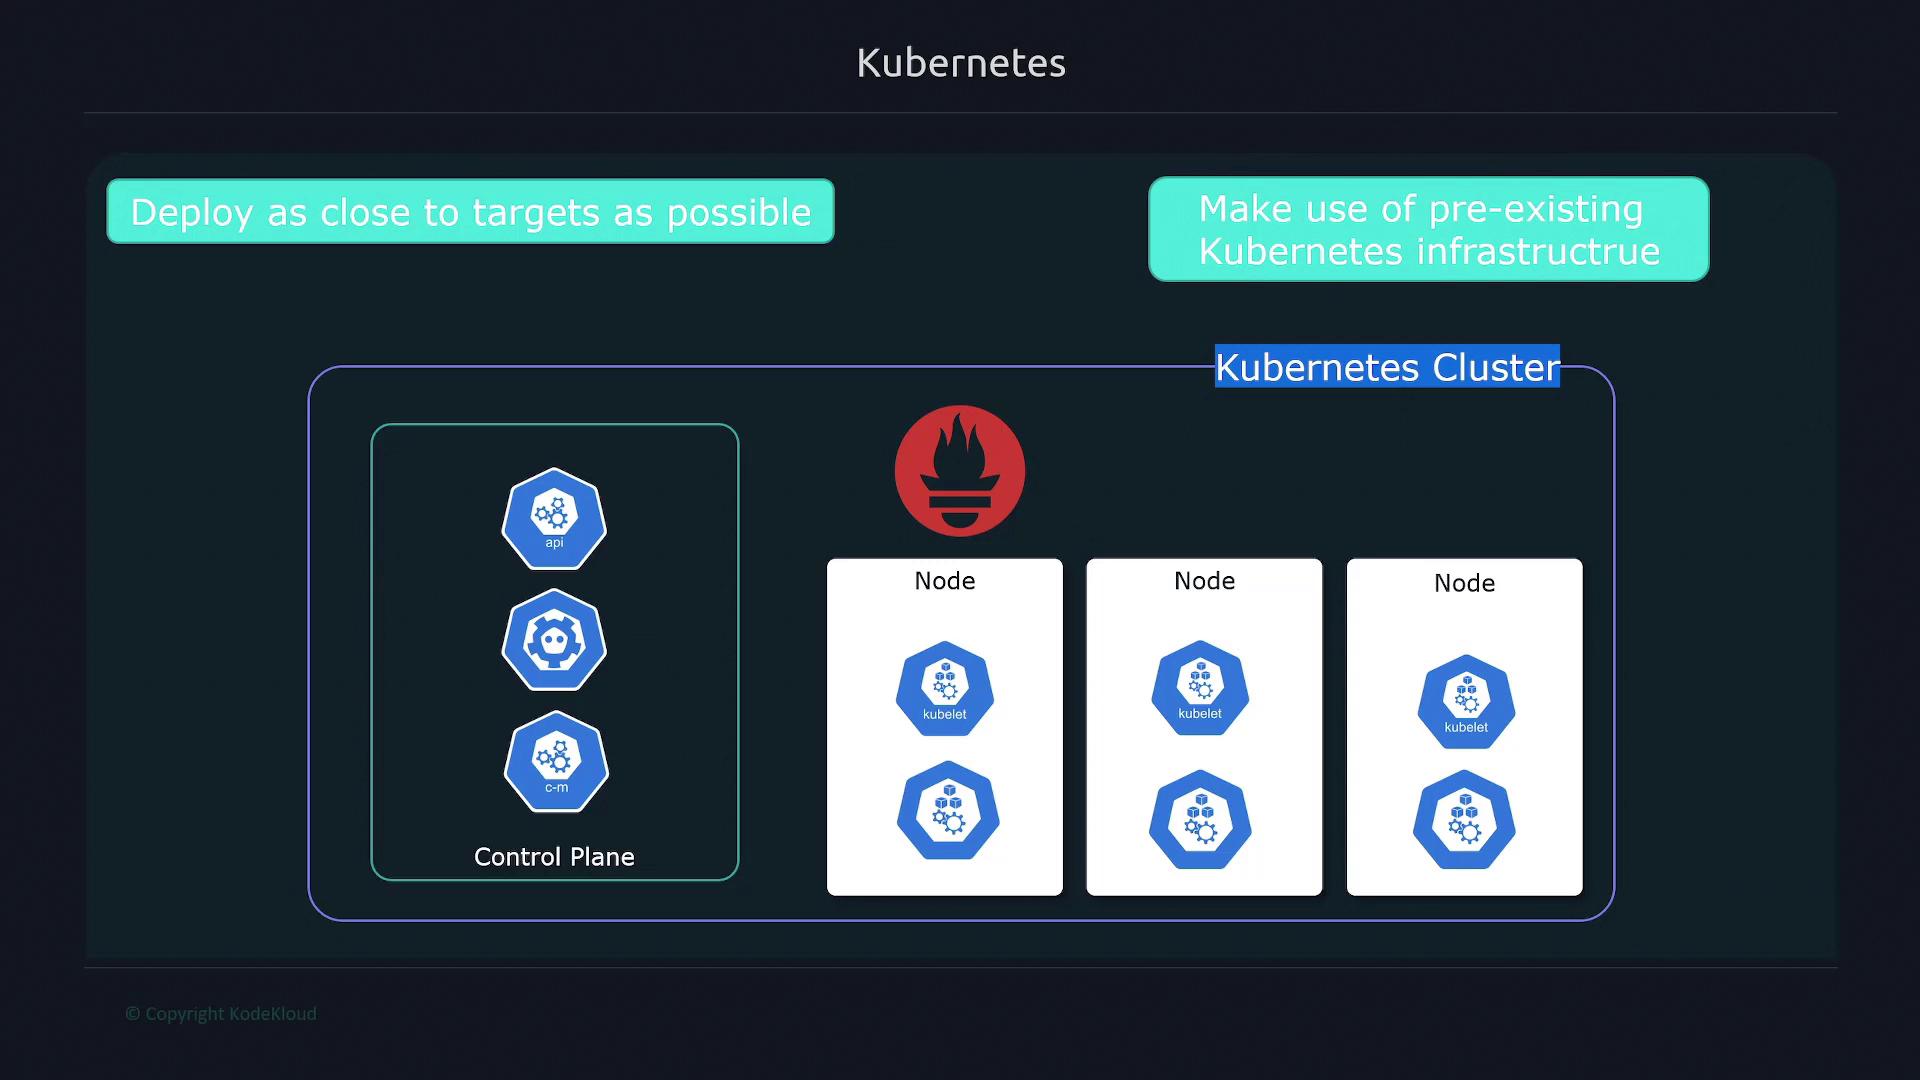
There are two primary monitoring focuses in a Kubernetes environment:-
Applications Running on Kubernetes
These include workloads such as web applications, web servers, and other services deployed in the cluster. -
The Kubernetes Cluster Itself
Monitoring cluster-level metrics requires tracking control plane components—like the API server, kube-scheduler, and CoreDNS—as well as the kubelet process that functions similarly to cAdvisor for container metrics. Additionally, kube-state metrics provide insights into deployments, pods, and other objects, while Node Exporter gathers essential statistics on CPU, memory, and network usage from each Linux host.
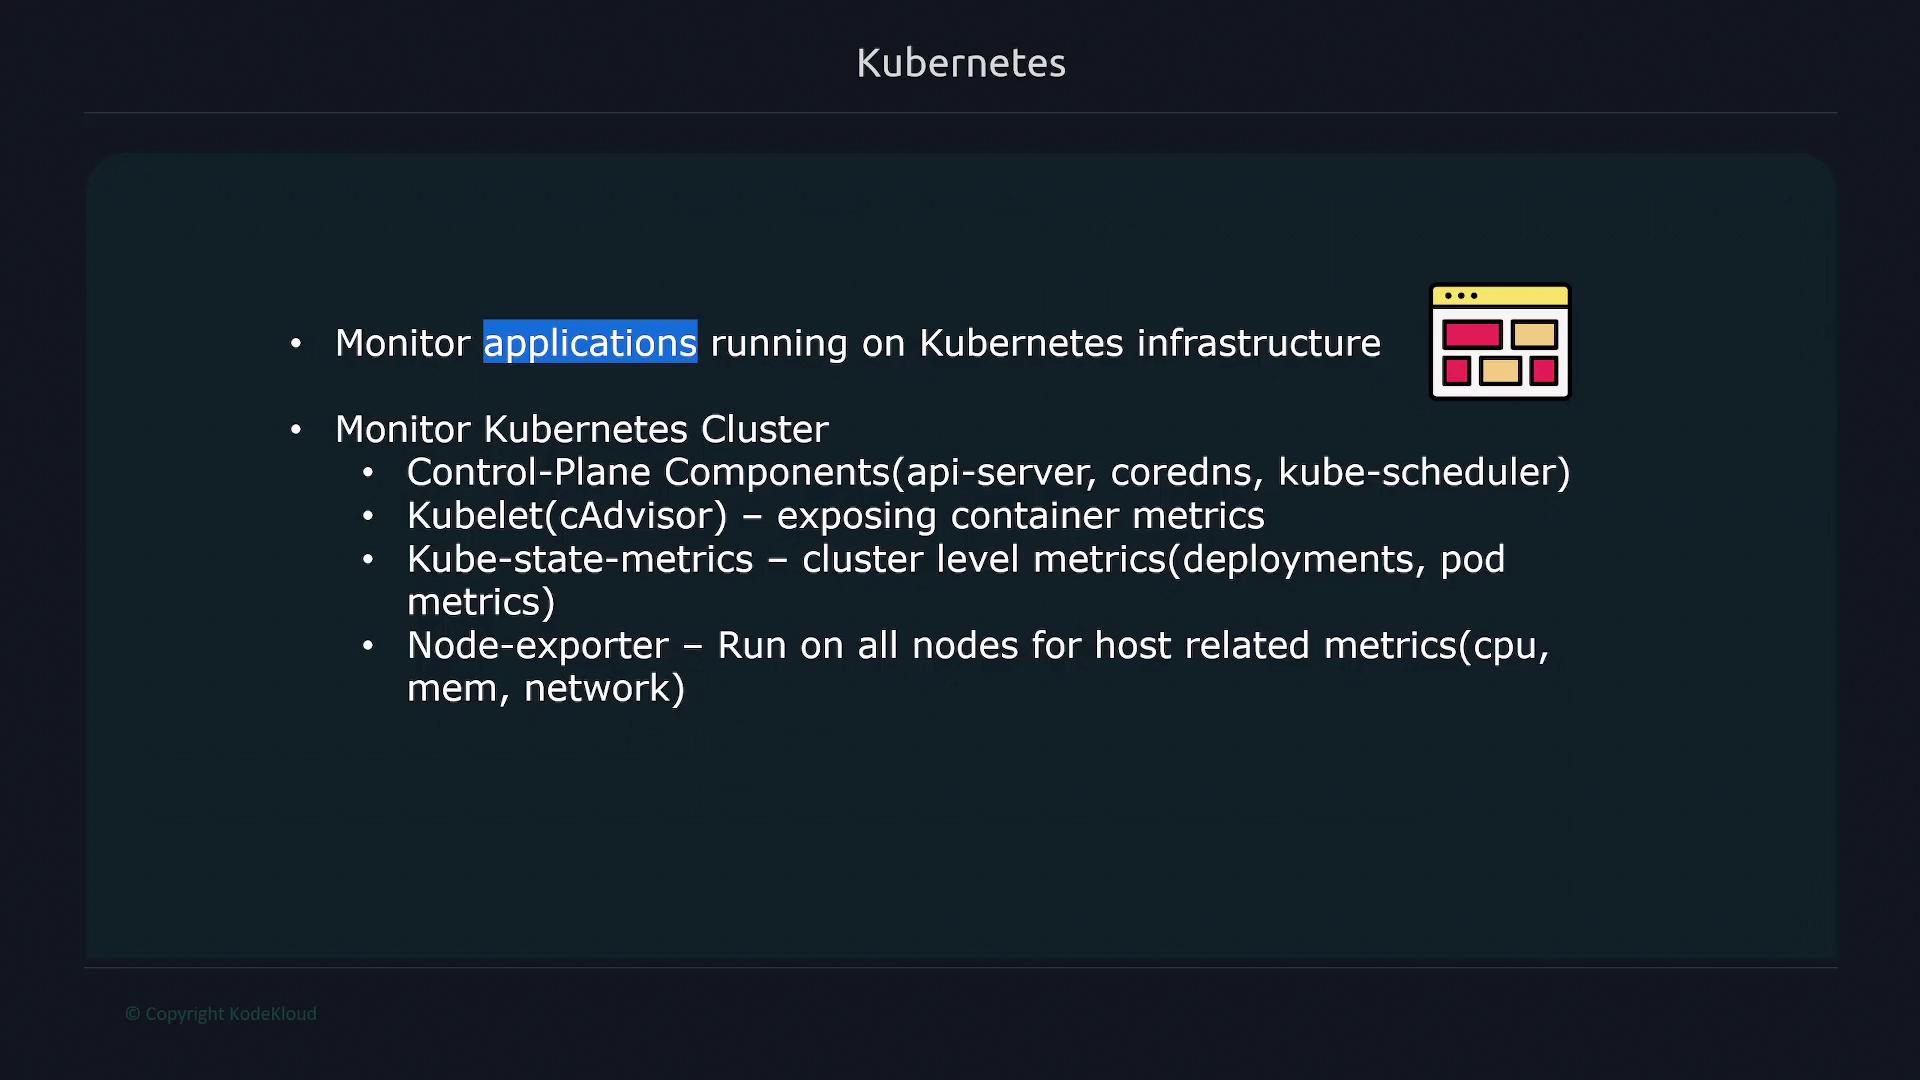
By default, Kubernetes does not expose cluster-level metrics for pods, deployments, or services. To collect these metrics, you must deploy the kube-state metrics container, which then advertises critical information directly to Prometheus.
Deploying Node Exporter with DaemonSets
Every Kubernetes node ought to run a Node Exporter process to expose vital statistics such as CPU usage, memory consumption, and network throughput. Although you could manually install Node Exporter on each node or include it in your node images, a more efficient solution in Kubernetes is to deploy Node Exporter using a DaemonSet. This approach ensures that every node, including any new nodes joining the cluster, will automatically run the Node Exporter pod.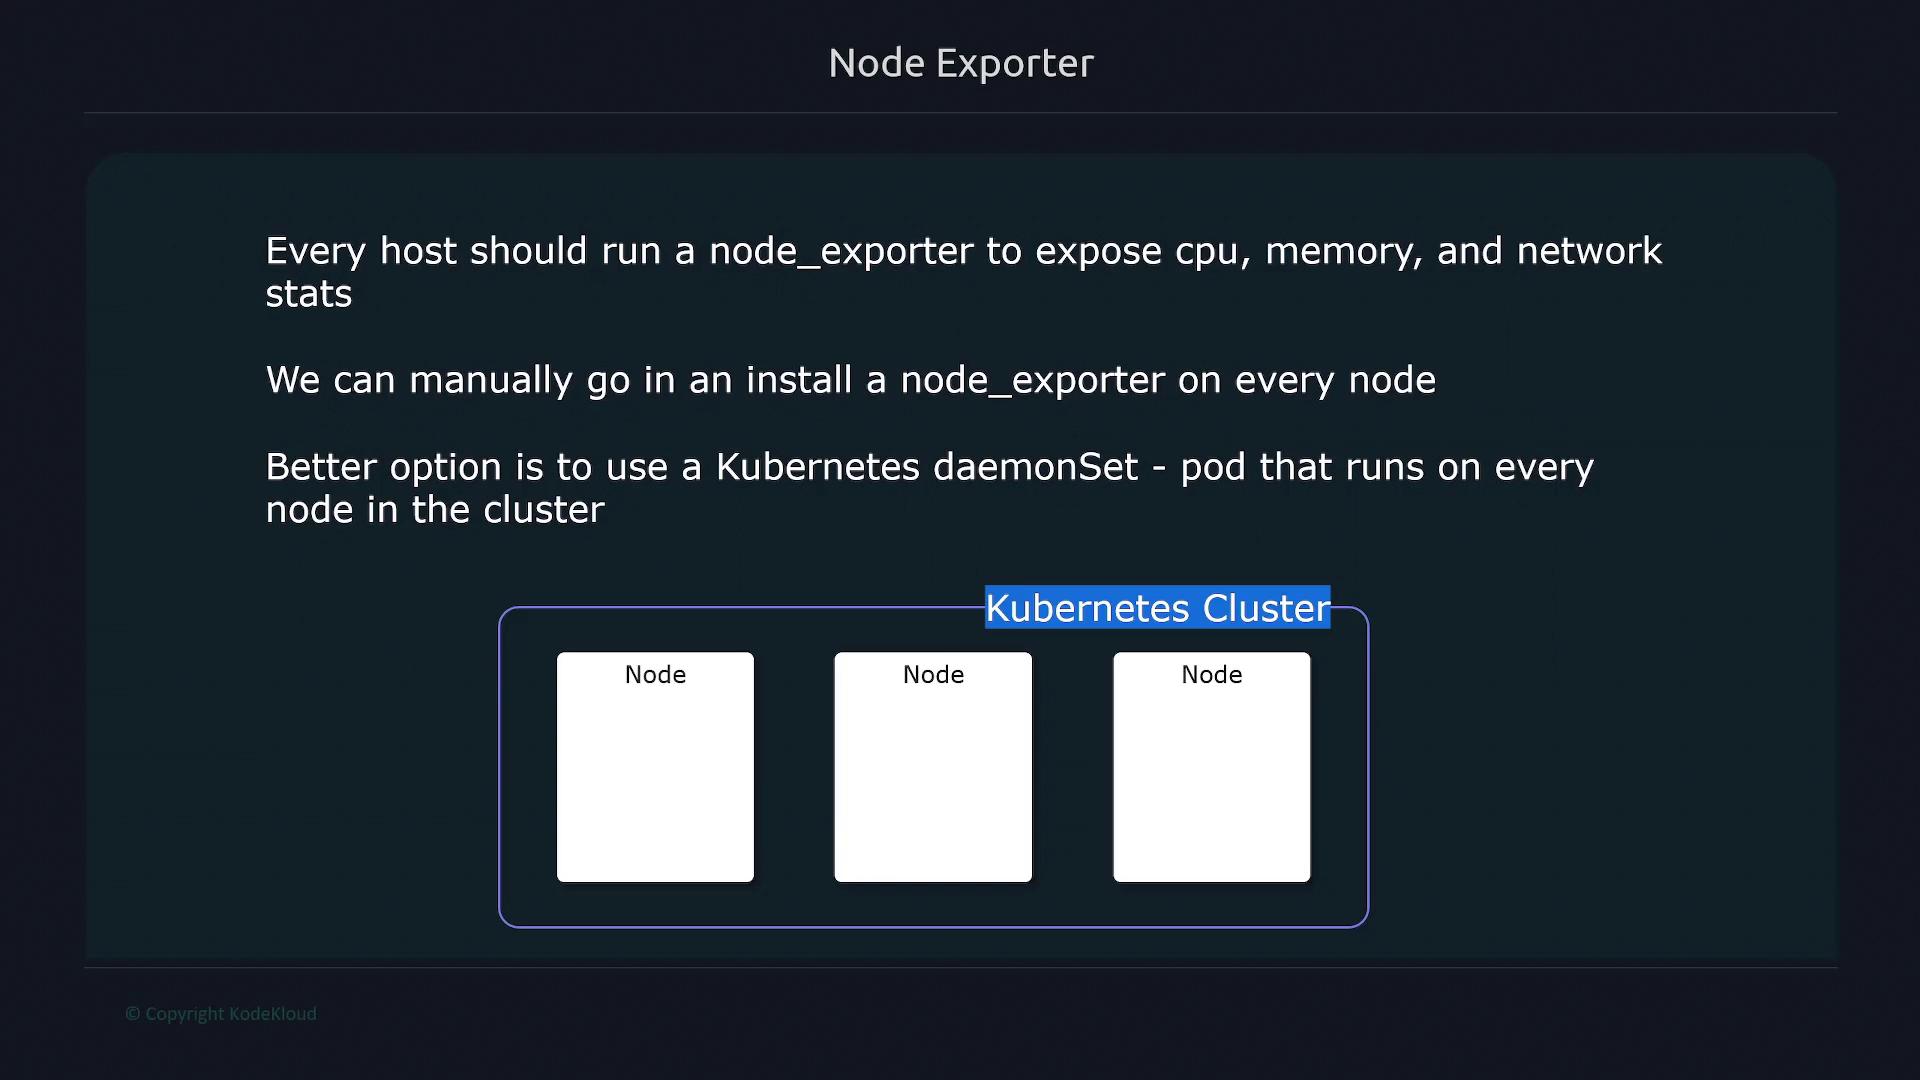

Deploying Prometheus on Kubernetes
There are two main strategies for deploying Prometheus on a Kubernetes cluster:1. Manual Deployment
This method involves manually creating various Kubernetes objects such as Deployments, Services, ConfigMaps, and Secrets. While this approach provides granular control, it requires extensive configuration and is generally more complex.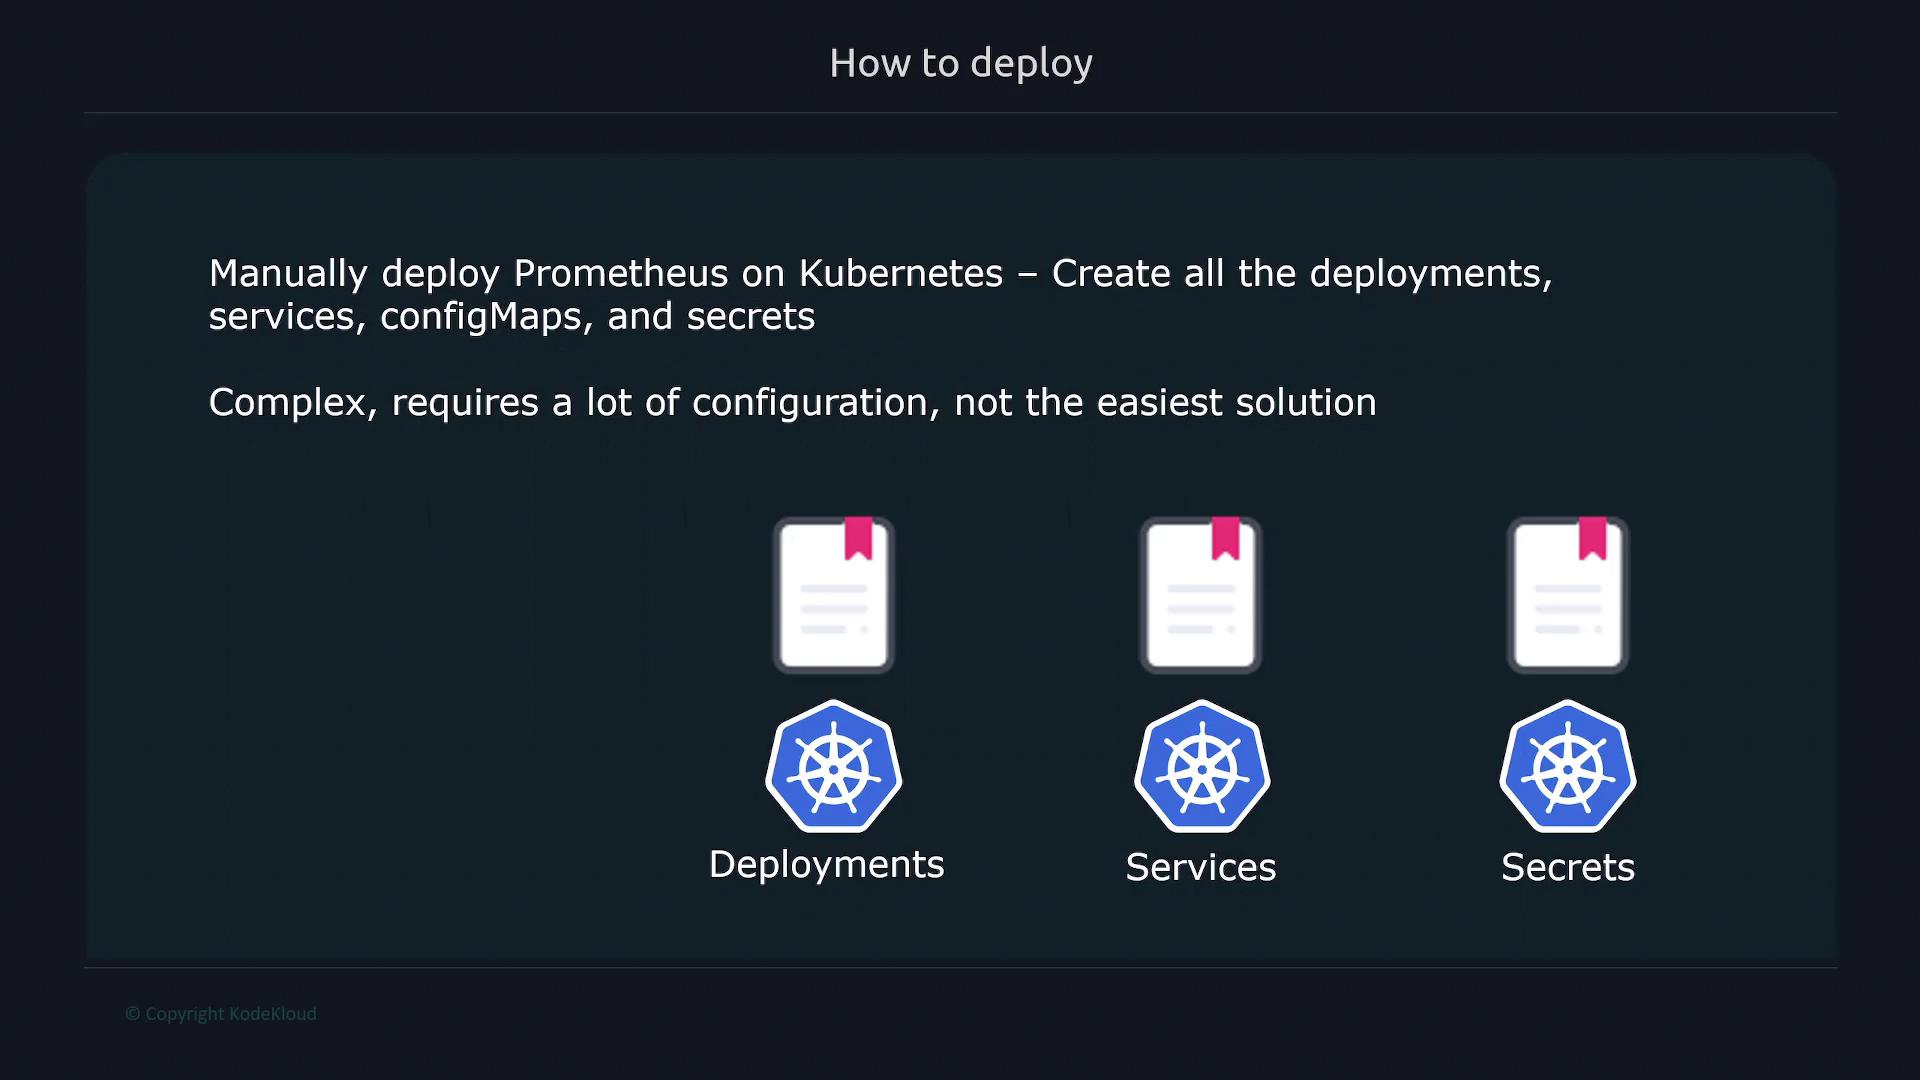
2. Using Helm and the Prometheus Operator
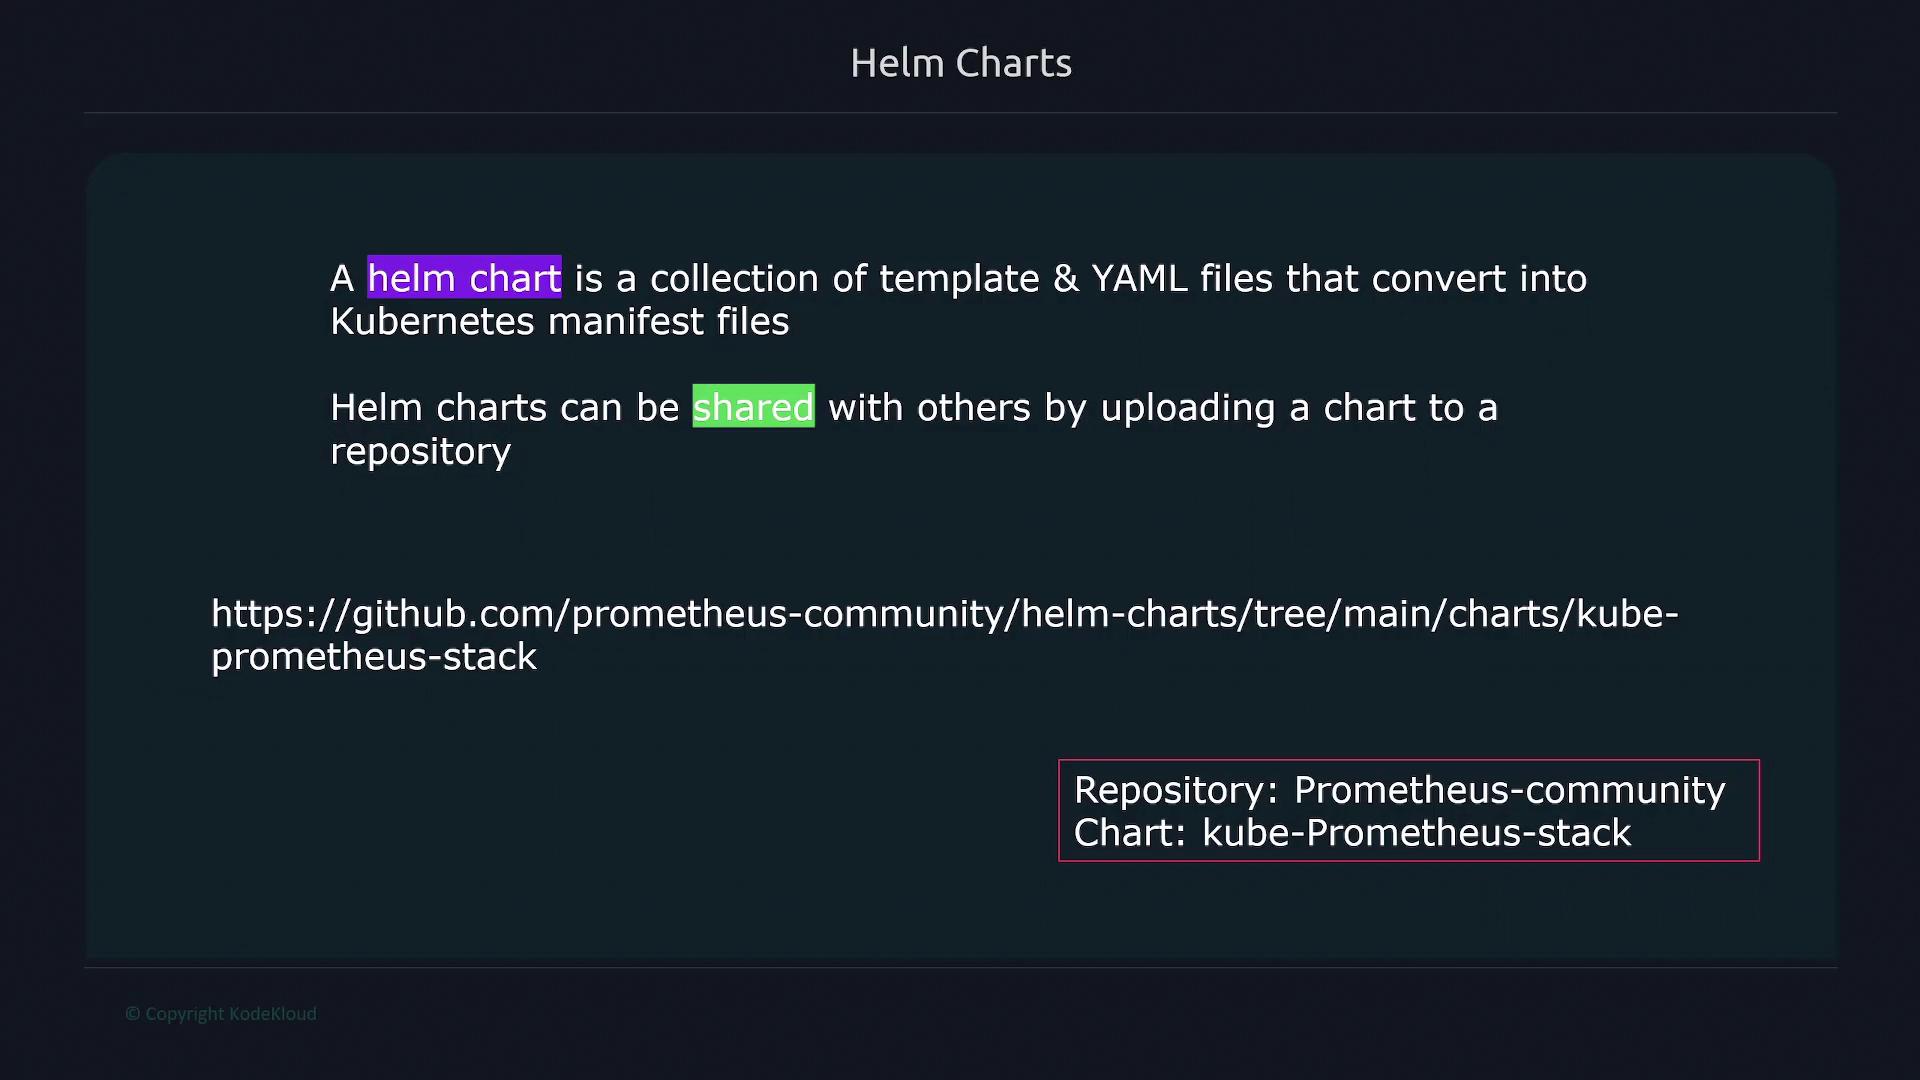
A more straightforward approach involves deploying Prometheus using a Helm chart, specifically the kube-prometheus stack from the Prometheus Community repository. Helm—a package manager for Kubernetes—bundles all necessary configurations and dependencies into a single package, making deployment and management significantly easier.
The Prometheus Operator and Custom Resources
The Prometheus Operator simplifies the management of Prometheus within a Kubernetes environment. By extending the Kubernetes API with custom resources, the operator streamlines tasks such as initialization, configuration, scaling, upgrading, and lifecycle management of complex applications. Using the Prometheus Operator, you can deploy a Prometheus instance via a custom resource named “Prometheus” rather than managing Deployments or StatefulSets manually. This abstraction simplifies modifications and ongoing operations. For example, a Prometheus custom resource might be defined as follows: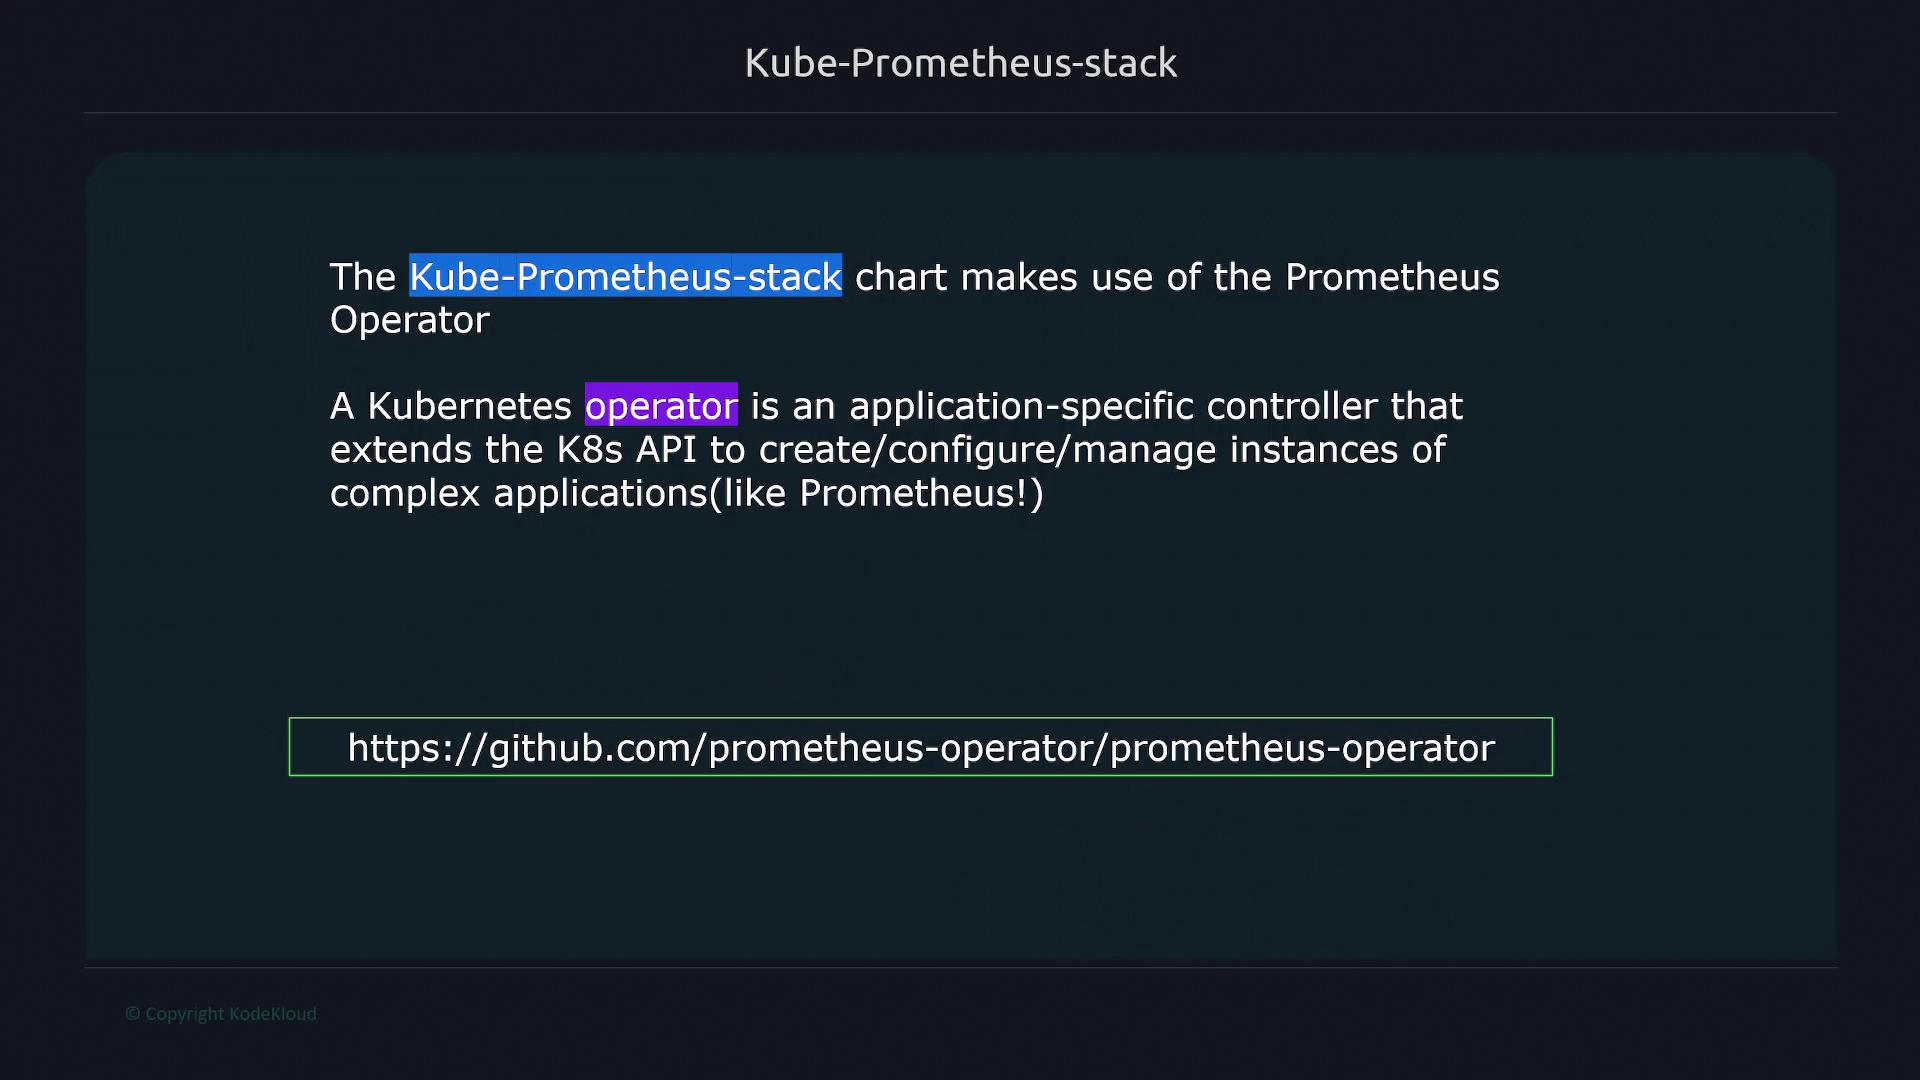
Leveraging the Prometheus Operator significantly simplifies the deployment and lifecycle management of Prometheus on Kubernetes by automatically handling configuration changes, restarts, and upgrades.