Use this file to discover all available pages before exploring further.
This guide demonstrates how to add new scrape targets to Prometheus using the ServiceMonitor custom resource. Leveraging Kubernetes Custom Resource Definitions (CRDs) allows you to declaratively configure Prometheus to automatically discover and scrape new endpoints—no manual configuration updates necessary.
The Prometheus Operator deploys several CRDs to provide a high-level abstraction for deploying and configuring Prometheus. Key CRDs include those for AlertManager, Prometheus, and ServiceMonitor. To list all available CRDs, run:
kubectl get crd
Sample output:
NAME CREATED ATalertmanagerconfigs.monitoring.coreos.com 2022-11-18T01:18:55Zalertmanagers.monitoring.coreos.com 2022-11-18T01:18:55Zeniconfigs.crd.k8s.amazonaws.com 2022-11-18T01:04:11Zpodmonitors.monitoring.coreos.com 2022-11-18T01:18:56Zprobes.monitoring.coreos.com 2022-11-18T01:18:56Zprometheuses.monitoring.coreos.com 2022-11-18T01:18:57Zprometheusrules.monitoring.coreos.com 2022-11-18T01:18:56Zsecuritygrouppolicies.vpcresources.k8s.aws 2022-11-18T01:04:14Zservicemonitors.monitoring.coreos.com 2022-11-18T01:18:57Zthanostruers.monitoring.coreos.com 2022-11-18T01:18:57Z
The ServiceMonitor CRD is particularly important because it enables you to define additional scraping targets (jobs) for Prometheus. Every ServiceMonitor is handled by Prometheus like any other Kubernetes resource.
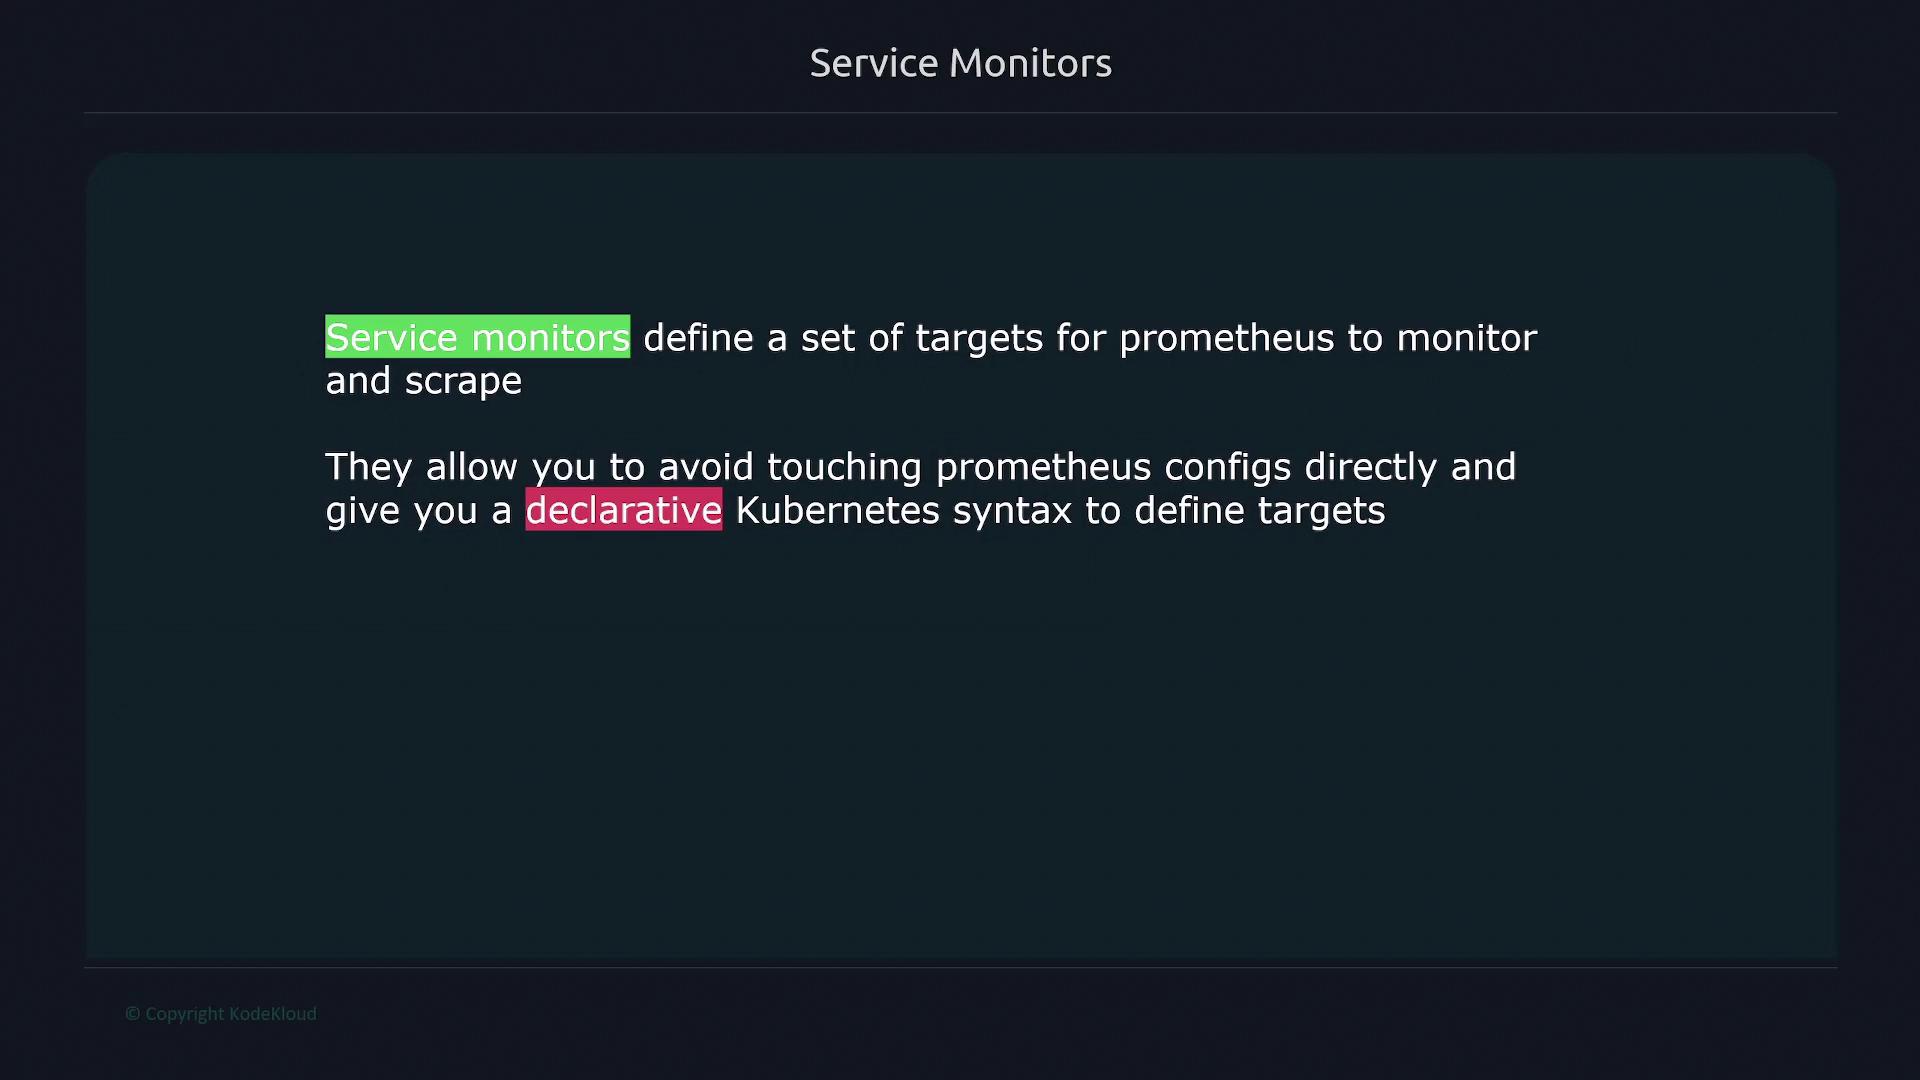
A ServiceMonitor resource specifies a set of targets for Prometheus to monitor and scrape. Instead of manually editing the Prometheus configuration, you can use Kubernetes’ declarative syntax. When a ServiceMonitor is created, Prometheus discovers it via its selector settings and automatically begins scraping the defined endpoints.
Using ServiceMonitors, you can automatically associate Kubernetes Services with Prometheus scrape configurations through label selectors. This many-to-one mapping streamlines the process of updating endpoints, avoiding the need to revise Prometheus configuration files each time a new endpoint is added.For instance, if you have deployed an application with an associated Kubernetes Service, simply create a ServiceMonitor that references it to include its endpoints in Prometheus’ scrape targets.
Labels and Selectors:
The ServiceMonitor’s selector.matchLabels finds services with the label app: service-api. Ensure your Service definition matches this label.
Endpoint Configuration:
The specified endpoint in the ServiceMonitor defines a 30-second scrape interval, uses the port named web, and sets the metrics path to /swagger-stats/metrics (customize as needed).
Job Label Mapping:
The jobLabel property maps the job label from your Service resource (e.g., job: node-api) which Prometheus uses as the job name.
This instructs Prometheus to include any ServiceMonitor with the label release: prometheus in its target list. Ensure that your ServiceMonitor resource carries this label for successful integration.
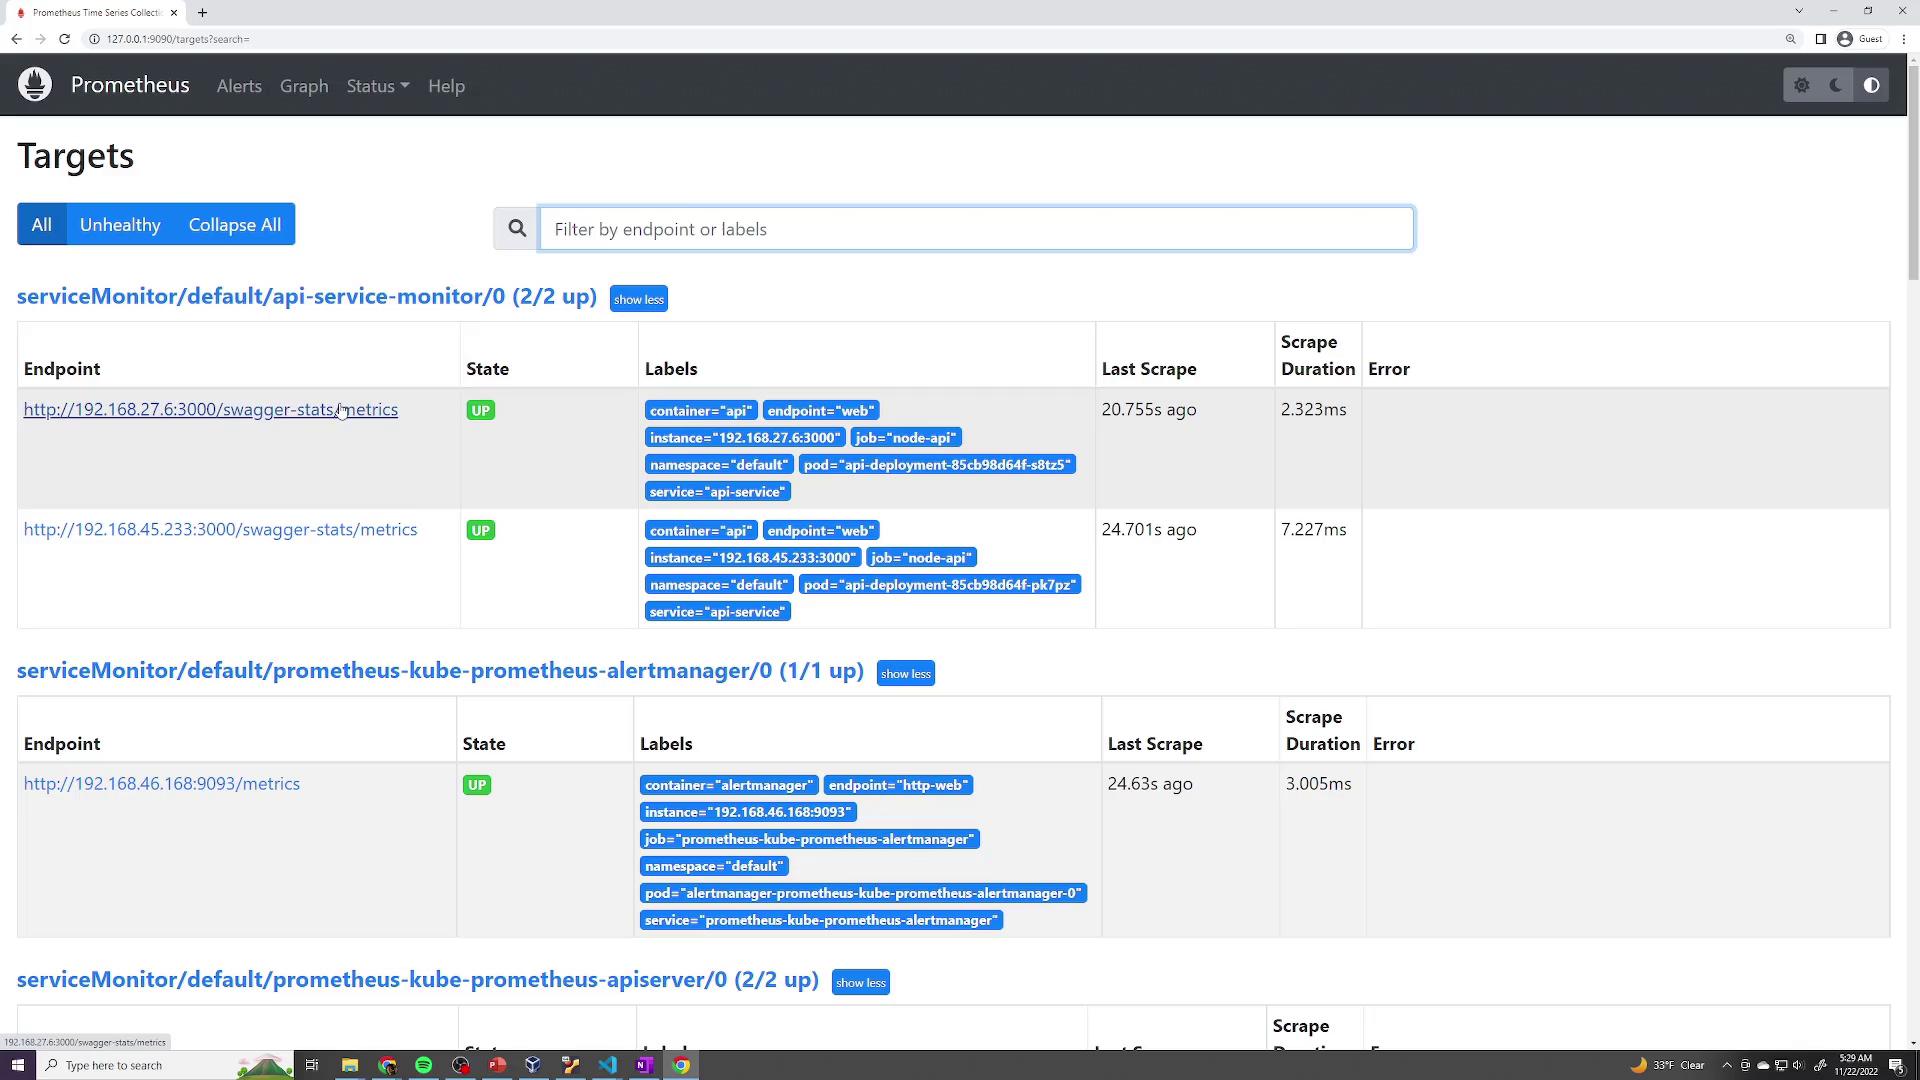
After deployment, open the Prometheus UI and navigate to Status → Targets. Your API ServiceMonitor should be listed, indicating that Prometheus is scraping it according to the defined settings.
Additionally, running a query such as job="node-api" in Prometheus will help verify that the metrics are being collected from the API service.
For an in-depth review, you can inspect the generated Prometheus scrape configuration. This shows that ServiceMonitor settings—including metrics_path, scrape_interval, and relabeling configurations—have been correctly applied. Here’s an excerpt from the generated configuration:
Leverage Kubernetes CRDs to extend Prometheus functionality.
Create a ServiceMonitor resource to define additional scrape targets.
Align your Kubernetes Service labels with ServiceMonitor selectors.
Verify that Prometheus dynamically scrapes newly added endpoints without manual configuration updates.
By following these practices, you can maintain a scalable and declarative monitoring setup for your Kubernetes applications.For further details, check out the following resources: